


Abstract
The Arabidopsis (Arabidopsis thaliana) root epidermis is a simple model for investigating cell fate specification and pattern formation. In addition to regulatory networks consisting of transcription factors, histone deacetylases are also involved in the formation of cellular patterns. Here, we report thatHistone Deacetylase19 (HDA19) affects the root epidermal cellular pattern through regulation of cortical cell fate by interacting with SCARECROW (SCR). HDA19 binds to the DNA sequence upstream of SCR, as well as to those of several of SCR’s target genes, and regulates their expression. Mutant lines of several SCR target genes show impaired patterns of epidermal differentiation and cortical cell division, similar to that of hda19. This work presents HDA19 and SCR as two further players in the regulation of cortical and epidermal cell specification and describes an additional function for SCR.
The root of Arabidopsis (Arabidopsis thaliana) is a simple model that is particularly suitable to the study of cell fate specification and pattern formation. Root tissues are organized as concentric cylinders with roughly three parts: the ground tissue, stele, and outer epidermis. The ground tissue, including an outer layer of cortex and an inner layer of endodermis, encloses the stele and is surrounded by the outer epidermis (Dolan et al., 1993). These tissues are derived from specific groups of initial cells, which, together with the quiescent center (QC), form the stem cell niche at the root tip (Dolan et al., 1993; van den Berg et al., 1997).
The root epidermis is composed of two cell types: those that form root hairs (hair cells or H cells) and those that do not (nonhair cells or N cells). The H cells normally localize over the cleft between two underlying cortical cells, whereas the N cells lie over a single cortical cell (Dolan et al., 1994; Berger et al., 1998). Prior to root hair outgrowth, the fate of the two cell types is determined according to their position and can be distinguished by their different cellular characteristics, such as cytoplasmic density and gene expression (Dolan et al., 1994; Larkin et al., 2003; Schiefelbein et al., 2009). Previously, it has been reported that a set of transcription factors, including Myb domain proteins, WEREWOLF (WER), CAPRICE (CPC), TRIPTYCHON (TRY), and ENHANCER OF TRIPTYCHON AND CARPRICE1 (ETC1); bHLH domain proteins, GLABRA3 (GL3) and ENHANCER OF GLABRA3 (EGL3); a WD-repeat protein, TRASNPARENT TESTA GLABRA (TTG); the homeodomain protein, GL2; and others, are responsible for the cellular patterning of the epidermis through a complicated interaction network (Galway et al., 1994; Rerie et al., 1994; Lee and Schiefelbein, 1999; Bernhardt et al., 2003; Kirik et al., 2004; Caro et al., 2007). Two membrane-localized receptor-like kinases, SCRAMBLED (SCM) and BRASSINOSTEROID INSENSTITIVE1, are involved in the cellular patterning by mediating an unknown positional signal derived from the underlying cortical cells (Kwak et al., 2005; Dolan, 2006; Kuppusamy et al., 2009). In addition to transcription factors, histone modifications, especially histone acetylation, were found to enhance the robustness of the transcription factor network (Xu et al., 2005; Li et al., 2015; Zhu et al., 2017) and regulate kinase gene expression (Liu et al., 2013).
Except for the role of JACKDAW (JKD), little is known about how cortical cell differentiation plays a role in root epidermal cell patterning (Hassan et al., 2010). A single cortex layer is initiated from the cortex/endodermis initial (CEI) cells. Both cortex and endodermis are derived after two successive asymmetric cell divisions of the CEI. The GRAS family transcription factors SCARECROW (SCR) and SHORT-ROOT (SHR) play critical roles in ground tissue patterning and identity maintenance (Di Laurenzio et al., 1996; Helariutta et al., 2000). SCR is predominantly expressed in the QC, the CEI, and the endodermis. SHR moves from the stele into the endodermis, where it is sequestered in the nucleus by SCR (Sabatini et al., 2003; Cui et al., 2007; Clark et al., 2016). The interaction between SCR and SHR determines CEI identity, promotes its asymmetric cell division, and specifies the fates of cortex and endodermis by forming a cell type-specific regulatory network with other transcription factors such as JKD, MAGPIE (MGP), NUTCRACKER (NUC), and other BIRD factors (Long et al., 2015, 2017; Moreno-Risueno et al., 2015). As the root ages, the endodermis undergoes another asymmetric cell division to give rise to a second layer of cortex, termed the middle cortex (Baum et al., 2002; Paquette and Benfey, 2005). Interestingly, SCR suppresses this second cell division, which contrasts with its function in promoting CEI cell division (Cui and Benfey, 2009b). It has been suggested that the two opposite functions of SCR are achieved by interacting with different partners through different domains (Cui and Benfey, 2009a).
Previously, it was demonstrated that an inhibitor of histone acetylation, trichostatin A, could induce H cell differentiation at N cell positions (Xu et al., 2005). We carried out a systematic screen to identify the members of the histone acetyltransferase and histone deacetylase (HDAC) family that are involved in cellular patterning of the root epidermis (Chen et al., 2016). In addition to HDA18 and HDA6, mutations in HDA19 also exhibit an altered cellular pattern of the root epidermis (Liu et al., 2013; Li et al., 2015; Chen et al., 2016). Here, we report that HDA19 functions primarily in differentiation of cortex cells through interaction with SCR in CEI cells. The altered cellular patterning of root epidermis observed in the hda19 mutant is thus derived from altered differentiation of the cortex. These findings demonstrate that HDA19 enhances the function of SCR in its role in regulating ground tissue differentiation in the Arabidopsis root.
RESULTS
HDA19 Is Required for Cellular Patterning of Root Epidermis and Cortex
In our previous studies, we demonstrated the function of histone acetylation regulation in Arabidopsis root epidermal patterning, both by trichostatin A treatment and screening of HDAC mutants (Xu et al., 2005; Chen et al., 2016). We discovered two different regulatory mechanisms for HDA18 and HDA6 (Liu et al., 2013; Li et al., 2015). We also observed in mutants of a third HDAC gene, HDA19, that there was a significant increase of both ectopic H cells at the N positions and ectopic N cells at the H positions (Fig. 1, A and B, indicated by black and red arrows; Table 1). Also, cell number in the cortex layer of hda19 increased, with an average of 8.8 cells in 5-d-old seedlings and 10.4 cells in 8-d-old seedlings, as compared with the eight cells in the wild type (red asterisks in Fig. 1, A and B; Table 1). Accordingly, the percentage of N cells at H positions rose from an average of 8.1% in 5-d-old seedlings to 21.9% in 8-d-old seedlings. A plausible scenario is that cells at the newly formed H position between two cells produced by the ectopic anticlinal cortex cell division failed to change fate accordingly (Fig. 1B, indicated by the red arrow). Moreover, an additional layer between cortex and endodermis appeared in most hda19 roots in 8-d-old seedlings (95% in hda19 relative to 0% in Col; Fig. 1, A and B; Table 1). There was also a slight increase in endodermis cell number (Table 1). We complemented the hda19 mutation with the translational fusion, HDA19pro:HDA19-EGFP (enhanced green fluorescent protein; Fig. 1D; Table 1), and found GFP in all cell layers of the root tip (Supplemental Fig. S1D).
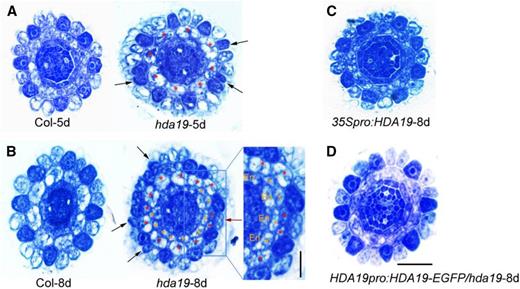
The hda19 mutant has defects in root epidermal cell and ground tissue patterning. Cross-section images show Toluidine Blue-stained root tips of wild-type Columbia (Col) and hda19 mutant at 5 and 8 d old (A and B, respectively), 35Spro:HDA19 (overexpression line) at 8 d old (C), and HDA19pro:HDA19-EGF/hda19 (complementation line) at 8 d old (D). Black arrows indicate darkly stained hair cells (H cells) at N positions, and the red arrow indicates lightly stained nonhair cells (N cells) at H positions. Red asterisks indicate the original cortical cells, and orange asterisks indicate the additional cortical layer. En, Endodermis. Bar in the inset of B = 10 μm; bar in D = 20 μm and applies for all other micrographs.
Quantification of ectopic epidermal cell differentiation and abnormal ground tissue cell number in the root tips of 8-d-old seedlings of the wild type (Col), hda19 mutant, HDA19-overexpressing line, and HDA19-EGFP driven by the HDA19 promoter and tissue-specific promoters
Values represent means ± sd. Eight-day-old seedlings were used for quantification except for hda19, which used 5-d-old seedlings. n, The number of seedlings examined for each material.
| Sample | Ratio of Root Hair (%) | N Cells at H Positions (%) | H Cells at N Positions (%) | Cortex Cell No. | Endodermis Cell No. | Ratio of Additional Layer (%) | n |
|---|---|---|---|---|---|---|---|
| Col | 42.3 ± 2.2 | 0.8 ± 1.3 | 2.0 ± 2.8 | 8.0 ± 0.0 | 8.0 ± 0.1 | 0 | 17 |
| hda19 5 d old | 47.4 ± 3.1a | 8.1 ± 6.1a | 17.2 ± 4.9a | 8.8 ± 1.0 | 8.3 ± 0.4 | 46.2 | 12 |
| hda19 8 d old | 46.7 ± 5.4 | 21.9 ± 8.5a | 17.9 ± 7.9a | 10.4 ± 0.8a | 9.4 ± 0.8a | 95.0 | 20 |
| 35Spro:HDA19 | 42.3 ± 2.4 | 0 ± 0 | 1.8 ± 2.7 | 8.0 ± 0.1 | 8.0 ± 0.0 | 0 | 23 |
| HDA19pro:HDA19-EGFP/hda19 | 43.3 ± 3.7 | 2.7 ± 4.2b | 1.9 ± 2.9b | 8.3 ± 0.5b | 8.5 ± 0.6b | 11.5 | 26 |
| WERpro:HDA19-EGFP/hda19 | 40.6 ± 3.7 | 17.8 ± 9.2a | 8.0 ± 4.0a,b | 9.6 ± 1.0a | 8.8 ± 0.6a | 50.0 | 20 |
| JKDpro:HDA19-EGFP/hda19 | 43.3 ± 3.1 | 4.5 ± 4.3b | 3.9 ± 3.9b | 8.4 ± 0.5b | 8.3 ± 0.5b | 19.2 | 26 |
| SCRpro:HDA19-EGFP/hda19 | 43.9 ± 4.0 | 1.5 ± 2.0b | 7.2 ± 5.2a,b | 8.4 ± 0.6b | 9.0 ± 0.8a | 12.5 | 32 |
| SHRpro:HDA19-EGFP/hda19 | 47.7 ± 3.6a | 14.6 ± 4.8a | 15.9 ± 4.8a | 9.3 ± 1.2a | 8.3 ± 0.5b | 66.7 | 21 |
Differs significantly from wild-type Col (P < 0.01, Student’s t test).
Differs significantly from 8-d-old hda19 mutant for the complementation lines of HDA19-EGFP (P < 0.01, Student’s t test).
To determine how HDA19 affects the cellular patterning of the root epidermis, we first examined the expression of known patterning genes using reverse transcription quantitative PCR (RT-qPCR). In hda19, CPC, TRY, and SCM were down-regulated, whereas ETC1 and MYB23 were up-regulated (Fig. 2A). Using marker lines, we found no change in the WERpro:GFP expression pattern (Fig. 2B). In lines expressing GL2pro:GFP and CPCpro:GUS, several cells at the N position had undetectable GL2pro:GFP signal and ectopically expressed CPCpro:GUS (Fig. 2, C and D), indicating that these cells adopted the H cell fate. Interestingly, the signal from SCMpro:GUS was dramatically decreased in the root tip, whereas the signal in the hypocotyl was unchanged as compared with that in the wild type (Fig. 2, E–G). Down-regulation of SCM expression in the root was confirmed by RT-qPCR (Fig. 2A). Since SCM is a membrane receptor-like kinase important for sensing an unknown positional signal derived from the cortex, the effect of HDA19 on the regulation of SCM expression implies that HDA19 may act upstream of this regulatory network.
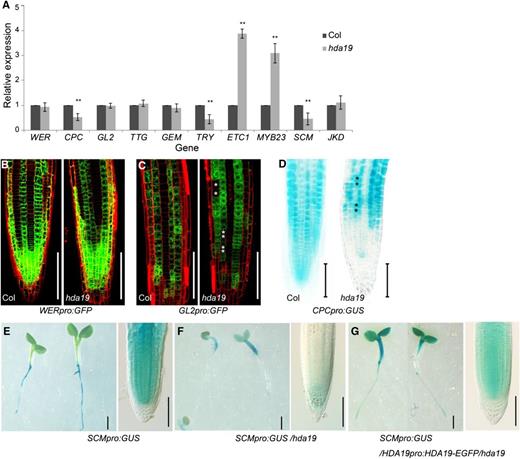
HDA19 affects the expression of root epidermal patterning genes. A, Expression levels of genes in 8-d-old root tips of hda19 determined via RT-qPCR. The values are shown as means ± sd (**, P < 0.01, Student’s t test). At least three biological repeats were carried out. B and C, Confocal microscopy images of the root tip (epidermal view) of WERpro:GFP (B) and GL2pro:GFP (C) expression pattern in wild-type and hda19 backgrounds. Asterisks indicate non-GL2-expressing cells in the continuous GL2-expressing files in hda19. Bars = 100 μm. D, CPCpro:GUS expression in 5-d-old root tip in wild-type and hda19 backgrounds. Asterisks indicate ectopic CPC-expressing cells in the continuous non-CPC-expressing files in hda19. Bars = 100 μm. E to G, SCMpro:GUS expression in 5-d-old seedlings (left) and root tip (right) in wild-type (E), hda19 (F), and HDA19pro:HDA19-EGFP/hda19 (G) backgrounds. Bars at left = 1 mm and bars at right = 100 μm.
To determine if HDA19 can bind directly to the patterning genes that had altered expression in hda19, we performed chromatin immunoprecipitation (ChIP) and found that none of the tested regions of the patterning genes were enriched (Supplemental Fig. S2, A and B). However, global elevation of histone H3 and H4 acetylation levels on these genes was observed (Supplemental Fig. S2, C and D), both when these genes were up- and down-regulated in hda19. To rule out an effect of HDA19 on the proteins encoded by the patterning genes, we carried out a yeast two-hybrid assay. No relevant protein-protein interactions were found in this assay (Supplemental Fig. S3). These results suggest that HDA19 regulates the expression of these genes in an indirect manner.
HDA19 Affects Cortex Cell Fate Required for Epidermal Differentiation
As our data indicated that the altered cellular pattern of the root epidermis in hda19 does not result from direct regulation by HDA19, we hypothesized that HDA19 acts through the control of cortex differentiation. To test this hypothesis, we examined the expression pattern of CO2pro:NLS-YFP (nuclear localization signal-yellow fluorescent protein), an early cortex-specific marker whose expression marks cortex identity (but not CEI cells). Strikingly, the signal of CO2pro:NLS-YFP in hda19 was greatly decreased as compared with that in the wild type, with the signal observed only randomly in a few cortex cells (Fig. 3A). This result was confirmed by RT-qPCR (Fig. 3E). By contrast, the endodermis-specific marker En7pro:NLS-YFP was expressed normally in hda19 (Fig. 3, B and E). We also examined the expression pattern of SCRpro:GFP-SCR and SHRpro:SHR-GFP in hda19 and found no detectable changes (Fig. 3, C and D). These results indicate that HDA19 mainly affects the identity of the root cortex but not the endodermis.
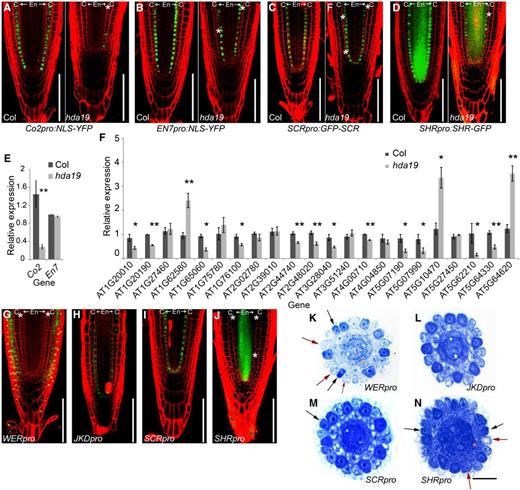
HDA19 affects root cortex gene expression and regulates proper epidermal differentiation though its action in the ground tissue. A to D, Confocal microscopy images of YFP or GFP signal in root tips of 8-d-old seedlings. White asterisks indicate the additional middle layer of the ground tissue. C, Cortex; En, endodermis. Bars = 100 μm. E, Expression levels of Co2 and En7 genes in 8-d-old root tips of hda19 determined via RT-qPCR. F, Expression levels of selected cortex-specific expression genes in 5-d-old root tips of hda19 determined via RT-qPCR. Error bars represent sd from three biological replicates (*, P < 0.05 and **, P < 0.01, Student’s t test). G to J, Confocal microscopy images of HDA19-EGFP 8-d-old root tip expression driven by tissue-specific promoters in hda19. White asterisks indicate the additional layer of ground tissue. Bars = 100 μm. K to N, Cross sections of Toluidine Blue-stained root tips of 8-d-old seedlings of HDA19-EGFP driven by tissue-specific promoters in hda19. Black arrows indicate the darkly stained hair cells (H cells) at N positions, and red arrows indicate the lightly stained nonhair cells (N cells) at H positions. Orange asterisks indicate the additional layer of ground tissue. Bar = 20 μm.
To confirm the findings based on marker line analysis, we examined cortex-specific gene expression levels by RT-qPCR. We reasoned that these genes represent certain properties of cortex cell fate, since they are expressed specifically in cortex. Among 82 genes specifically expressed in meristematic cortex (Brady et al., 2007; http://bar.utoronto.ca/efp/cgi-bin/efpWeb.cgi), four Gene Ontology categories were identified: membrane, glycoprotein, nucleotide-binding, and signaling genes. We selected 22 meristematic cortex genes from these four groups (Supplemental Table S1) and found that 12 of these were down-regulated and three were up-regulated in hda19 (Fig. 3F). These results indicate that HDA19 affects cortex cell identity.
HDA19 Acts in the Ground Tissue to Regulate Epidermal Cell Fate
To determine if HDA19 controls epidermal cell fate by acting in the cortex, we drove expression of the HDA19 coding region fused to GFP with the tissue-specific promoters WERpro (epidermis specific), JKDpro (ground tissue specific), SCRpro (endodermis specific), and SHRpro (vascular tissue specific) in hda19. As mentioned above, HDA19pro:HDA19-EGFP/hda19 fully complements the hda19 mutant phenotype (Fig. 1D), demonstrating the functionality of the HDA19-EGFP construct. We found that HDA19-EGFP expression in the epidermis controlled by the WER promoter failed to restore either epidermis or ground tissue patterning (Fig. 3, G and K; Table 1). HDA19-EGFP expression in the ground tissue under the control of the JKD promoter was able to fully rescue both epidermal differentiation and the ground tissue cell division pattern (Fig. 3, H and L; Table 1). Unexpectedly, endodermis-specific expression of HDA19-EGFP controlled by the SCR promoter could also restore the cortical cell division pattern and partially rescue the epidermal phenotype of hda19 (Fig. 3, I and M; Table 1). However, lines expressing HDA19-EGFP in the vascular tissue controlled by the SHR promoter still exhibited abnormal epidermal and ground tissue patterning (Fig. 3, J and N; Table 1). We also examined the expression pattern of SCRpro:GFP-SCR and SHRpro:SHR-GFP in hda19 and found no obvious changes (Fig. 3, C and D), indicating that CEI and endodermis identity are intact in hda19. Taken together, our results demonstrate that HDA19 affects cortex cell fate and gene expression. Moreover, HDA19 expressed in the ground tissue is able to non-cell-autonomously regulate epidermal patterning.
HDA19 Interacts with SCR in the CEI
To determine how HDA19 affects cortex differentiation, we asked if HDA19 can interact with known factors involved in ground tissue differentiation. Using a yeast two-hybrid assay, we found that HDA19 can interact with SCR and MGP but not with SHR or JKD (Fig. 4A; Supplemental Fig. S4). Also, HDA19 could not indirectly interact with SHR or JKD using SCR or MGP as a bridge in a yeast three-hybrid assay (Supplemental Fig. S5). To identify the interacting domains, we performed a yeast two-hybrid assay with truncated fragments of HDA19 and SCR. Interaction took place between the HDAC domain of HDA19 and the ND domain (N-terminal variable domain, known to suppress ectopic asymmetric cell divisions) of SCR (Alinsug et al., 2009; Cui and Benfey, 2009b; Fig. 4, B and C; Supplemental Fig. S4, A and B). We confirmed the interaction of HDA19 and SCR in planta using bimolecular florescence complementation (BiFC) and transient expression (Fig. 4D).
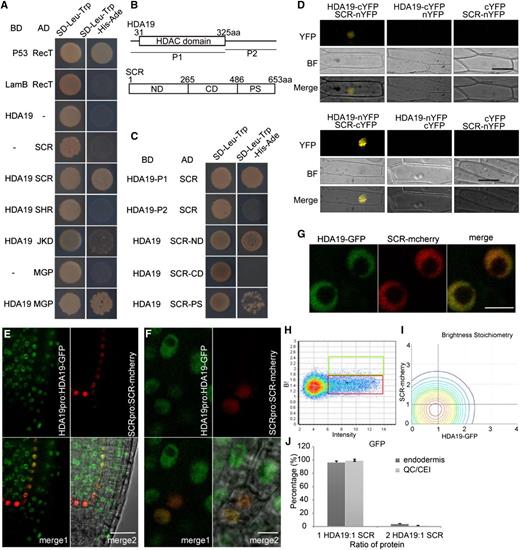
HDA19 interacts with SCR. A, Yeast two-hybrid analysis of protein interactions between HDA19 and some proteins important to ground tissue development. B, Molecular structures of HDA19 protein and SCR protein and their fragments used in the yeast two-hybrid assay. aa, Amino acids. C, Yeast two-hybrid analysis of the interaction between fragments of HDA19 and SCR protein and between HDA19 protein and fragments of SCR, respectively. D, BiFC assay of HDA19 and SCR protein interaction in onion (Allium cepa) epidermis as the living cell. BF, Bright field; cYFP, C terminus of YFP; nYFP, N terminus of YFP. Bars = 50 μm. E, Confocal images of longitudinal root sections in HDA19pro:HDA19-GFP and SCRpro:SCR-mCherry line. Scale bar = 25 μm. F, Confocal images of CEI/CEID cells in HDA19pro:HDA19-GFP and SCRpro:SCR-mCherry line. Scale bar = 5 μm. G, Confocal images of HDA19-GFP/SCR-mCherry nuclei used for cross number and brightness analysis. Scale bar = 5 μm. H, Brightness versus intensity plot for HDA19pro:HDA19-GFP in the meristem. The red and green boxes represent the HDA19-GFP monomer and homodimer, respectively. I, Stoichiometry histogram from cross number and brightness analysis of HDA19pro:HDA19-GFP and SCRpro:SCR-mCherry. J, Average percentages of 1:1 and 2:1 HDA19-GFP and SCR-mCherry interactions in endodermis and QC/CEI cells. Error bars represent sd (n = 5).
To determine how SCR, an endodermis-specific protein, interacts with HDA19, we carried out fluorescence correlation spectroscopy (FCS) to see where the two proteins interact in vivo. FCS is a noninvasive technique that measures fluctuations of fluorescently tagged proteins in vivo to determine dynamics of protein binding and movement. Specifically, we used an FCS technique called cross-correlation number and brightness to determine the binding and stoichiometric ratio of the SCR-HDA19 complex (Petrásek and Schwille, 2008; Digman and Gratton, 2011; Clark et al., 2016). To do this, we generated a line with both HDA19pro:HDA19-EGFP and SCRpro:SCR-mCherry (Fig. 4, E–G) and measured cross-correlation of EGFP and mCherry brightness in the QC, CEI, and endodermis (Fig. 4, H and I). We found that SCR and HDA19 interact in vivo in the CEI and bind primarily (98.8%) in a 1:1 ratio (Fig. 4J).
HDA19 Binds to the SCR Promoter and SCR Target Genes and Affects Their Expression
To determine if HDA19 functions through interaction with SCR, we performed ChIP-PCR using a GFP antibody in the HDA19pro:HDA19-EGFP/hda19 line. We found enrichment of the promoter sequence of SCR as well as the promoter regions of the SCR target genes MGP, NUC, RLK, and Brassinosteroids-6-oxidase2 (BR6OX2; Fig. 5, A–G). To determine if the binding of HDA19 to the SCR target genes is dependent on SCR, we examined the binding of HDA19pro:HDA19-EGFP/hda19 in an scr-3 background and found increased enrichment of several regions upstream of SCR, MGP, and BR6OX2 (Fig. 5, B–G). This suggests that not only can HDA19 directly bind to the chromatin upstream of SCR and its target genes but also that SCR interferes with the binding of HDA19 protein to some of its target genes.
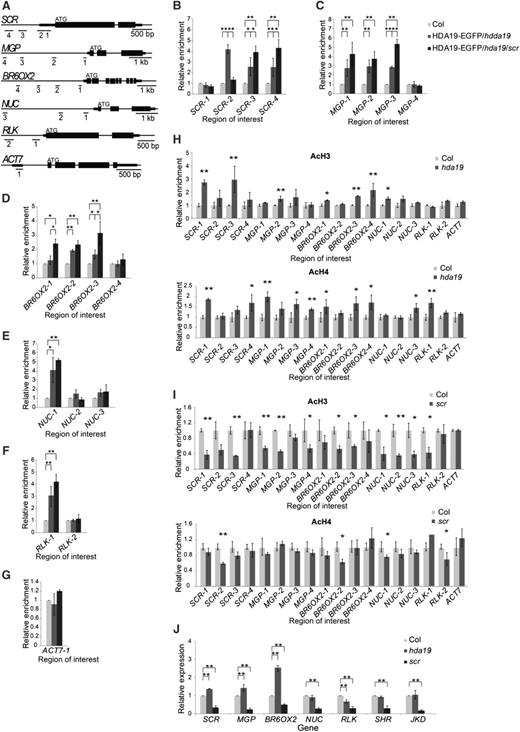
HDA19 binds to SCR’s target genes and regulates their expression. A, Schematic of the SCR gene and SCR’s target genes. Regions selected for ChIP analysis are underlined. B to G, ChIP-qPCR analysis of HDA19 binding via GFP antibody in HDA19pro:HDA19-EGFP/hda19 (HDA19-GFP/hda19) and HDA19pro:HDA19-EGFP/hda19/scr (HDA19-GFP/hda19/scr). The values are shown as means ± sd (*, P < 0.05 and **, P < 0.01, Student’s t test). H and I, ChIP-qPCR analysis of histone H3 and H4 acetylation level changes in hda19 (H) and scr-3 (I) compared with the wild type (Col). Error bars represent sd (*, P < 0.05 and **, P < 0.01, Student’s t test). J, Expression of target genes in the 5-d-old root tip of hda19 and scr-3 compared with Col determined via RT-qPCR. The values are shown as means ± sd ( **, P < 0.01, Student’s t test).
To test if HDA19 functions through its histone deacetylase activity, which was confirmed in vitro as reported previously (Tian et al., 2005; Fong et al., 2006), we examined acetylation levels of H3 and H4 at the promoter regions of the HDA19-bound genes. We found that acetylation levels of common HDA19- and SCR-bound genes were increased in hda19 (Fig. 5H), indicating regulation by deacetylation of HDA19. In contrast, the acetylation levels of H3 and H4, especially H3, were significantly decreased for the HDA19- and SCR-bound genes in scr (Fig. 5I). This is consistent with the finding that SCR may interfere with the binding of HDA19 to its target genes.
We next determined the expression levels of the target genes in hda19 and scr. Consistent with previous reports (Cui et al., 2007), expression of MGP, NUC, RLK, and BR6OX2 was greatly down-regulated in scr. In hda19, expression of SCR, MGP, and BR6OX2 was up-regulated (Fig. 5J), suggesting that HDA19 plays a role in modifying the transcriptional activity of SCR for some of its target genes. As expected, no such effect was observed in the expression of SHR or JKD (Fig. 5J).
Taken together, we conclude that HDA19 interacts with SCR, probably in the CEI and endodermis, and affects the expression of SCR and some SCR target genes.
SCR and Its Target Genes Are Involved in Arabidopsis Root Epidermal Differentiation
The finding that SCR interacts with HDA19 at the ND domain led to the hypothesis that the ND domain is important for cortex differentiation. Detailed examination of cortex cell division in SCRpro:GFP-SCR(ƊND)/scr (SCRƊND) lines revealed the appearance of a middle cortex layer, as reported earlier (Cui and Benfey, 2009b), as well as ectopic anticlinal cortex cell divisions resulting in increased cortex cell numbers (Fig. 6C; Table 2). In contrast to that in scr-3, which has a mutation resulting in a premature stop in the C-terminal PFYRE/SAW (PS) domain, the expression of BR6OX2, MGP, and SHR was significantly up-regulated, whereas JKD expression was normal in SCRƊND roots (Supplemental Fig. S6). SCRƊND also had an altered epidermal differentiation pattern, with both ectopic H cells at N positions and N cells at H positions (Fig. 6C; Table 2). SCM expression in SCRƊND root tips was slightly down-regulated, whereas it was highly up-regulated in scr-3 (Supplemental Fig. S7F). These phenotypic and gene expression changes in the SCRƊND lines were similar to those in hda19, indicating that SCR can regulate epidermal cell specification and cortex cell division.
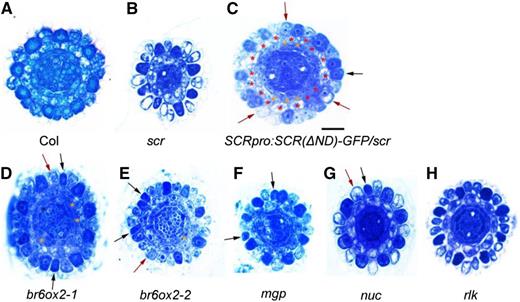
Mutant alleles of scr, SCRƊND, and its target genes have defects in root epidermal cells and ground tissue patterning. Cross-section images show Toluidine Blue-stained root tips of 8-d-old seedlings in the wild type (A), scr-3 (B), SCRpro:SCR(∆ND)-GFP/scr-4 (C), br6ox2-1 (D), br6ox2-2 (E), mgp (F), nuc (G), and rlk (H). Black arrows indicate the darkly stained hair cells (H cells) at N positions, and red arrows indicate the lightly stained nonhair cells (N cells) at H positions. Red asterisks indicate the original cortical cells, and orange asterisks indicate the additional cortical layer. Bar in C = 20 μm and applies to all other micrographs.
Quantification of ectopic epidermal cell differentiation and abnormal ground tissue cell number in the root tips of 8-d-old seedlings of scr-3, SCRƊND, and mutant alleles of SCR target genes
Values represent means ± sd. Eight-day-old seedlings were used. n, The number of seedlings examined. The cell number of the mixed layer of cortex and endodermis is quantified in scr-3.
| Sample | Ratio of Root Hair (%) | N Cells at H Positions (%) | H Cells at N Positions (%) | Cortex Cell No. | Endodermis Cell No. | Ratio of Additional Layer (%) | n |
|---|---|---|---|---|---|---|---|
| scr-3 | 47.2 ± 2.7a | 3.3 ± 3.7 | 2.4 ± 3.0 | 8.0 ± 0.0 | 0 | 14 | |
| SCRƊND | 50.6 ± 3.8a | 13.0 ± 5.4a | 19.9 ± 5.3a | 11.2 ± 1.2a | 9.8 ± 0.7a | 68.7 | 16 |
| SALK_056270 (br6ox2-2) | 43.5 ± 3.2 | 8.9 ± 6.4a | 15.4 ± 5.8a | 8.2 ± 0.4 | 9.9 ± 0.9a | 31.2 | 14 |
| SALK_129352 (br6ox2-1) | 45.1 ± 2.2 | 9.7 ± 4.5a | 16.3 ± 2.0a | 8.3 ± 0.5 | 10.1 ± 0.8a | 60.0 | 15 |
| CS877191 (mgp) | 44.3 ± 3.0 | 7.9 ± 5.3a | 9.0 ± 4.a | 8.3 ± 0.5 | 8.9 ± 0.6 | 8.7 | 23 |
| SALK_110117 (nuc) | 42.6 ± 3.4 | 5.6 ± 6.9 | 7.4 ± 4.8a | 8.0 ± 0.0 | 8.6 ± 0.5 | 0 | 18 |
| SALK_044853 (rlk) | 42.9 ± 3.0 | 1.6 ± 2.6 | 2.9 ± 3.7 | 8.2 ± 0.3 | 8.5 ± 0.7 | 4.5 | 22 |
Differs significantly from the wild-type data listed in Table 1 (P < 0.01, Student’s t test).
We also examined two transfer DNA insertion mutant lines of BR6OX2. BR6OX2 encodes an enzyme that catalyzes the last reaction of brassinolide synthesis. In these two br6ox2 mutants, we found disturbed epidermal patterning and ectopic periclinal cell division in the ground tissue, similar to that in hda19 and SCRƊND (Fig. 6, D and E; Table 2). In addition, SCM expression was significantly reduced in br6ox2 and mgp (Supplemental Fig. S7, C–F). These results suggest that brassinolide may play a role in the positional signal from the ground tissue to control epidermal differentiation.
DISCUSSION
We found both altered root epidermis specification and cortex cell fate in the hda19 mutant. Based on the results of additional cortex cell divisions (Fig. 1, A and B), the disappearance of the cortex marker CO2pro:NLS-YFP signal, and altered expression level of cortex-specific gene expression in hda19 (Fig. 3, A–F), we conclude that HDA19 affects root cortex cell fate. Our results indicate that the abnormality of epidermal cell patterning is derived from abnormal cortex differentiation. In particular, no direct link was found between HDA19 and multiple epidermal pattern genes (Supplemental Figs. S2 and S3), and a ground tissue-specific promoter driving HDA19 was able to fully rescue the epidermal phenotype (Fig. 3, K–N). This supports the hypothesis that positional information originating in the cortex plays a role in determining epidermal cell fate in the Arabidopsis root.
HDA19 acts through interaction with SCR and by directly binding SCR target genes. Interaction between HDA19 and SCR is mainly localized to the CEI, suggesting the possibility of a preprogrammed cortex cell fate in its progenitor cells. It is interesting that scr-3, which carries a point mutation in SCR that causes a premature stop at codon 460 and loss of the C-terminal PS domain, did not exhibit abnormal cortex or epidermis, whereas deletion of its ND domain did (Fig. 6). This is consistent with the interaction of SCR with HDA19 through the ND domain. Therefore, this work not only provides a molecular mechanism underlying the phenotype of hda19 but also reveals a new function of SCR.
Currently, only a few genes have been shown to regulate cortex identity, including JKD and SCHIZORIZA (Welch et al., 2007; Pernas et al., 2010; ten Hove et al., 2010). This work adds two additional players, HDA19 and SCR, to the network regulating cortex differentiation. The effect of HDA19 on cortex differentiation through interaction with SCR in the CEI suggests a novel regulatory pathway, which may be parallel to that of JKD, since HDA19 had no interaction with JKD at the protein or protein-DNA level (Fig. 4A; Supplemental Figs. S2B and S4).
In addition to patterning the epidermis, HDA19 also appears to affect ground tissue patterning. Our data suggest that the additional ground tissue layer in hda19 is middle cortex, since the endodermis-specific markers were expressed in the endodermal layer but were rarely detected in this middle layer. However, since CO2pro:NLS-YFP expression was dramatically decreased in hda19 and we were unable to ascertain the status of JKDpro:JKD-CFP because it was silenced after crossing, we cannot be sure at this time. Several other factors, including SCR, SHR, the BIRDs, and miR165/6, are known to contribute to ground tissue patterning through complex transcriptional regulation, protein-protein interactions, and protein movement (Cui and Benfey, 2009b; Koizumi et al., 2012; Wu and Gallagher, 2014; Long et al., 2015; Di Ruocco et al., 2018). Thus, the precise role of HDA19 in this network is a subject of future analysis.
HDA19 is a global regulator of transcription in response to a variety of developmental processes, including seed germination, shoot apex formation, leaf expansion, flower formation, and fruit fertility, through recruitment by specific transcription factors controlling each process (Tian et al., 2003; Long et al., 2006; Liu et al., 2014; Chen et al., 2015). Phenotypes in hda19 related to each of these processes were observed under our growth conditions. For example, reduced fertility was very obvious as described previously (Tian et al., 2003). The mutant phenotype of hda19 could be rescued by complementation with HDA19pro:HDA19-EGFP/hda19 and partially rescued by SCRpro:HDA19-EGFP (Supplemental Fig. S8, H–K), since SCR is expressed in the inflorescence stem (Wysocka-Diller et al., 2000; Dhondt et al., 2010). It is interesting that SCRpro:HDA19-EGFP could restore the ground tissue pattern and partially rescue the epidermal phenotype of hda19 (Fig. 3M; Table 1). This non-cell-autonomous function of HDA19 may be through interactions of its target genes such as SCR, MGP, and other factors. We observed that 18.8% of hda19 roots (n = 266) had a disorganized root apex (Supplemental Fig. S8, B–G). This defect could be rescued by HDA19pro:HDA19-EGFP but not by any of the tissue-specific promoter-driven HDA19-EGFP lines mentioned above (0% for HDA19pro:HDA19-EGFP but 20.2% out of 99 seedlings for WERpro, 15.2% out of 66 seedlings for JKDpro, and 14.7% out of 68 seedlings for SCRpro-driven HDA19-EGFP in hda19 showed disorganized root apex), indicating that HDA19 function in cortex and epidermis patterning is distinct from its role in root apex formation.
We did not observe any abnormality either in epidermal or cortical patterning of the HDA19 overexpression line. A simple explanation is that HDA19 has to interact with SCR in regulating the cortex differentiation. Without additional SCR to cooperate, surplus HDA19 alone cannot change much regarding cortex differentiation. An alternative explanation is that other regulators, such as the histone acetyltransferase, counteract the effects of overexpressing HDA19. We even found that both down- and up-regulation of HDA18 can convert some N cells to H fate (Liu et al., 2013). A more comprehensive understanding of why overexpression of HDA19 does not cause dramatic phenotypes awaits future analysis.
Lastly, brassinosteroids (BRs) are required to maintain the cellular pattern of the Arabidopsis root epidermis (Kuppusamy et al., 2009). Our finding that mutation of the BR synthesis gene BR6OX2, an SCR and HDA19 target, results in an abnormal epidermal and cortex pattern (Fig. 6F) suggests that BR signaling originates in cortex cells and is regulated by HDA19 and SCR. In addition, HDA6 was reported to regulate BR signaling (Hao et al., 2016), further suggesting that there is a link between histone acetylation regulation and the BR pathway during pattern formation in plant development.
MATERIALS AND METHODS
Plant Material and Growth Conditions
The Arabidopsis (Arabidopsis thaliana) SALK and CS series of transfer DNA insertion lines of hda19 (SALK_139445), br6ox2-1 (SALK_129352C), br6ox2-2 (SALK_065270C), mgp (CS877191), nuc (SALK_110117C), and rlk (SALK_044853C) mutant alleles were purchased from the Arabidopsis Biological Resource Center (http://www.arabidopsis.org/). The following mutants and reporter lines were previously described: scr-3 (Di Laurenzio et al., 1996), SCRpro:GFP-SCRƊND/scr-4 line (Cui and Benfey, 2009b), Co2pro:NLS-YFP, En7pro:NLS-YFP, SCRpro:GFP-SCR, and SHRpro:SHR-GFP (Cui et al., 2007), WERpro:GFP (Lee and Schiefelbein, 1999), GL2pro:GFP (Lin and Schiefelbein, 2001), CPCpro:GUS (Wada et al., 2002), and SCMpro:GUS (Kwak et al., 2005). Reporter lines were introduced into hda19 or transgenic plants by crossing. Homozygous lines were obtained by molecular genotyping, phenotype analysis, and reporter gene expression verification. Seeds were sterilized and placed on Murashige and Skoog medium solidified with 0.8% to 1% (w/v) agar. Plants were grown in a 22°C chamber with a period of 16 h of light/8 h of dark.
Construction of Plasmids and Transgenic Plants
To overexpress HDA19, the coding sequence of HDA19 (without the stop codon) was cloned after the CaMV35S promoter and fused in frame to the Flag epitope using the pFPZP110 vector. To construct HDA19pro:HDA19-EGFP, a 2,562-bp fragment of HDA19 genomic sequence (from ATG but without the stop codon) was introduced into the pEGAD-EGFP vector fused in frame of the EGFP epitope to get the HDA19-EGFP construct. Then, a 1,452-bp upstream region of HDA19 (including the intergenic sequence, 5′ untranslated region, and the first intron) was first introduced into the pEGAD-EGFP vector to replace the CaMV35S promoter, and a 385-bp downstream fragment (including the intergenic sequence and 3′ untranslated region) was inserted at the end of the EGFP epitope. For tissue-specific expression of HDA19 constructs, a 3,990-bp upstream fragment of WER, a 2,534-bp upstream fragment of JKD, a 2,414-bp upstream fragment of SCR, and a 2,525-bp upstream fragment of SHR were introduced before the HDA19-EGFP construct, as reported (Kwak and Schiefelbein, 2008; Hassan et al., 2010). All the resultant constructs were verified by sequencing. Plasmid DNA was transformed into Agrobacterium tumefaciens strain GV3101. Plant transformation was undertaken according to an A. tumefaciens-mediated floral dip transformation protocol (Clough and Bent, 1998), and the seeds harvested were screened on the Murashige and Skoog medium with antibiotic or herbicide selection. The resistant T1 seedlings were planted in the soil for seed collection. Either T2 seedlings or homozygous T3 or T4 seedlings were used for GFP observation, phenotype analysis, and other experiments.
Microscopy
Transverse serial sections of Arabidopsis root tips were stained with Toluidine Blue to analyze epidermal cell differentiation (Xu et al., 2005). Histochemical analysis of GUS reporter lines was performed as described previously (Masucci and Schiefelbein, 1996). Photographs were taken with the microscope Olympus BX51 and the SPOT-RT3 camera.
GFP and YFP expression lines were first counterstained with 20 mg mL−1 propidium iodide (PI) for 1 to 2 min and observed with the Zeiss LSM 710 NLO & DuoScan System. GFP and PI signals were observed on separate channels, with excitation at 488 nm, detection between 493 and 542 nm for GFP and excitation at 561 nm, detection between 566 and 628 nm for PI. At least 10 roots of 8-d-old seedlings were examined for each line.
RNA Isolation and RT-qPCR
Total RNA was extracted from root tips of 5- or 8-d-old seedlings using the RNeasy Plant Mini kit (Qiagen) according to the manufacturer’s instructions. After treatment with DNase I (Promega), complementary DNA was synthesized from 2 mg of total RNA using the SuperScript III Reverse Transcriptase kit (Invitrogen). RT-qPCR was performed with the Applied Biosystems 7500 Real-Time PCR System using TaKaRa SYBR Premix Ex Taq. Relative gene expression was calculated using the ƊƊCt method (Livak and Schmittgen, 2001) using GAPDH as an internal control and calculating the difference of cycle threshold (Ct) between tested gene and I for each sample (ƊCt), and then the difference of ƊCt between tested sample and wild type (ƊƊCt). At least three batches of root tips grown on different petri dishes at the same time were harvested, and three technical replicates were performed for each gene expression detection. Means of three technical replicates were used for calculation and statistical Student’s t test (double tailed). Student’s t test P < 0.05 was regarded as a significant difference and is marked with a single asterisk, while P < 0.01 was regarded as a very significant difference and is marked with a double asterisk. Gene-specific primers used for RT-qPCR are listed in Supplemental Table S2.
ChIP Assays
ChIP assays for the detection of histone H3 and H4 acetylation levels were carried out as described previously (Saleh et al., 2008). Root tips were cut from 8-d-old seedlings and treated with formaldehyde. Extracted chromatin was sheared to an average length of 500 bp by sonication and immunoprecipitated with specific antibodies: anti-acetylated histone H3K9K14 (06-599; Millipore) and anti-acetylated histone H4K5K8K12K16 (06-866; Millipore). The enriched DNA was analyzed using qPCR.
ChIP assays for the detection of HDA19 binding were carried out mainly according to Kurdistani and Grunstein (2003) but with some modifications. Root tips of 8-d-old seedlings of Col, HDA19pro:HDA19-EGFP/hda19 complementation line, and HDA19pro:HDA19-EGFP/hda19/scr line were harvested and treated with 10 mm dimethyl adipimidate in phosphate buffer. Then after rinsing, the samples were fixed with 1% (v/v) formaldehyde for 20 min. Chromatin was then extracted and sonicated to produce an average of 500-bp DNA fragments. The commercial anti-GFP (ab290; ABcam) antibody was used to immunoprecipitate the chromatin. The enriched DNA was analyzed by qPCR. At least three batches of root tips grown on different petri dishes were harvested, and three technical replicates were performed for each assay. The statistical test was done as described for RT-qPCR. The primers used for ChIP assays are listed in Supplemental Table S2.
Yeast Two-Hybrid Assay
Yeast two-hybrid experiments were performed according to the MATCHMAKER Two-Hybrid System 2 (BD Biosciences). The full-length as well as truncated Arabidopsis HDA19 complementary DNAs were subcloned into pGBKT7 vector and in frame of the BD domain. The coding sequences of candidate genes as well as the truncated SCR domains were subcloned into pGADT7 vector and in frame of the AD domain. The bait and prey constructs were cotransformed into the yeast strain AH109. Selection for interactions and β-galactosidase activity measurement using o-Nitrophenyl-β-D-Galactopyranoside as substrate were carried out according to the manufacturer’s protocol (Clontech).
BiFC Assay
The coding sequence of YFP was fragmented into an N-terminal domain of 155 amino acids (nYFP) and a C-terminal domain of 84 amino acids (cYFP; Weinthal and Tzfira, 2009). HDA19 and SCR coding sequences were inserted into both pSPYNE-35S and pSPYCE-35S and in frame of nYFP and cYFP. After verification, the corresponding nYFP and cYFP plasmids were bombarded into onion (Allium cepa) epidermal cells with the model PDS-1000/He Biolistic Particle Delivery System according to the manufacturer’s structure (Bio-Rad). The fluorescence was observed by microscopy 24 h after bombardment.
FCS Assay
All FCS measurements were carried out in 5-d-old plants. Briefly, time-lapse images of 256 × 256 pixels were acquired as previously described by Clark et al. (2016) on a Zeiss 780 using a 40× 1.2 W objective. Data were analyzed in SimFCS software as previously described (Clark et al., 2016; Supplemental Table S3).
Accession Numbers
Sequence data from this article can be found in the Arabidopsis Genome Initiative or GenBank/EMBL data libraries under the following accession numbers: BR6OX2 (At3g30180), CPC (At2g46410), ETC1 (At1g01380), GEM (At2g22475), GL2 (At1g79840), HDA6 (At5g63110), HDA18 (At5g61070), HDA19 (At4g38130), JKD (At5g03150), MGP (At1g03840), RLK (At5g67280), SCM (At1g11130), SCR (At3g54220), SHR (At4g37650), TRY (At5g53200), TTG (At5g24520), and WER (At5g14750).
Supplemental Data
The following supplemental materials are available.
Supplemental Figure S1. HDA19 gene structure and expression.
Supplemental Figure S2. HDA19 affects histone acetylation levels of root epidermal patterning genes but does not directly bind to them.
Supplemental Figure S3. HDA19 does not interact with proteins of root epidermal patterning genes.
Supplemental Figure S4. Interaction of HDA19 with SCR and MGP and of their respective fragments.
Supplemental Figure S5. HDA19 does not interact with JKD or SHR indirectly.
Supplemental Figure S6. Expression of SCR target genes in the SCRƊND line.
Supplemental Figure S7. SCM expression in scr mutant alleles and mutants of SCR target genes.
Supplemental Figure S8. Root tips and whole-plant phenotypes in hda19 mutant.
Supplemental Table S1. Annotation of selected genes enriched in the root cortex.
Supplemental Table S2. List of primers used in the experiments.
Supplemental Table S3. Detailed data for FCS analysis.
ACKNOWLEDGMENTS
We thank John Schiefelbein for gifts of marker lines, Dr. Feng Zhao for help in discussion of experimental issues, Li-Jia Qu for kindness in providing access to instruments, and Dr. Dong-Hui Wang for help in daily lab management. We also thank Natalie Clark for assistance with the SimFCS software.
LITERATURE CITED
Author notes
This work was supported by National Natural Science Foundation of China grants to S.-N.B (30393114 and 30570901) and W.-Q.C (31370220) and also by a grant to P.N.B. from the National Institutes of Health (R01-GM043778) and by the Howard Hughes Medical Institute.
These authors contributed equally to the article.
Author for contact: [email protected].
Senior author
The author responsible for distribution of materials integral to the findings presented in this article in accordance with the policy described in the Instructions for Authors (www.plantphysiol.org) is: Shu-Nong Bai ([email protected]).
W.-Q.C. and S.-N.B. conceived the project and designed the experiments; W.-Q.C. and C.D. performed most of the experiments; D.-X.L. provided technical assistance and performed the experiments; W.-Q.C., C.D., and S.-N.B. analyzed data and wrote the article; Z.-H.X., P.N.B., and S.-N.B. supervised and complemented the writing; all authors read and approved the final article.
Articles can be viewed without a subscription.
