


Abstract
Hybrids are used extensively in agriculture due to their superior performance in seed yield and plant growth, yet the molecular mechanisms underpinning hybrid performance are not well understood. Recent evidence has suggested that a decrease in basal defense response gene expression regulated by reduced levels of salicylic acid (SA) may be important for vigor in certain hybrid combinations. Decreasing levels of SA in the Arabidopsis (Arabidopsis thaliana) accession C24 through the introduction of the SA catabolic enzyme salicylate1 hydroxylase (NahG) increases plant size, phenocopying the large-sized C24/Landsberg erecta (Ler) F1 hybrids. C24♀ × Ler♂ F1 hybrids and C24 NahG lines shared differentially expressed genes and pathways associated with plant defense and leaf senescence including decreased expression of SA biosynthetic genes and SA response genes. The expression of TL1 BINDING TRANSCRIPTION FACTOR1, a key regulator in resource allocation between growth and defense, was decreased in both the F1 hybrid and the C24 NahG lines, which may promote growth. Both C24 NahG lines and the F1 hybrids showed decreased expression of the key senescence-associated transcription factors WRKY53, NAC-CONTAINING PROTEIN29, and ORESARA1 with a delayed onset of senescence compared to C24 plants. The delay in senescence resulted in an extension of the photosynthetic period in the leaves of F1 hybrids compared to the parental lines, potentially allowing each leaf to contribute more resources toward growth.
Hybrid vigor describes the superior performance of hybrid crop plants relative to their parents in important agronomic traits such as biomass and seed yield (reviewed by Chen, 2013). Hybrids in maize (Zea mays), rice (Oryza sativa), and canola (Brassica napus) have increased seed yield and are used extensively in agriculture. Hybrid vigor is associated with alterations in gene expression profiles resulting from interactions between the two parental genomes present in the one nucleus. Changes in patterns of gene activity due to dominance, overdominance, and epistasis have been proposed to explain the hybrid vigor phenotype (reviewed by Fu et al., 2015); how this is achieved on a genomic level is not understood.
In Arabidopsis (Arabidopsis thaliana), F1 hybrids develop at a faster rate than parental lines, resulting in an increase in biomass and seed yield (Groszmann et al., 2014; Zhu et al., 2016; Wang et al., 2017). The increase in growth rate can occur at different stages of plant development and differs among hybrid lines (Groszmann et al., 2014). In C24/Col hybrid seedlings, the increased growth rate was observed at 3–4 d after sowing (DAS; Meyer et al., 2012). The differences in enhanced growth during different developmental stages highlight the importance of defining stages of development critical for the observed phenotypic vigor. The increase in hybrid biomass may result from altered patterns of expression in circadian rhythm genes affecting photosynthetic and other metabolic genes essential for growth (Ni et al., 2009; Shen et al., 2012; Groszmann et al., 2014; Miller et al., 2015; Wang et al., 2017). Some hybrids have increased expression levels of genes involved in the biosynthesis, signaling, and transport of auxin, a hormone that promotes plant growth through the regulation of cell proliferation and cell expansion (Perrot-Rechenmann, 2010; Shen et al., 2012; Wang et al., 2017). In F1 hybrids, the changes in auxin biosynthesis and signaling may result from increased levels of PHYTOCHROME INTERACTING FACTOR4 (PIF4), which regulates genes in the auxin biosynthesis and signaling pathways (Wang et al., 2017).
Some hybrid systems show a decrease in basal expression of defense response genes in the seedling, which, in the absence of pathogens, may increase resource allocation to plant growth, potentially contributing to hybrid vigor (Groszmann et al., 2015; Miller et al., 2015; Yang et al., 2017). Conversely, altering the growth-defense balance toward defense can result in hybrid weakness, where hybrids with hyperactivated defense pathways have reduced growth (Todesco et al., 2010). Hybrids with a decrease in basal defense gene expression may have an associated decrease in the level of salicylic acid (SA; Groszmann et al., 2015). Reduced levels of SA in the Arabidopsis accession C24 using the bacterial degradative enzyme salicylate1 hydroxylase (NahG), phenocopies hybrid vigor including the increased plant size, suggesting that SA-regulated pathways may have an important role in certain hybrid combinations (Groszmann et al., 2015).
We determined whether the size increases of F1 hybrids and C24 NahG lines result from changes to the expression level of genes in the same pathways. In both genotypes the decrease in SA is associated with reduced expression of basal defense response genes and a delay in senescence, both of which may promote increased growth.
RESULTS
C24 NahG Lines Show Increased Growth at Late Stages of Seedling Development
Reducing SA levels in Arabidopsis C24 by introducing the bacterial NahG gene into its genome results in an increased plant size similar to that of F1 hybrids between C24 and Landsberg erecta (Ler; Groszmann et al., 2015). From 0 to 21 DAS, three T3 C24 NahG lines were the same size as C24 (Fig. 1; Supplemental Fig. S1). After 21 DAS, all three C24 NahG lines began to outgrow C24, resulting in an 18% to 36% increase in rosette diameter and a 27% to 45% increase in fresh weight relative to C24 (Fig. 1, B and C; Supplemental Fig. S1; Supplemental Table S1). Ler has low levels of SA that are only slightly reduced in the Ler NahG line, and there is only a small increase in plant size (Fig. 1D; Supplemental Fig. S1C). Unlike C24 NahG, the F1 hybrids are larger than the parental accessions at all developmental stages, suggesting that gene expression changes not related to SA also contribute to the hybrid vigor phenotype (Supplemental Fig. S1C; Supplemental Table S1).
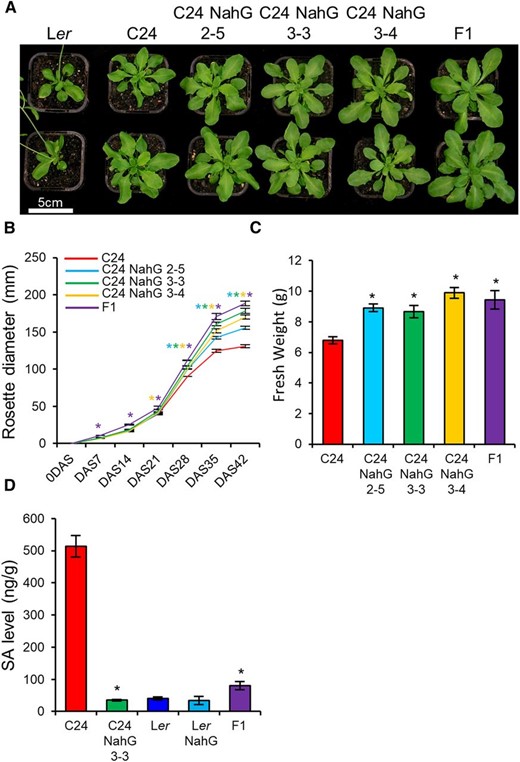
C24 NahG lines show vigor during late development. A, 28 DAS plants of C24, three T3 C24 transgenic lines (C24 NahG 2-5, C24 NahG 3-3, and C24 NahG 3-4), and C24♀ × Ler♂ F1 hybrids (F1). B, Rosette diameter of C24, C24 NahG 2-5, C24 NahG 3-3, C24 NahG 3-4, and F1 (Supplemental Table S1). Purple, blue, green, and yellow asterisks represent statistical significance versus C24 (Student’s t test P ≤ 0.01) of F1, C24 NahG 2-5, C24 NahG 3-3, and C24 NahG 3-4, respectively. C, Aerial fresh weight of 42-DAS–old plants. D, SA concentration in parental, NahG, and F1 hybrid genotypes at 21 DAS. For (C) and (D), asterisks represent statistical significance versus C24 (Student’s t test, P ≤ 0.01). Error bars = SE.
NahG Alters Gene Expression Patterns in C24 But Only Minimally in Ler
Transcriptomes of C24, C24 NahG (T2 independent lines 2 and 3), Ler, Ler NahG, and the F1 hybrid were analyzed at 21 DAS to determine which altered pathways were associated with the size increases in C24 NahG and the F1 hybrids. The NahG transgene was expressed in the NahG lines (Supplemental Fig. S1D). A quantity of 6,816 genes (35% of the expressed genes) were differentially expressed between the two parental lines (C24 and Ler) at the 21-DAS time point (Fig. 2A; Supplemental Fig. S2A; Supplemental Table S2; P ≤ 0.01; false discovery rate [FDR] ≤ 0.01; fold change ≥ ±1.2). In the F1 hybrid, 3,371 genes were differentially expressed compared to the average expression of the two parents (Mid Parent Value), with ∼60% of these down-regulated (Fig. 2A; Supplemental Fig. S2A; Supplemental Table S2). Compared to C24, C24 NahG 2- and C24 NahG 3-lines had 1,601 and 1,907 differentially expressed genes (DEGs), with many present in both lines (1,386; Fig. 2A; Supplemental Fig. S2B; Supplemental Table S2). Only genes altered in both C24 NahG lines were used for subsequent comparisons. Most of the down-regulated C24 NahG DEGs were also down-regulated in the F1 hybrid (75%; Fig. 2B). The F1 hybrid contained many more down-regulated DEGs than C24 NahG, which may reflect changes in expression of both C24 and Ler alleles in the F1 hybrid. There was only a small overlap in up-regulated DEGs between C24 NahG and the F1 hybrid, indicating that if they do share a common mechanism for increased size, it is likely due to the shared down-regulated genes (Fig. 2B).
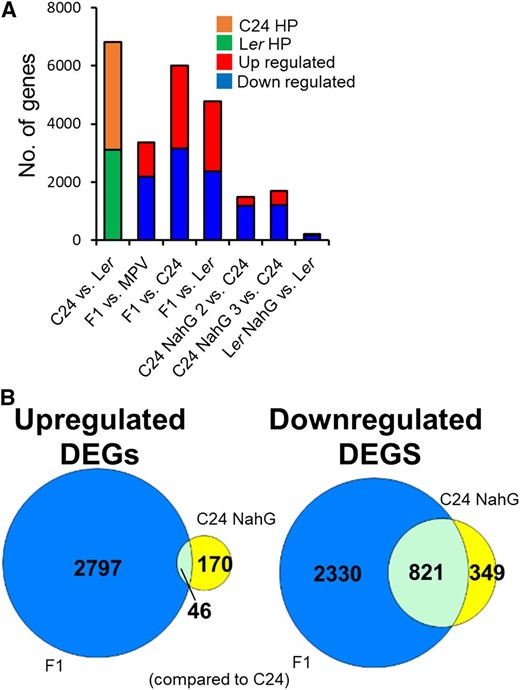
Transcriptome sequencing of parental, NahG, and F1 hybrid lines. A, DEGs (fold change ≥ ±1.2, P ≤ 0.01, FDR ≤ 0.01). B, Venn diagram of overlapping DEGs (compared to C24) between F1 hybrids and C24 NahG. Blue represents F1 hybrid DEGs, yellow represents C24 NahG DEGs, and light blue represents DEGs present in both samples.
In Ler NahG, only 225 genes were differentially expressed compared to Ler, with 87% (154) of the down-regulated DEGs overlapping with those of C24 NahG (Fig. 2A; Supplemental Fig. S2C; Supplemental Table S2). The difference in the number of DEGs between Ler NahG and C24 NahG compared to their parents is likely to be a consequence of the higher initial level of SA in C24 where there is a greater scope for down-regulation (Fig. 1D). With already low levels of SA in Ler, the addition of NahG will have little impact on SA levels and consequent gene expression changes.
Both F1 Hybrids and C24 NahG Plants Have Decreased Expression of Genes Involved in Defense Pathways
SA is produced through the isochorismate and the Phe ammonia-lyase pathways (for review, see Denancé et al., 2013). At 21 DAS, the F1 hybrids and C24 NahG show down-regulation of genes in the isochorismate pathway including ISOCHORISMATE SYNTHASE1, AVRPPHB SUSCEPTIBLE3, and ENHANCED DISEASE SUSCEPTIBILITY5 (Fig. 3A). The decrease of expression of these SA biosynthesis genes is associated with decreased expression of downstream genes such as WRKY transcription factors, PATHOGEN RELATED GENES (PR1–5), and ACCELERATED CELL DEATH6 (Fig. 3B). In Ler NahG, the NahG transgene had little influence on SA biosynthetic gene expression (Fig. 3A); however, a number of defense response pathways and SA gene targets, such as WRKYs, PR1, and ACCELERATED CELL DEATH6, were down-regulated (Fig. 3, B and C). The NahG transgene had a much greater impact on the extent of down-regulation upon activators of SA and downstream targets of SA in C24 compared to Ler (e.g. −3 versus −1 log2[fold change]; Supplemental Fig. S3A). The pattern of allelic expression of SA biosynthetic genes and downstream targets of SA demonstrates that the decreased expression of these genes in the F1 hybrid is through a reduction in expression of the C24 alleles with little change in the expression of the Ler alleles (Supplemental Fig. S3B; Supplemental Table S3). Several other defense-related pathways, including stress response, biotic stimuli, and programmed cell death, are also down-regulated (Fig. 3C; Supplemental Table S4). The down-regulation of all these pathways in the F1 hybrid and C24 NahG compared to the C24 parent suggests that changes to these pathways may contribute to the increased growth of F1 hybrids and C24 NahG.
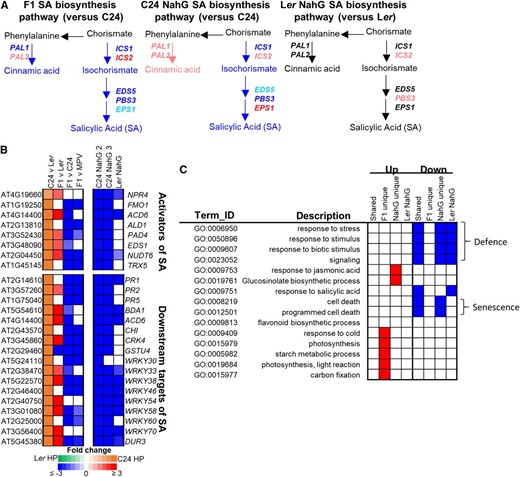
Altered expression of genes in the SA pathway. A, Expression changes in SA biosynthetic genes ISOCHORISMATE SYNTHASE (ICS1) ENHANCED DISEASE SUSCEPTIBILITY5 (EDS5), AVRPPHB SUSCEPTIBLE3 (PBS3), ENHANCED PSEUDOMONAS SUSCEPTIBILTY1 (EPS1), and PHE AMMONIA-LYASE1 (PAL1). Genes significantly up-regulated or down-regulated are in red or blue, respectively (fold change ≥ ±1.2, P ≤ 0.01, FDR ≤ 0.01). Genes trending toward up-regulation (fold change ≥ 1.2) or down-regulation (fold change ≤ 1.2) are in pink or light blue, respectively. Genes with no change in expression are in black. B, Activators and downstream targets of SA (blocks represent fold change ≥ ±1.2, P ≤ 0.01, FDR ≤ 0.01). C, Enriched GO terms altered in F1 hybrids and NahG lines. “Shared” are pathways where genes are altered in both F1 hybrid and C24 NahG. “F1 unique” are pathways enriched for genes only altered in the F1 hybrid, whereas “NahG unique” are pathways enriched for genes only altered in C24 NahG. Ler NahG are pathways altered compared to Ler. The GO enrichment analysis of the Ler NahG versus Ler is limited by the small number of DEGs. Red represents pathways enriched for genes up-regulated, blue represents pathways enriched for genes down-regulated, and white represents pathways that weren’t enriched.
Although many down-regulated genes and pathways were shared between the F1 hybrid and C24 NahG, those with up-regulated expression levels differed between the two lines (Fig. 3C). At 21 DAS, there was an enrichment in photosynthesis (Gene Ontology [GO]:0015979), starch metabolic processes (GO:0005982), chlorophyll metabolic processes (GO:0015994), light reaction (GO:0019684), and carbon fixation pathways in the F1 hybrids (GO:0015977; Fig. 3C; Supplemental Fig. S4; Supplemental Table S4). Hybrids but not NahG lines had increased expression of PIF4 and PIF5, genes that have been implicated in hybrid vigor through effects on auxin (Fig. 4A; Wang et al., 2017). This difference could result in the larger size of F1 hybrids compared to C24 NahG at early stages of development when these genes are highly expressed (Wang et al., 2017). Another difference was that, in the C24 NahG lines, there was an altered level of jasmonic acid (JA)-responsive genes and glucosinolate biosynthesis genes that was not present in the F1 hybrid nor in Ler NahG lines. Whereas JA-responsive genes showed altered expression in C24 NahG, no changes were observed in JA biosynthetic gene expression or JA hormone levels (Supplemental Fig. S5).

The log2 fold change in gene expression of PIFs and cell size genes. A, PIF are up-regulated in F1 hybrids (Waldtest *P ≤ 0.05; **P ≤ 0.01, FDR ≤ 0.01; fold change ≥ ±1.2). B, XTH4, EXP3, and EXTENSINS (EXT3) have altered expression in F1 hybrids and C24 NahG. Genes up-regulated are in red, whereas genes down-regulated are in blue.
TL1 BINDING TRANSCRIPTION FACTOR1, a Master Regulator of Defense and Growth, Is Down-Regulated in F1 Hybrids and C24 NahG
The vigor observed in both F1 hybrids and C24 NahG plants is associated with an increase in leaf cell size (Groszmann et al., 2015). Several genes that increase cell size including EXPANSINs (EXP3, EXP5, and EXP8) and XYLOGLUCAN ENDOTRANSGLUCOSYLASE/HYDROLASEs (XTH4, XTH7, and XTH17) showed increased expression in both F1 hybrids and C24 NahG (Fig. 4B; Supplemental Fig. S6). Some of these genes were also up-regulated in Ler NahG, but not to the extent observed in either C24 NahG or in F1 hybrids, again highlighting the different responses to NahG by the parental genotypes (Fig. 4; Supplemental Fig. S6). Genes important for limiting cell size were down-regulated in both the F1 hybrid and C24 NahG (e.g. EXTENSIN3; Fig. 4; Supplemental Fig. S6).
In the F1 hybrid, the decrease in SA and in expression of related defense pathway genes could release more resources to be allocated to plant growth. TL1 BINDING TRANSCRIPTION FACTOR1 (TBF1) is a transcription factor that is induced by SA, and regulates resource allocation between defense and growth (Pajerowska-Mukhtar et al., 2012). TBF1 represses genes associated with plant growth, including chloroplast proteins and enhances expression of genes involved in plant defense (Pajerowska-Mukhtar et al., 2012). In F1 hybrids, we found a >3-fold reduction in TBF1 expression relative to C24, with levels below both parents (Fig. 5A; Supplemental Fig. S7A). Like other SA-responsive genes (Supplemental Fig. S3B), the reduced expression of TBF1 is mainly through a large decrease in the expression of the C24 allele, with only a small reduction in the expression of the Ler allele (Fig. 5B; Supplemental Table S3). Downstream targets repressed by TBF1, including chloroplast-associated genes, were up-regulated while defense genes induced by TBF1 were down-regulated mainly through changes in the expression of the C24 allele (Fig. 5; Supplemental Fig. S7B; Pajerowska-Mukhtar et al., 2012). In the NahG lines, TBF1 and a number of TBF1-targeted genes were either down-regulated or up-regulated in C24 NahG but not in Ler NahG (Fig. 5A; Supplemental Fig. S7C). The regulation of TBF1 occurs at both transcriptional and translational levels (Pajerowska-Mukhtar et al., 2012). A network analysis of the genes regulated by TBF1 suggests that TBF1 protein activity is down-regulated in the F1 hybrid and C24 NahG (Supplemental Fig. S8, A and B). This did not occur in Ler NahG, where genes regulated by TBF1 showed only small changes in gene expression (Supplemental Fig. S8C).
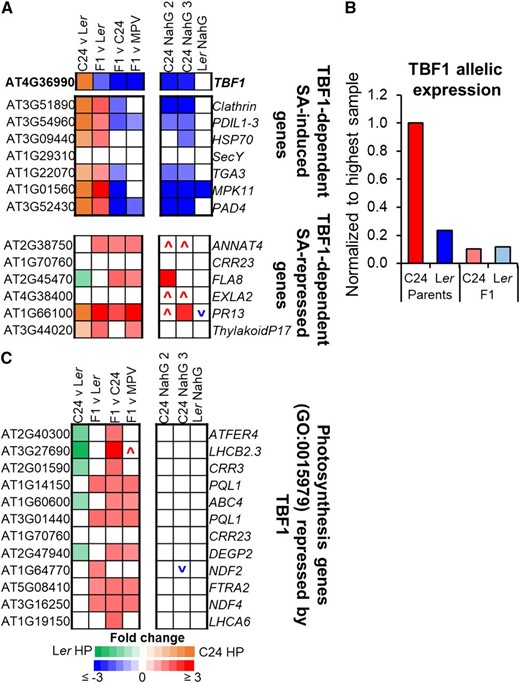
TBF1, a master-switch between defense and growth, is down-regulated in F1 hybrids. A, Altered expression of TBF1 and genes regulated by TBF1 (block represents fold change ≥ ±1.2, P ≤ 0.01, FDR ≤ 0.01); The up or down symbol represents a trend for increased expression (red) or decreased expression (blue) in NahG (fold change ≥ ±1.5; Pajerowska-Mukhtar et al., 2012). B, TBF1 allelic expression in parents and hybrids. Parent columns represent haploid read numbers for each parent. F1 columns represent expression of either the C24 allele or the Ler allele in the F1 hybrid. TBF1 allelic expression values can be found in Supplemental Table S3. C, Genes repressed by TBF1 are up-regulated in F1 hybrids (fold change ≥ ±1.2, P ≤ 0.01, FDR ≤ 0.01). A more extensive list of photosynthetic genes repressed by TBF1 can be found in Supplemental Figure S7C.
Decreased Expression of SA-Associated Genes Is Consistent with Delayed Senescence in F1 Hybrids and NahG Lines
Senescence is a tightly regulated process that allows a plant to repurpose nutrients from older leaves into the development of new leaves or to reproductive structures. Senescence can be induced by a number of external factors such as biotic and abiotic stress and internal factors such as developmental age, hormone levels, and flowering time (reviewed in Woo et al., 2013; Kim et al., 2018). In F1 hybrids and C24 NahG, genes involved in programmed cell death (GO:0012501) and cell death (GO:0008219)—both processes associated with the timing of senescence—were down-regulated (Fig. 3C). SA is a strong driver of senescence and the decrease in SA levels could alter the onset of senescence (Morris et al., 2000; Zhang et al., 2013, 2017; Zhao et al., 2016). Down-regulated genes included the senescence initiating transcription factors WRKY53, NAC-CONTAINING PROTEIN 92/ORESARA1, and NAC-CONTAINING PROTEIN29 (reviewed in Woo et al., 2013; Fig. 6A). EPITHIOSPECIFYING SENESCENCE REGULATOR, a gene known to repress WRKY53 activity, was up-regulated in the F1 hybrids, consistent with the observed decrease in WRKY53 expression (Miao and Zentagraf, 2007; Fig. 6A).
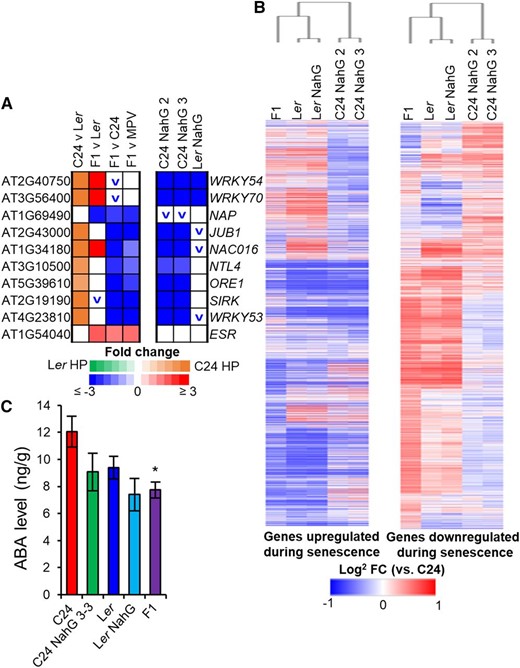
Gene expression patterns of senescence-related genes and hormones at 21 DAS. A, Transcriptome changes in transcription factors important in the initiation of senescence (blocks represent fold change ≥ ±1.2, P ≤ 0.01, FDR ≤ 0.01). The up or down symbol represents a trend for increased expression (red) or decreased expression (blue) in NahG (fold change ≥ ±1.5). B, Heat map of genes known to be up-regulated during senescence and down-regulated during senescence (Supplemental Table S5; Allu et al., 2014). Bars represent log2 fold change increase (red) or decrease (blue) in expression versus C24. C, Levels of ABA in 21-DAS plants. Black asterisk represents statistical significance versus C24 (P ≤ 0.01 Student’s t test). Error bars = se.
We analyzed the expression pattern of 3,211 genes known to be up-regulated during developmental senescence and 2,496 genes known to be down-regulated during developmental senescence (Supplemental Table S5; Allu et al., 2014). Relative to C24, C24 NahG, Ler, Ler NahG, and the F1 hybrid displayed a pattern of expression consistent with a delay in senescence (Fig. 6B). Approximately 30% of the genes down-regulated in hybrids are genes known to be up-regulated during senescence, while 40% of the F1 hybrid’s up-regulated genes are known to be down-regulated during senescence (Supplemental Fig. S9). A similar pattern was observed in C24 NahG but not Ler NahG, where there was no difference in the overlap between genes up-regulated or down-regulated during senescence (Supplemental Fig. S9C). These patterns of expression are consistent with the F1 hybrid and C24 NahG having delayed senescence. Hormone levels were also altered in a way consistent with a delay in senescence. Along with the decreased level of SA, we observed a statistically significant decrease in levels of abscisic acid (ABA) at 21 DAS, which is also known to promote senescence (Fig. 6C; reviewed in Kim et al., 2017). The combination of gene expression patterns and hormone levels suggested that both the F1 hybrid and the C24 NahG plants have delayed senescence.
Under long-day conditions, both C24 NahG and the F1 hybrid had delayed senescence of leaf 7 compared to C24 (35 DAS; Supplemental Fig. S10). Although Ler NahG also had delayed senescence compared to Ler, the delay was less. The delay in senescence was observed across the whole rosette with the F1 hybrid having fewer senescing leaves compared to either parent (Supplemental Figs. S10B and S11). Flowering is a strong inducer of senescence and could influence the senescence patterns. Flowering time (50% of plants had bolted) for Ler and Ler NahG was similar at 18 DAS. C24 had a flowering time of 31 DAS while the C24 NahG and F1 hybrids had a slight delay in flowering time of 31–34 DAS and 34 DAS, respectively. The similarity in flowering time among C24, C24 NahG, and the F1 hybrid suggests that flowering time is not responsible for the delay in senescence.
To remove any influence of flowering time on senescence, we examined senescence under short-day conditions where flowering is delayed in all genotypes (including the early flowering Ler). Fluorescent imaging was used to evaluate chlorophyll degradation and PSII efficiency as markers for the progression of senescence during a dark-induced senescence treatment (Bresson et al., 2018). Before the induction of senescence, all samples showed the same level of PSII efficiency values (Fv/Fm; Fig. 7A). As senescence begins, chlorophyll content and PSII efficiency decreases dramatically in the leaves of the parental lines (C24 and Ler), which are considered “dead” by 6–7 d after induction (dead = Fv/Fm < 0.3; Woo et al., 2008; Fig. 7A). The F1 hybrid, along with C24 NahG, retains higher levels of PSII efficiency with a delayed initiation of senescence coinciding with a delay in leaf death (Fig. 7A; Supplemental Fig. S12). The average rate of chlorosis per day (chlorophyll loss per leaf area) was 15.5 ± 0.8% (C24), 12.6 ± 0.9% (Ler), 10.7 ± 0.5% (Ler NahG), 9.5 ± 0.5% (C24 NahG), and 8.3 ± 0.3% (F1 hybrid; Fig. 7B). These values demonstrate that altering levels of SA has a stronger impact on senescence in the C24 genotype than in the Ler genotype (6% versus 1.9% difference in chlorosis rate between the NahG line and wild type). To take into account differences in leaf size between genotypes, we combined absolute chlorophyll area (whole leaf) with PSII efficiency (Fv/Fm) to obtain photosynthetic capacity of the leaf. The F1 hybrids had greater photosynthetic capacity than the other genotypes, potentially contributing more resources to growth (Fig. 7A).
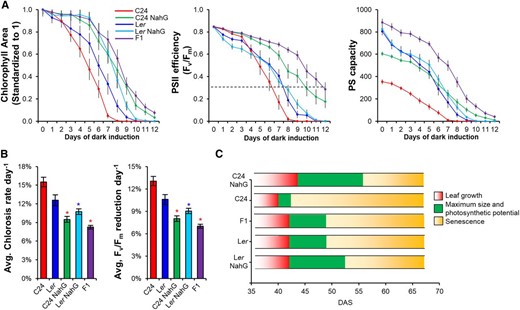
Dark-induced detached leaf senescence on leaves 13/14 from 53-DAS plants grown in short-day conditions. A, Chlorophyll area (leaf size; standardized to 1), PSII efficiency, and photosynthetic capacity (Fv/Fm × absolute chlorophyll area) over several days of dark induction. Black dotted line represents leaves that are considered dead (Fv/Fm ≤ 0.3; Woo et al., 2008). B, Average rate (per day) of chlorosis and reduction in PSII efficiency was used as a measure for the progression of senescence. Red and blue asterisks represent statistical significance (Student’s t test, P ≤ 0.01) versus C24 and Ler, respectively. C, Leaf longevity of leaves 5 and 6 under short-day conditions. Growth phases were split into growth (red), plateau in size and maximum photosynthetic potential (green), and senescence (yellow). Columns are derived from Supplemental Figure S12. Error bars = se.
We examined the impact that delayed senescence had on leaf longevity in intact rosettes under short-day conditions. We identified three stages of leaf development: “early,” when leaves are increasing in size; a “plateau” stage, where leaves have reached maximum size and have the maximum photosynthetic potential; and “senescence,” where we begin to see chlorosis (Fig. 7C; Supplemental Fig. S12). Leaves 5 and 6 attained their maximum size in all genotypes between 40 and 44 DAS (within 5% of maximum size). C24 stopped leaf growth at 40 d whereas Ler, Ler NahG, and the F1 hybrid increased in size for two more days (42 DAS). C24 NahG showed the largest extension time for growth reaching maximum size by 44 DAS. C24 retained maximum photosynthetic potential for 2–3 d before initiating senescence (Fig. 7C; Supplemental Fig. S12). The F1 hybrid and Ler both plateaued for 7 d, but once senescence began, the rate of chlorosis was slower in the F1 hybrid (Fig. 7C; Supplemental Fig. S12B). The addition of NahG to C24 resulted in the extension of maximum photosynthetic potential by 14 DAS, while in Ler, maximum photosynthetic potential was only extended by 4 DAS (Fig. 7C). The extended period of maximum photosynthetic potential could produce more resources for growth in F1 hybrids and NahG lines.
We investigated whether a delay in senescence occurs in Col♀ × Ler♂, a combination where both parents and hybrids have similar low levels of SA (Groszmann et al., 2015). At 21 DAS, Col♀ × Ler♂ hybrids show no change in senescence compared to their parents in dark treatment (Supplemental Fig. S13A) and WRKY53, EPITHIOSPECIFYING SENESCENCE REGULATOR, ORESARA1, and SENESCENCE-ASSOCIATED GENE12 (SAG21) did not show any of the changes in expression observed in the C24/Ler F1 hybrid (Supplemental Fig. S13B).
DISCUSSION
Arabidopsis C24/Ler F1 hybrids and C24 NahG both have increased size compared to the C24 genotype. We asked whether the size increase of both F1 hybrids and C24 NahG resulted from similar changes in gene expression. The two lines had similar changes to a number of developmental processes that could influence growth; however, they also showed changes unique to each genotype.
Both F1 hybrids and C24 NahG had reduced SA concentrations and low expression of basal defense response genes. A reduction in expression of defense response genes at 21 DAS may allocate more resources to growth than to defense (Brown, 2002; Tian et al., 2003; Brown and Rant, 2013; Denancé et al., 2013; Huot et al., 2014). Certain hybrids of Arabidopsis have reduced size because of a hyper-activated defense response (Alcázar et al., 2009; Chae et al., 2014; Todesco et al., 2014; Świadek et al., 2017) and hybrids that have biomass vigor have decreased defense gene expression, presumably allowing more resources to be allocated for growth (Groszmann et al., 2015; Miller et al., 2015). The F1 hybrid and C24 NahG had a decreased expression of TBF1, a transcription factor that is a master-switch allocating resources between growth and defense processes (Pajerowska-Mukhtar et al., 2012; Xu et al., 2017). The decreased expression of TBF1 correlated with increased expression of growth promoting genes and decreased expression of defense pathway genes suggesting that both F1 hybrids and C24 NahG, through a SA-driven change in TBF1, may have altered resource allocation toward plant growth.
The decrease in basal defense response genes may impact the F1 hybrid’s ability to respond to biotic and abiotic conditions. However this does not seem to be the case in C24-derived hybrids that respond normally to either biotic or abiotic stress conditions, suggesting that the SA-related changes are reversible (Rohde et al., 2004; Groszmann et al., 2015; Yang et al., 2015). The similarity between F1 hybrids and C24 NahG did not extend to Ler NahG. Ler NahG lines did have decreased expression of a number of SA-related defense response genes, but the reduction in expression compared to Ler was much smaller than that observed for the C24 NahG system. Ler NahG also lacked changes in expression of SA biosynthetic genes and TBF1, suggesting that unlike C24 NahG, Ler NahG does not have any change in its resource allocation. These differences may reflect why C24 NahG shows F1-like vigor whereas Ler NahG shows only a slight increase in biomass compared to Ler.
A difference between the F1 hybrids and the C24 NahG lines was the developmental timing at which vigor was observed. F1 hybrids displayed increased vigor at all time points, while C24 NahG only displayed vigor in later stages of development. Recent publications suggest that the early vigor of F1 hybrids may be due to increased auxin (Perrot-Rechenmann, 2010; Shen et al., 2012; Groszmann et al., 2015; Wang et al., 2017). F1 hybrids show increased expression levels of PIF4 at 3 DAS, which may up-regulate auxin biosynthetic (YUCCA8) and signaling genes (indole-3-acetic acid inducible 29), resulting in increased auxin and growth (Wang et al., 2017). Therefore, auxin may contribute to the phenotypic increase in biomass observed at earlier time points in F1 hybrids (3–14 DAS), whereas SA may contribute to the phenotype at later time points (>21 DAS) in both F1 hybrids and C24 NahG.
Many of the transcription factors that regulate senescence were down-regulated in both C24 NahG and F1 hybrids, including WRKY53, ORESARA1, NAC016, and NTL4, as were many downstream senescence-associated genes (reviewed in Woo et al., 2013). Alterations in the expression of these genes was supported by decreases in hormones known to promote senescence including SA and ABA (reviewed in Jibran et al., 2013). Recently Song et al. (2018) demonstrated a decrease in ethylene in Arabidopsis C24/Col hybrids, which can promote senescence (reviewed by Jibran et al., 2013; Song et al., 2018). These data strongly support the phenotypic observations of delayed senescence in F1 hybrids. The delay in senescence was not linked to flowering time changes as both the F1 hybrid and the C24 parent flowered at similar times. The change in senescence could be linked to the lower level of SA and its impact on senescence-associated transcription factors (Miao et al., 2004; Miao and Zentgraf, 2007). Many of the defense genes down-regulated in the F1 hybrid and C24 NahG are also implicated in developmental senescence including SENESCENCE-ASSOCIATED GENE12 (SAG12), SAG13, and NITRILASE2 (Quirino et al., 1999).
The increased longevity of the leaves in F1 hybrids resulted in an extension in the period of photosynthesis. This change in photosynthesis along with the observed change in gene expression related to resource allocation may explain the increased size of F1 hybrids and C24 NahG. Ler NahG also showed a delay in senescence; however, the difference between Ler and Ler NahG in senescence was much smaller than that for C24 and C24 NahG. This difference along with the absence of expression changes in TBF1 and associated genes may explain why Ler and Ler NahG are of similar size.
In Col NahG lines, decreased SA levels and delayed senescence correlates with an increase in biomass and seed yield (Abreu and Munné-Bosch, 2009). The association between delayed senescence and seed yield also occurs in other plant species. A number of crops have stay-green mutants in which the plants retain chlorophyll and photosynthetic activity in late stages of reproductive development (Hörtensteiner, 2009). One of the highest yielding maize varieties, FS854, is a stay-green mutant (Thomas and Howarth, 2000). In rice the high yield of the stay-green mutant SNU-SG-1 is correlated with a delay in senescence during late development (Yoo et al., 2007). Stay-green mutants in durum wheat (Triticum durum) also showed a delay in senescence and an extension of photosynthesis in flag leaves along with an increase in seed weight and grain yield (Spano et al., 2003).
In a Chinese hybrid wheat variety, the high yield of the hybrid was related to higher levels of CO2 assimilation and PSII activity compared to the parents in late stages of leaf development (Yang et al., 2007). In super high-yield hybrid rice, a delay in senescence correlates with higher levels of photosynthetic activity during mid to late development and increased seed yield compared to parents (Zhang et al., 2007; Chang et al., 2016). Ear leaves of some maize hybrids show a delay in senescence compared to the parents with an increase in photosynthetic functions during mid to late stages of growth, which correlates with increased leaf size and yield (Song et al., 2016).
CONCLUSION
In the hybrid nucleus, interactions between the two parental genomes and epigenomes alter the expression of some genes, contributing to hybrid vigor. A reduction in the level of SA in transgenic C24 NahG leads to increased growth and decreased expression levels of basal defense response genes. Parallel changes occur in C24/Ler hybrids, which have decreased levels of SA. In both systems, the decrease in SA and associated changes in defense response gene expression may affect resource allocation through the action of TBF1, which facilitates resource distribution between growth and defense. The decrease in SA is correlated with a delay in senescence that extends the period of photosynthesis per leaf increasing energy resources available for continued growth. The change in resource allocation and the delayed onset of senescence may be important contributors to the development of heterosis.
MATERIALS AND METHODS
Plant Material
Wild type Arabidopsis (Arabidopsis thaliana) C24 and Ler, two independent T2 C24 NahG lines (C24 NahG 2 and C24 NahG 3), a T2 Ler NahG line, and C24♀ × Ler♂ F1 hybrids were used for transcriptome sequencing. For senescence and hormone experiments, three T3 C24 NahG lines—C24 NahG 2-5 (derived from C24 NahG 2), C24 NahG 3-3, and C24 NahG 3-4 (derived from C24 NahG 3)—were used to compare to parents and F1 hybrids. Hybrid seed was generated through hand pollination. Seeds were sterilized and stratified at 4°C for 3 d and then grown on Gamborg’s B-5 Basal Media (G5893-10L; Sigma-Aldrich), pH 5.7 (KOH), 0.6% w/t agar. Hybrids were always grown with parental lines on the same plate. Transgenic NahG lines were always grown with wild type parents on the same plate. At 14 DAS, plants were transferred into Debco seed raising mix supplemented with 1-g/L Osmocote extract mini controlled release fertilizer. Positioning of genotypes was randomized across trays. For long-day conditions, plants were grown under 16 h-light/8-h dark at 21°C. For short-day experiments, plants were grown under 8-h light/16-h dark at 21°C. Light intensity for all experiments was between 120 and 180 μmol·m-2.s−1.
RNA Isolation and Transcriptome Sequencing
21-DAS plants were snap-frozen in liquid N. Frozen material was ground in a mortar and pestle and RNA was extracted using the Qiagen Plant RNeasy mini kit (74904; Qiagen). Total RNA was sent to the Australian Genomics Resource Facility. Transcriptome libraries were made by the Australian Genomic Resource Facility via the manufacturer’s instructions and sequenced on an Illumina Hiseq-2500 using 100-basepair pair-ended sequencing. The transcriptome data were done in two separate experiments. Three biological replicates were sequenced for C24—Ler, T2 Ler NahG, and C24♀ × Ler♂ hybrids—with each biological replicate being a pool of 6–10 plants. Two biological replicates were sequenced for T2 C24 NahG 2, C24 NahG 3, and a second set of parental C24, each being a pool of 6–10 plants.
Data Analysis
Statistically significant differences in plant growth, hormone levels, leaf growth (chlorophyll area), rates of chlorosis, and the reduction in PSII efficiency were tested using Student’s t test. Plant growth was defined by measuring the rosette diameter every 7 d for 42 d. After 42 d, aerial tissue was collected and weighed. Rosette diameter was measured on RGB photos using the software ImageJ (National Institutes of Health).
The mRNA fastq files were first run through FASTQC to check quality. Libraries were mapped with STAR version 2.5.3 using the TAIR10 genome and the araport11 annotation. Default settings were used apart from –alignTranscriptsPerReadNmax 500000 and –quantMode TranscriptomeSAM GeneCounts. The R package DESEQ2 was used to standardize reads between samples and to determine DEGs using a Wald test. Statistical significance was defined as ±1.2 fold change, P value ≤ 0.01, and a Benjamini-Hochberg P-adjusted value ≤ 0.01 (FDR). Genes were only considered expressed and analyzed if one genotype had an average normalized read fragment count ≥ 30. Statistical tests presented in all heatmaps and log2 fold-change gene expression graphs refer to the above statistical tests.
Functional categorization of DEGs was carried out as described in Groszmann et al. (2015). Briefly, DEG underwent an enrichment analysis using agriGO (bioinfo.cau.edu.cn/agriGO/). The full expressed gene list was used as the background. REViGO was then used to account for redundancies with settings described in Groszmann et al. (2015). For the heat maps in this paper, gene expression changes >3 were maximized to 3.
Chloroplast-associated genes repressed by SA through a TBF1-dependent manner were obtained from Supplemental Table S1 of Pajerowska-Mukhtar et al. (2012). The gene list was run through agriGO using TAIR9 as a background reference.
Single Nucleotide Polymorphism Analysis
Single nucleotide polymorphism (SNP) analysis was carried out as described in Zhu et al. (2016). The number of read counts for each allele was defined by SAMtools mpileup (SAMtools 1.3.1). Replicates were combined for this analysis. Only positions of known SNPs between C24 and Col or between Ler and Col were reported using the –l option. SNPs were obtained from the 1001 Genome Project (www.1001genomes.org). If the same SNP was present in both C24 and Ler, it was excluded from the analysis. The BEDtools “intersect” function was used to place SNPs within genes followed by the BEDtools “groupby” function to combine reads numbers of all SNPs within a gene. The resulting read numbers were normalized to the highest sample. Only genes with at least three SNPs present were used for the analysis. Allele ratios were then compared between the parents and the F1 hybrid.
Senescence-Associated Gene Analysis
Senescence-associated genes were obtained from Allu et al. (2014). Only genes where one sample had at least 30 read fragments were used (Supplemental Table S5). Log2 fold change compared to C24 was produced for the samples. Hierarchal clustering of the samples was then done using Morpheus (https://software.broadinstitute.org/morpheus/). Venn diagrams were produced using Venn diagram plotter (https://omics.pnl.gov/software/venn-diagram-plotter).
TBF1 Protein Activity
The regulatory networks were reverse-engineered by ARACNe from multiple RNA-seq data sets in seedling Arabidopsis. ARACNe was run with 100 bootstrap iterations using all probe clusters (Margolin et al., 2006; Groszmann et al., 2015; Wang et al., 2015, 2017). Parameters were set to 0.2 data processing inequality tolerance. Function aracne2regulon was used to generate regulon objects from networks reverse-engineered with the ARACNe algorithm. This step took two arguments as input: the ARACNe output file, and the expression data-set used by ARACNe to reverse engineer the network. Gene expression signatures (GES) were identified by filtering for DEGs using the function “rowTtest,” which is included in the Viper package that efficiently performs Student’s t test for each row of a dataset. The “rowTtest” function took an “ExpressionSet” object as argument and produces a list object containing the Student’s t test’s P value that by default is estimated by a two-tail test. The msVIPER analysis is performed by the “msVIPER” function (Alvarez et al., 2016). It requires a GES, regulon object, and null model as arguments, and produces an object of class “msVIPER,” containing the GES, regulon, and estimated enrichment, including the Normalized Enrichment Score and P value, as output.
Reverse-Transcription Quantitative PCR
For reverse-transcription quantitative PCR, aerial tissue of 21 DAS were snap-frozen in liquid N and ground in a mortar and pestle. Total RNA was extracted using the Spectrum Plant Total RNA Kit (STRN250; Sigma-Aldrich). Genomic DNA was digested from 2 μg of total RNA using DNase I following the manufacturer’s instructions (18068015; Invitrogen). cDNA was then synthesized from the RNA using Superscript III reverse transcriptase following the manufacturer’s instructions (18080044; Invitrogen). Then, 20 μL of cDNA was diluted with 380 μL of water with 5 μL used per reaction. Quantitative PCR was performed using SYBR green and Platinum Taq Polymerase (10966026; Invitrogen). For quantitative PCR, 2–4 technical replicates were used with at least three biological replicates. Reactions were carried out on a thermocycler (Corbett) using the following conditions: 45 cycles at 94°C for 10 min; 95°C for 20 s; 58°C for 20 s; and 72°C for 20 s. Gene transcripts were normalized to the control gene At4g24610. Primer sequences can be found in Supplemental Table S6.
Detached Leaf Senescence
Leaves were collected at either 5 weeks (35–38 DAS) or after 7 weeks (51–53 DAS) from plants grown under short-day conditions. For 5-week-old plants, all the leaves from a rosette were detached and placed in a 350- × 250-mm square petri dish containing two pieces of Whatman paper. Thirty-five milliliters of sterilized water were added to each petri dish. Detached leaves were placed in the petri dish and wrapped in foil and kept at room temperature for several days. Photos and trayscan images were taken each day at the same time until 12 d of dark treatment. For 7-week-old plants, leaves 13 and 14 were collected and placed in dishes as described above.
Developmental Senescence
Plants were grown on Gamborgs media plates (see above) until 14 DAS when plants were transferred to soil. Under long-day conditions, leaf 7 was collected from several plants at three time points: 28 DAS, 35 DAS, and 42 DAS. For senescence on the whole plant rosette, the number of partial and fully senesced leaves was counted once a week up until 49 DAS. Assigned classifications of “partial senescence” were considered when yellowing was present over 20% to 50% of the leaf; “full senescence” was deemed when the whole leaf was yellow. For analyzing the differences in senescence and leaf longevity of leaf 5/6 of intact rosettes, plants were propagated as above. Once in soil, plastic tags were positioned under leaves 5/6 to avoid premature senescence triggers due to contact with the soil. To avoid shading-induced senescence triggers from overlapping leaves and to expose leaves 5/6 for over-head imaging, later developing leaves were kept aside using wooden toothpicks.
Fluorescence Imaging
Chlorophyll distribution and Fv/Fm ratio, reflecting the maximal quantum yield of PSII photochemistry, were measured using the PlantScreen system (Photon System Instruments; www.psi.cz). Measured basal fluorescence (F 0) and maximum fluorescence (Fm) and calculated Fv/Fm ([Fm-F 0]/Fm) values from images were derived using a FluorCam 7 (version 1.5.0.46; Photon System Instruments). Images of leaves from intact rosettes were taken 1 h predawn to ensure leaves were fully dark-adapted. Leaf growth was defined as the chlorophyll area produced using the FluorCam 7 (Photon System Instruments). Healthy presenescing leaves had Fv/Fm ≥ 0.83, indicating settings for the light pulses were correctly calibrated. All leaves were imaged from their adaxial side. False-color images of Fm and Fv/Fm allowed the visualization of the spatio-temporal progression of senescence in the leaves by observing the reduction in fluorescent area. A 24-color card (www.cameratrax.com) was present in each imaging batch and used to color-standardize all RGB images using an in-house script.
Hormone Analysis
Twenty-one DAS plants grown under long-day conditions were collected and frozen in liquid N. Seven replicates were prepared for C24: C24 NahG 3-3, Ler, Ler NahG, and C24♀ × Ler♂. Each replicate contained two plants. Material was ground in liquid N and 100 mg of the ground tissue was used for the subsequent analysis. Hormone samples were extracted as described in Xu et al. (2016). Hormone samples and standards (5 μL) were injected onto a Zorbax Eclipse 1.8 μm XDB-C18 2.1 × 50-mm column (Agilent). Solvent A consisted of 0.1% aqueous formic acid (v/v), and solvent B consisted of methanol with 0.1% formic acid (v/v). The plant hormones were eluted with a linear gradient from 10% to 50% solvent B over 8 min and 50% to 70% solvent B from 8 min to 12 min (then held at 70% from 12 min to 20 min) at a flow rate of 200 μL/min. Solvents were liquid chromatography–mass spectrometry grade from Fisher Chemical. The eluted hormones from the column were introduced to the mass spectrometer via a heated electrospray ionization-II probe and analyzed using Q-Exactive Plus (HESI-II; Thermo Fisher Scientific). The heated electrospray ionization negative ion polarity parameters were as follows: The electrospray voltage was 2.5 kV, and the ion transfer tube temperature was 250°C. The vaporizing temperature and the S-lens radio frequency level were 300°C and 50 V, respectively. The sheath gas flow was 45 L min−1 of N, 10 L min−1 of auxiliary gas, and 2 L min−1 of sweep gas, respectively. Targeted parallel reaction monitoring was acquired in the quadrupole-Orbitrap mass spectrometer over the mass range m/z 100–1,500 with a mass resolution of 17,500 at 1.0 microscan. Supplemental Table S7 shows the tandem mass spectrometry acquisition parameters. The Automatic Gain Control target value was set at 1.0E+05 counts, maximum accumulation time was 50 ms, and the isolation window was set at m/z 4.0. Data were acquired and analyzed using the software Xcalibur (4.0; Thermo Fisher Scientific).
Accession Numbers
Sequencing data has been deposited in the Gene Expression Omnibus database (accession no. GSE113989).
Supplemental Data
The following supplemental materials are available.
Supplemental Figure S1. Growth rates of NahG lines.
Supplemental Figure S2. DEGs.
Supplemental Figure S3. Changes in SA-related genes.
Supplemental Figure S4. Increased expression of photosynthetic genes at 21 DAS.
Supplemental Figure S5. Pathways unique to C24 NahG.
Supplemental Figure S6. Cell EXP gene expression in F1 hybrids and NahG lines based on Log2 fold change.
Supplemental Figure S7. TBF1 targeted chloroplast genes are up-regulated in F1 hybrids.
Supplemental Figure S8. TBF1 activity is down in F1 hybrids and C24 NahG, but not in Ler NahG.
Supplemental Figure S9. Overlap between senescence-associated genes with DEGs in F1 hybrids.
Supplemental Figure S10. Senescence patterns under long-day conditions (16-h light/8-h dark).
Supplemental Figure S11. Dark-induced senescence patterns in C24/Ler hybrids under short-day conditions.
Supplemental Figure S12. Leaf longevity under short-day conditions.
Supplemental Figure S13. Senescence is unchanged in Col♀ × Ler♂ F1 hybrids.
Supplemental Table S1. Rosette diameter of plants over development.
Supplemental Table S2. Complete list of DEGs.
Supplemental Table S3. Table of allelic expression of SA-related genes and TBF1-related genes.
Supplemental Table S4. GO annotations for DEGs.
Supplemental Table S5. Genes that respond to senescence.
Supplemental Table S6. Primer sequences used for real-time PCR.
Supplemental Table S7. Mass spectroscopy acquisition parameters.
ACKNOWLEDGMENTS
We thank Ming-Bo Wang and Chris Helliwell for commenting on the manuscript. We thank Thy Truong from the RSB/RSC Mass Spectrometry Facility for help with the liquid chromatography–mass spectrometry. We thank Li Wang for helping supply seed.
LITERATURE CITED
Author notes
This work was supported by the ARC Centre of Excellence for Translational Photosynthesis (grant no. CE1401000015 to M.G.); the National Collaborative Research Infrastructure Strategy of the Australian Government (providing The Australian National University growth facilities and PlantScreen services of the Australian Plant Phenomics Facility); and Longjiang Fan and Zhejiang University (to Y.S.).
Author for contact: [email protected].
Senior author.
The author responsible for distribution of materials integral to the findings presented in this article in accordance with the policy described in the Instructions for Authors (www.plantphysiol.org) is: Ian K. Greaves ([email protected]).
R.G.-B., M.G., E.S.D., W.J.P., and I.K.G. conceived the original research plans; Y.S., R.G.-B., M.G., A.Z., A.W., A.D.A., and I.K.G. performed most of the experiments; A.W. provided technical assistance to I.K.G.; Y.S., R.G.-B., M.G., and I.K.G. designed the experiments and analyzed the data; I.K.G., E.S.D., and W.J.P. wrote the manuscript.
Articles can be viewed without a subscription.
