


Abstract
Interactions between the dinoflagellate endosymbiont Symbiodinium and its cnidarian hosts (e.g. corals, sea anemones) are the foundation of coral-reef ecosystems. Carbon flow between the partners is a hallmark of this mutualism, but the mechanisms governing this flow and its impact on symbiosis remain poorly understood. We showed previously that although Symbiodinium strain SSB01 can grow photoautotrophically, it can grow mixotrophically or heterotrophically when supplied with Glc, a metabolite normally transferred from the alga to its host. Here we show that Glc supplementation of SSB01 cultures causes a loss of pigmentation and photosynthetic activity, disorganization of thylakoid membranes, accumulation of lipid bodies, and alterations of cell-surface morphology. We used global transcriptome analyses to determine if these physiological changes were correlated with changes in gene expression. Glc-supplemented cells exhibited a marked reduction in levels of plastid transcripts encoding photosynthetic proteins, although most nuclear-encoded transcripts (including those for proteins involved in lipid synthesis and formation of the extracellular matrix) exhibited little change in their abundances. However, the altered carbon metabolism in Glc-supplemented cells was correlated with modest alterations (approximately 2x) in the levels of some nuclear-encoded transcripts for sugar transporters. Finally, Glc-bleached SSB01 cells appeared unable to efficiently populate anemone larvae. Together, these results suggest links between energy metabolism and cellular physiology, morphology, and symbiotic interactions. However, the results also show that in contrast to many other organisms, Symbiodinium can undergo dramatic physiological changes that are not reflected by major changes in the abundances of nuclear-encoded transcripts and thus presumably reflect posttranscriptional regulatory processes.
Dinoflagellates are unicellular algae that can have photosynthetic or nonphotosynthetic lifestyles. They comprise a large group of marine and fresh-water eukaryotes related to parasitic protists such as Plasmodium and Toxoplasma, and they exhibit several features not observed in many currently used model organisms, including: (1) DNA packaged in permanently condensed chromosomes (Dodge, 1965; Lin, 2011; Wisecaver and Hackett, 2011) with only low levels of histones (Roy and Morse, 2012); (2) a complex, multilayered outer covering that can be reticulate and is composed of extracellular proteins, lipids, and polysaccharides (Parrish et al., 1993; Mandal et al., 2011); (3) chloroplasts delineated by three “envelop” membranes and harboring thylakoid (photosynthetic) membranes with chlorophylls (Chl) a and c2 plus the xanthophylls peridinin, dinoxanthin, and diadinoxanthin, which give dinoflagellates their typical golden-brown color and that function in both light harvesting and energy dissipation (Persson et al., 2016). The plastids also contain a highly reduced genome that encodes 12 to 17 proteins, with the plastid genes on small minicircle chromosomes of 2 to 3 kb (Zhang et al., 1999; Howe et al., 2008).
Dinoflagellates in the genus Symbiodinium can enter endosymbiotic associations with corals, providing the metabolic basis for the highly productive and biologically diverse coral-reef ecosystems (Hoegh-Guldberg, 1999), as well as with other cnidarians, including sea anemones and jellyfish, and noncnidarian hosts (Trench, 1993; Lobban et al., 2002; Mordret et al., 2016). Cnidarian hosts often appear to be populated by just one or a very small number of Symbiodinium strains, with some symbiont-host associations appearing to be highly specific while others are more flexible and can change over developmental time and space (LaJeunesse, 2002; Goulet and Coffroth, 2003; Andras et al., 2011; Pettay et al., 2011). There may also be free-living Symbiodinium strains (Manning and Gates, 2008; Hansen and Daugbjerg, 2009; Pochon et al., 2010).
In symbioses with cnidarians, the algae are restricted to gastrodermal tissue (inner cell layer of the gut and tentacles), where they reside within specialized vacuoles called symbiosomes (Wakefield et al., 2000). The Symbiodinium-cnidarian association is highly susceptible to environmental perturbations such as high temperature (Hoegh-Guldberg and Smith, 1989), and such perturbations of coral ecosystems can result in the loss of the algae from the coral tissue (“coral bleaching”) and ultimately lead to the death of the host and destruction of the reef (Hoegh-Guldberg, 1999; Weis and Allemand, 2009). This phenomenon is plaguing reef communities worldwide (McCauley et al., 2015). Despite the enormous ecological and economic importance of coral reefs, there is still little known about the cellular and molecular mechanisms of coral bleaching and the various interactions between the algae and their hosts, including the entrance of algae into gastrodermal cells, algal maintenance and proliferation, and interorganism metabolite trafficking (Weis et al., 2008; Davy et al., 2012).
Metabolite exchange is essential to the success of coral-dinoflagellate and other symbiotic associations (Udvardi and Poole, 2013). The algal symbionts are photosynthetically competent, and much of the CO2 that they fix can be accessed by the host (Muscatine, 1990; Venn et al., 2008) via translocation of photosynthetic products (e.g. sugars, amino acids, lipids, carbohydrates, and small peptides) from the algae to the host (Muscatine, 1967; Trench, 1979; Burriesci et al., 2012). Furthermore, under some conditions, “reverse-translocation” of metabolites from the host to the alga can occur (Steen, 1986). For example, the host can maintain algal symbionts even if they impose a metabolic burden, such as when the holobiont is artificially maintained in the dark for an extended period (Schoenberg and Trench, 1980; Steen, 1986), or in deep sea corals, which experience extreme light limitation ( Yokoyama and Esat, 2016 ; http://ocean.si.edu/deep-sea-corals); in these situations, fixed carbon from the host presumably helps to sustain the algae. These observations suggest a flexibility in the source of fixed carbon used by the algae within the host and the ability of at least some algal types to grow photoautotrophically (light, no exogenous fixed carbon), mixotrophically (light, with exogenous fixed carbon), or heterotrophically (dark, with exogenous fixed carbon). Such metabolic flexibility may also be important to allow the algae to survive during periods when not in a host, which is ecologically critical because symbiont transfer from one host generation to the next is typically horizontal rather than vertical. However, little is known about how widespread such flexibility is among Symbiodinium strains, the mechanisms associated with trophic switching, how metabolites are exchanged between the partner organisms, and how this exchange impacts the algae at the levels of both metabolic activities/pathways and gene expression.
We reported previously that the clade B Symbiodinium strain SSB01 can utilize exogenous Glc for growth either in the light or in the dark; our preliminary evidence also suggested that such growth might lead to a partial loss of the cells’ photosynthetic capabilities (Xiang et al., 2013). In this study, we investigated the effects of exogenous Glc on strain SSB01 cells in more detail. Cells were grown photoautotrophically, mixotrophically, or heterotrophically, and their morphology, physiology, and transcriptome properties were evaluated. We also initiated studies on how changes in the algal trophic state can impact its ability to infect and populate a cnidarian host.
RESULTS
Reversible Loss of Pigments and Photosynthetic Activities during Growth in the Presence of Glc
We reported previously that axenic cultures of SSB01 grew well in the presence of 5 g/L exogenous Glc both in the light and dark but exhibited reduced levels of pigmentation under these conditions (Xiang et al., 2013). To investigate this behavior in more detail, we grew cells for up to 30 d in continuous light in the minimal (salts + vitamins) medium IMK (see “Materials and Methods”) or in IMK + Glc (IMK+Glc) culture medium. The loss of pigmentation in cells grown in Glc-containing medium was apparent from visual inspection (Fig. 1A), absorption spectra of methanol-extracted pigments (Fig. 1B), and reduced levels of Chl a, which were clearly observed by 10 d of growth (Fig. 1C). The large initial increase in Chl a that occurred in the cultures transferred to IMK medium without Glc (Fig. 1C) presumably reflected the shift from the IMK + casein hydrolysate medium used to maintain the algal stock cultures to IMK without supplementation, which probably requires an initial period of acclimation to photoautotrophic growth without fixed carbon (the casein hydrolysate) in the medium. In parallel with their loss of pigmentation, Glc-grown cells showed a marked decrease in both the maximum quantum efficiency (F v/F m) of PSII (Fig. 1D) and the total activity of PSI, as judged by the level of photo-oxidizable P700 (Fig. 1E). The F v/F m decreased to <0.1 by 10 d after the shift to IMK+Glc medium and then remained at that low level. The level of oxidizable PSI declined strongly during the first 20 d after the shift to IMK+Glc medium and remained at 10% to 20% of the initial value (and of the value measured in cultures that were transferred to IMK medium) for the next 10 d. Bleaching was also observed during growth of SSB01 in IMK+Glc medium in the dark, although the loss of pigmentation was slower than in the light (Xiang et al., 2013). The effects of growth in Glc-supplemented medium were reversible; there was a gradual recovery of pigment levels (Fig. 2, A and B), PSII activity (Fig. 2C), and PSI activity (Fig. 2D) after the bleached cells were returned to IMK medium without Glc.
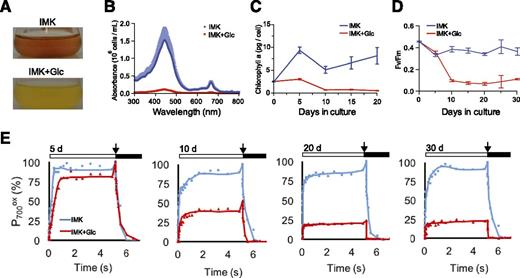
Loss of photosynthetic pigments and of PSII and PSI activities during growth of SSB01 in the presence of Glc. Cells were grown for up to 30 d in IMK or IMK+Glc medium in continuous light, and assays were performed as described in “Materials and Methods.” Photographs of cultures (A) and absorbance spectra of methanol extracts (B) were obtained after 30 d of growth. C, Chl a concentrations of methanol extracts. D, F v/F m of PSII. E, PSI activities (as percentages of the amount of oxidizable P700 in IMK-grown cells). The thickness of the tracing (B) and the error bars (C and D) show the SDs from three biological replicates. In E, each shows one of two biological replicates (after the indicated numbers of days in culture) that gave essentially identical results. White bars, times of exposure to actinic light (156 µmol photons m−2 s−1); arrows, saturating light pulses; black bars, times in the dark.
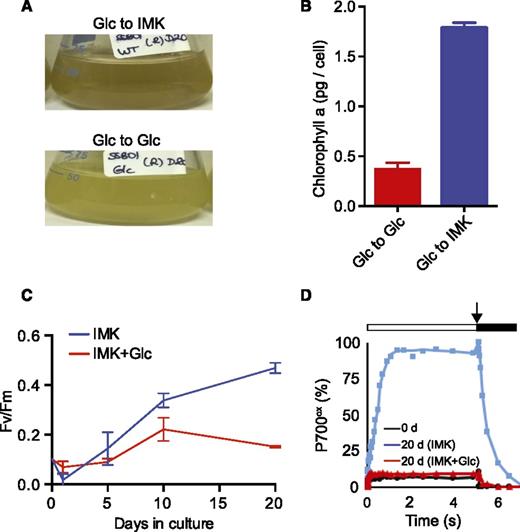
Recovery of pigmentation and PSII and PSI activities after return of Glc-grown SSB01 cells to Glc-free medium. Cells grown for 30 d in IMK+Glc medium (as in Fig. 1) were washed with sterile ASW, subcultured into the same medium (Glc to Glc) or into IMK medium (Glc to IMK), grown further in continuous light, and analyzed either after 20 d of growth (A, B, and D) or at intervals following the transfer (C). Shown are photographs of cultures (A), Chl a concentrations of methanol extracts (B), the F v/F m of PSII (C), and PSI activities (see Fig. 1; D). B and C show the means ± sds from three biological replicates; A and D each show one of two biological replicates that gave essentially identical results.
Accumulation of Lipids during Growth in the Presence of Glc
SSB01 cells grown on IMK+Glc medium in the light had larger diameters than cells grown without Glc supplementation (8.5 ± 0.8 μm vs. 7.6 ± 0.8 μm: Fig. 3A, BF) and appeared to accumulate lipid bodies (Fig. 3A, BF), as confirmed by staining the cells with the lipophilic fluorescent dye Nile Red (Fig. 3A, Nile Red). The reduced level of Chl fluorescence (Fig. 3A, Chl) in cells grown in IMK+Glc medium was consistent with their reduced Chl a content, as described above (Fig. 1C).
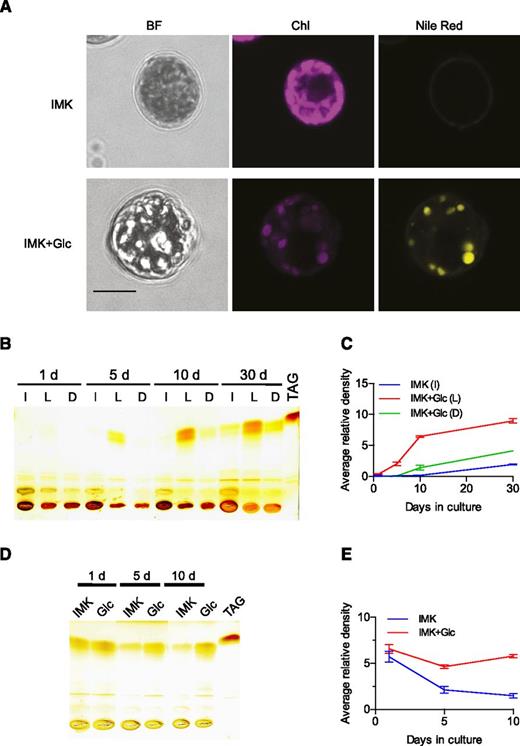
Reversible accumulation of lipids by SSB01 cells grown in the presence of Glc. A, Cells grown for 14 d in IMK or IMK+Glc medium in continuous light (as in Fig. 1) were fixed and stained for lipids with Nile Red (see “Materials and Methods”). Left to right: bright field images; chlorophyll autofluorescence; Nile Red fluorescence. Scale bar (all), 5 μm. B to E, Analysis of neutral lipids by TLC; a commercial TAG preparation (see “Materials and Methods”) was used as a marker. C and E show quantification of the putative TAG bands in B and D, respectively. B and C, Cells were grown for up to 30 d in IMK medium in continuous light (I) or in IMK+Glc medium in continuous light (L) or in the dark (D). The graph in C shows the means ± sds from two technical replicates of the Image J quantification of a single scan. A second biological replicate gave similar results. D and E, Analyses, as in B and C, of cells that had been grown for 30 d in IMK+Glc medium in the light and then shifted to fresh medium (IMK or IMK+Glc medium) and grown for an additional 1 to 10 d in the light. Two biological replicates gave similar results.
Many algae accumulate triacylglycerides (TAGs) as major carbon-storage compounds (Du and Benning, 2016), as was also recently reported for Symbiodinium (Jiang et al., 2014; Weng et al., 2014). To assess the nature of the lipids that accumulated in SSB01 cells during growth in Glc-containing medium, we used thin-layer chromatography (TLC) to resolve neutral from charged lipids. Indeed, the major lipids in cells grown in IMK+Glc medium were resolved by TLC and migrated to a position that was similar to that of a TAG standard (Fig. 3B); this material accumulated progressively during growth in IMK+Glc medium in the light and to a much lesser extent during growth in IMK+Glc medium in the dark or in unsupplemented IMK medium in the light (Fig. 3, B and C). TAG accumulation was reversible, as shown by shifting cells that had previously been grown in IMK+Glc medium back to IMK medium and growing them for an additional 10 d (Fig. 3, D and E).
Changes in Cell-Surface and Internal-Membrane Organization during Growth in the Presence of Glc
The changes in size and in pigment and lipid content observed when SSB01 cells were grown in the presence of Glc suggested that the cells might also exhibit alterations in both intracellular and cell-surface morphology. To evaluate these possibilities, we examined cells using both scanning and transmission electron microscopy (SEM and TEM). SEM revealed a striking change in the cell surface. The surfaces of cells grown in IMK+Glc medium were typically less rough and convoluted than those of cells grown in IMK medium (Fig. 4, A and B). Although this scoring is somewhat subjective, it was consistent in replicate trials in which individual images were scored without the observer's knowing in which medium the cells had been grown. A similar difference in surface structure was observed previously by SEM of cells grown in high light (typically more rough and convoluted) relative to cells grown in low light or maintained in the dark (typically smoother; Xiang et al., 2015). Differences in surface structures were also observed by TEM. Layers of peripheral/extracellular material, often observed as convoluted strands associated with denser material, were much more prominent in cells grown in IMK medium than in IMK+Glc medium (Fig. 4, C and D; Supplemental Fig. S1), consistent with the differences in surface morphologies observed by SEM. Taken together, the results suggest that both light and nutrient availability can have strong impacts on the Symbiodinium cell surface.
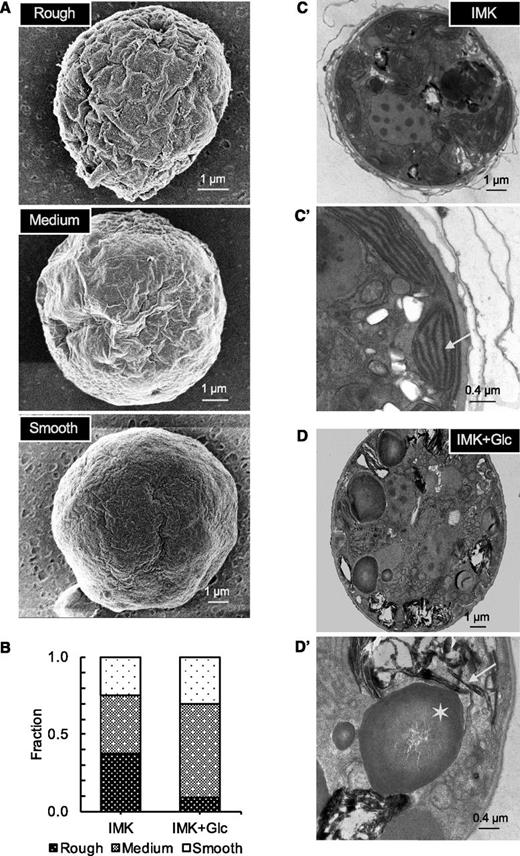
Changes in surface complexity and internal structure in SSB01 cells grown in the presence of Glc. Cells were grown for 14 d in IMK or IMK+Glc medium in continuous light. A, SEM images of representative cells. B, Quantification of cell-surface roughness (see “Materials and Methods”) from images similar to those in A; approximately 50 cells were scored in each population. C and D, TEM images of representative cells (scale bars, 1 µm) after growth in IMK (top) or IMK+Glc (bottom) medium; approximately 50 cells were examined for each population. (C’ and D’) Higher-magnification TEM images highlighting the altered internal membrane structures (e.g. thylakoid structure: arrows) and accumulation of apparent lipid bodies (asterisk) in the cells grown in IMK+Glc medium.
We also examined changes in intracellular morphology using TEM. The large globules apparent in images of cells grown in IMK+Glc medium (Fig. 4, D and D') but not in IMK medium (Fig. 4, C and C'), presumably represent lipid bodies (compare with Fig. 3A). Furthermore, in IMK-grown cells, the plastids typically appeared as chains of bulging membrane compartments that were ordered along the cell peripheries and contained ordered arrays of internal, often parallel membranes typical of thylakoid membranes (Fig. 4, C and C'; Supplemental Fig. S1, top). In contrast, in IMK+Glc-grown cells, it was difficult to observe plastid structures, and the internal membranes appeared fragmented, disorganized, and often vesicular, with essentially no extensive regions of parallel thylakoid membranes (Fig. 4, D and D'; Supplemental Fig. S1, bottom).
Changes in Gene Expression during Growth in the Presence of Glc
To investigate changes in gene expression that might be related to the physiological and structural changes that occurred during growth of SSB01 in the presence of Glc, we performed RNA-Seq on cells grown for 1, 5, 10, or 30 d in IMK medium, IMK+Glc medium in continuous light, or IMK+Glc medium in the dark. Transcript counts for all time points were compared to the time-zero values (for the cells growing in IMK+Cas medium that were used to inoculate the three experimental cultures), but data from the experimental cultures at the same time points were also compared among themselves. From the 40 library samples analyzed (four replicates at time zero plus three replicates for each of the three conditions at each of the four subsequent time points; see Supplemental Table S1 for details), 687,443,214 reads were generated, mapped to the SSB01 transcriptome assembly symb6 (Xiang et al., 2015), and used to analyze differences in gene expression using DESeq2 as described in “Materials and Methods.”
During growth of SSB01 cells in IMK+Glc medium in the light, 8,851 (approximately 15%) of the 59,669 transcripts in the symb6 assembly were differentially expressed [false discovery rate (FDR) adjusted P value < 0.05] based on differential expression at one or more of the time points (relative to time 0), although a more limited set of genes (5,520, approximately 9%) exhibited a >2-fold change in transcript abundance for at least one of the time points (Supplemental Table S2). Few changes were observed 1 d after the shift to IMK+Glc medium, with more changes occurring at the later time points.
Overall, the differences in levels of transcript accumulation that we observed were small, consistent with previous studies of gene-expression changes in SSB01 during exposure to different light intensities (Xiang et al., 2015). Only six transcripts exhibited a change in abundance of >10-fold at any time point following transfer to IMK+Glc medium (in either the light or the dark) but not when transferred to IMK medium (Supplemental Table S3). One of these transcripts (s6_42502) encodes a pseudouridine synthase, which catalyzes site-specific isomerization of U residues in RNA, which is by far the most abundant posttranscriptional modification identified in various RNAs of all organisms (Ge and Yu, 2013). Plastid transcripts in dinoflagellates have been shown to exhibit 3′ polyuridylylation (Wang and Morse, 2006). Moreover, miRNA directed cleavage can include a posttranscriptional addition of nonencoded oligouridine residues downstream of the cleavage site (Shen and Goodman, 2004). These findings raised the possibility that an increase in pseudouridine synthase mRNA (and potentially protein) in SSB01 could be related to plastid mRNA polyuridylylation, which is thought to be part of the mechanism associated with plastid mRNA turnover. However, the expression level of this transcript indicated by transcripts per kilobase million (TPM) is very low (0.76 in IMK medium and 7.23 and 2.22 in IMK+Glc medium in the light and dark, respectively, at day 10), making it unclear that the differences observed have physiological significance. The functions of the proteins encoded by the other five transcripts are not known, but their expression levels are also very low (Supplemental Table S3).
Small Changes in Nuclear Transcripts for Photosynthesis Proteins but Dramatic Changes in Plastid Transcripts during Growth in the Presence of Glc
Surprisingly, as SSB01 cells transition from autotrophic to mixotrophic/heterotrophic growth in Glc-supplemented medium, with photosynthetic activity declining and plastid structure showing marked alterations, the levels of transcripts from most nuclear genes encoding photosynthesis-related proteins exhibited little change. Of 131 such transcripts [59 of which encode light-harvesting-complex (LHC) proteins], only 10 exhibited slight differential expression after the cells were transferred to IMK+Glc medium, and for some of these, the seemingly significant change in expression was observed at only a single time-point following the shift in medium. The transcripts that exhibited some significant changes encode a PSI subunit (PSAE1), the chloroplast ATP synthase subunit C, chloroplast cytochrome f, and seven LHC polypeptides (Supplemental Table S4). Among the LHCs, two are subunits of the Chl a/c2-peridinin protein complex, four are subunits of the Chl a-c-binding-protein complex, and one is a peridinin-chlorophyll a-binding protein. Although the differential expression for these transcripts passed the significance test, the changes were mostly very small (Supplemental Table S4). In four cases (s6_345, s6_38374, s6_40562, s6_9564), similar changes were also observed in cells cultured in IMK medium, but only at the 30-d time point (Supplemental Table S4).
In contrast to the results observed for nuclear transcripts encoding plastid proteins, the RNA-Seq analysis revealed that the levels of plastid-encoded transcripts (all encoding proteins required for photosynthesis) declined sharply during growth of the cells in Glc-supplemented medium (Fig. 5A). Of the 12 reported Symbiodinium plastid protein-encoding genes (Barbrook et al., 2014; Mungpakdee et al., 2014), we only identified transcripts for six. Although the plastid-encoded transcripts may be polyuridylylated (Wang and Morse, 2006), they presumably do not have the 3′ polyA extension typical of nuclear-encoded mRNAs; thus, the other six transcripts may have been missed because they were excluded from the transcriptome libraries by the enrichment for polyA-containing mRNA that was used during library preparation (Xiang et al., 2015). Although the six plastid-encoded transcripts that we detected all appeared to behave similarly, it seemed possible that the polyA-enrichment step might have affected them differentially and thus affected their quantitation by RNA-Seq. Therefore, we also quantified the levels of these transcripts in total RNA using reverse-transcriptase (RT)-qPCR. The results were very similar to those obtained by RNA-Seq (Fig. 5B).
![Reduced levels of plastid-encoded transcripts during growth of SSB01 cells in the presence of Glc; data are shown for the six plastid genes identified in the symb6 transcriptome. A, Levels of plastid transcripts encoding components of PSII [psbA (s6_1009), D1 protein; psbC, (s6_108), CP43 Chl apoprotein], PSI [psaB (s6_42669), core protein that binds the P700 reaction center], cytochrome b6f complex [petB (s6_956) for cytochrome b6 and petD (s6_52046) for subunit IV], and the ATP synthase [atpA (s6_40072), α-subunit] indicated by TPM from RNA-Seq analysis (see “Materials and Methods”). x axis, days of growth in IMK or IMK+Glc medium in continuous light. The means ± sds were generated from the values for the three identical RNA-Seq experiments performed for each time point under the two different conditions. B, Levels of transcripts for the same six genes as determined by qPCR of cDNA from total RNA (see “Materials and Methods”) after growth of cells for 0 d (the preculture in IMK+Cas medium) or 10 d in IMK (I) or IMK+Glc (G) medium in continuous light. C, Levels of the plastid minicircles harboring thespecific plastid genes of A and B were quantified by qPCR from the same total-nucleic-acid samples that were used to prepare the samples for RT-qPCR analysis in B; values are expressed relative to that of the nuclear gene encoding cyclophilin, which was set as 1.0. B and C show the means ± sds from three independent biological replicates.](https://oup.silverchair-cdn.com/oup/backfile/Content_public/Journal/plphys/176/2/10.1104_pp.17.01572/2/m_plphys_v176_2_1793_f5.jpeg?Expires=1750343689&Signature=2KlcxIfdISjgB~lFGLtgERFkj5yYREbn0fiy~v2jqJWJFts0IFlIzhtTQF8FmtPwbon0b1mWZTwtJ6yJHJubV9D49xKsOzGfO7YCpWhqdz9MLegsDap8PXUiqfkluj92SzX555Kh71HTAbpOtH7NKgp6jAxXtf6dm8UZLk2IzMPh-9Y4f~tXH3X-ko4MpAIiUssabt26YKDUMJiWztgJUehQvEEIVY98lrhAOUyycKLff6Ow~dMkZ9GSQFOJybYEzvc-osTedV8uervUJS8que5sNw0dwx8~kQEpZVrwsOsCszg8FsTr81SSsVQJktaAN5hUVFmvGQFXt63uGQFQ2A__&Key-Pair-Id=APKAIE5G5CRDK6RD3PGA)
Reduced levels of plastid-encoded transcripts during growth of SSB01 cells in the presence of Glc; data are shown for the six plastid genes identified in the symb6 transcriptome. A, Levels of plastid transcripts encoding components of PSII [psbA (s6_1009), D1 protein; psbC, (s6_108), CP43 Chl apoprotein], PSI [psaB (s6_42669), core protein that binds the P700 reaction center], cytochrome b6f complex [petB (s6_956) for cytochrome b6 and petD (s6_52046) for subunit IV], and the ATP synthase [atpA (s6_40072), α-subunit] indicated by TPM from RNA-Seq analysis (see “Materials and Methods”). x axis, days of growth in IMK or IMK+Glc medium in continuous light. The means ± sds were generated from the values for the three identical RNA-Seq experiments performed for each time point under the two different conditions. B, Levels of transcripts for the same six genes as determined by qPCR of cDNA from total RNA (see “Materials and Methods”) after growth of cells for 0 d (the preculture in IMK+Cas medium) or 10 d in IMK (I) or IMK+Glc (G) medium in continuous light. C, Levels of the plastid minicircles harboring thespecific plastid genes of A and B were quantified by qPCR from the same total-nucleic-acid samples that were used to prepare the samples for RT-qPCR analysis in B; values are expressed relative to that of the nuclear gene encoding cyclophilin, which was set as 1.0. B and C show the means ± sds from three independent biological replicates.
Given the dramatic changes in chloroplast structure in Glc-grown cells (see above), the fact that dinoflagellate plastid genes are carried on DNA minicircles (whose copy number could conceivably vary) and the report of large changes in minicircle copy number during different growth phases in another dinoflagellate (Koumandou and Howe, 2007), it seemed possible that the dramatic decreases in the levels of plastid transcripts might reflect, at least in part, changes in minicircle copy number. Thus, we used qPCR to measure the copy numbers of the same six genes during growth in the presence of Glc. In four cases, we observed modest decreases in copy number (but much less than the changes in transcript abundance), whereas for the other two genes, the copy numbers actually increased modestly (Fig. 5C). Interestingly, in these two cases, the gene copy numbers actually increased more during growth in IMK than they did during growth in IMK+Glc (Fig. 3C). Taken together, our results support the hypothesis that the copy number of plastid minicircles can vary, at least modestly, under different growth conditions, but also suggest that the large changes in transcript abundance do not reflect these variations but rather reflect changes in the rates of transcription, mRNA turnover, or both.
Small Changes in the Expression of Glc-Transporter Genes during Growth in the Presence of Glc
To attempt to identify the transporters responsible for utilization of exogenous Glc by SSB01 cells, we searched the symb6 transcriptome (Xiang et al., 2015) and identified, based on amino acid-sequence homologies, 24 transcripts encoding potential Glc transporters. From their deduced protein sequences, these transporters were divided into two groups; seven are homologous to the bidirectional uniporters called SWEETs (Chen et al., 2015), whereas 17 are homologous to major facilitator-type transporters of the GLUT transporter family (Wood and Trayhurn, 2003), which are also uniporters that catalyze facilitated diffusion of Glc down its concentration gradient (Supplemental Figs. S2 and S3; Supplemental Table S5). Nine of the putative transporter genes were slightly differentially expressed at one or more of the time points in at least one of the conditions (Supplemental Table S6). In four cases, transcript levels increased by approximately 2-fold by day 5 or 10 (Fig. 6A). Three of these transporters (s6_28295, s6_26300, and s6_19007) are of the SWEET type (Fig. 6B) and contain the highly conserved amino acids known to be critical for transporter function, including the conserved Asn that is associated with Glc binding (Xu et al., 2014) and a Tyr located in the putative intrafacial gate (Xuan et al., 2013; Tao et al., 2015; Fig. 6B, stars). The fourth predicted protein (transcript s6_47395) contains the conserved residues (glutamines and Asn) that hydrogen-bond to d-Glc in the GLUT-type transporters (Fig. 6C, stars) as well as the sugar-transporter signature motifs D(N)RXGRR and PETK (Deng et al., 2014; Fig. 6C, underlined). The abundances of the Glc-transporter transcripts changed little in cells grown in IMK medium (Fig. 6A; Supplemental Fig. S4) and showed smaller increases in cells grown in IMK+Glc medium in the dark, when the cells grow more slowly than in the light (Supplemental Fig. S4).
![Elevated transcript abundances for some Glc transporters during growth of SSB01 cells in the presence of Glc. A, Cells were grown for up to 30 d in IMK or IMK+Glc medium in continuous light. The abundances of transcripts encoding some potential SWEET-type (s6_28295; s6_26300; s6_19007) and GLUT-type (s6_47395) Glc transporters are shown as TPM quantified from the RNA-Seq data (see Fig. 5 and Materials and Methods). Shown are mean ± sds. P values (from t tests). ***P < 0.001; **P < 0.01; *P < 0.05. B, Amino acid-sequence alignment of regions of the same predicted SSB01 SWEETs with SWEET1 from Arabidopsis thaliana. The red stars indicate the conserved Asn (N) residue that binds Glc and the conserved Tyr (Y) residue located in the putative intrafacial gate of the transporter. C, Amino acid-sequence alignment of a region of the same predicted Symbiodinium GLUT with GLUT4 from Homo sapiens (GTR4_hs). The residues predicted to be hydrogen-bonded to d-Glc are indicated by red stars. The conserved signature motifs of the sugar-transporter family [D(N)RXGRR and PETK motifs] are underlined in red.](https://oup.silverchair-cdn.com/oup/backfile/Content_public/Journal/plphys/176/2/10.1104_pp.17.01572/2/m_plphys_v176_2_1793_f6.jpeg?Expires=1750343689&Signature=RLXYW~hvoI74PkpWUGRMuPRTNMZ0qBKP11iPR~vHU5esumoLJJGnKJjb6IPlanZ6b847aXOOQ4nUz8hpwlqIc9nRHdgATA6RSO6wo7xa5o91zZJHCKatDaEN7RI0nqRu-TXwkcGgiscwTwCu6quC8NHzhv1f4EVTe6JvzF06s9naThaBsPXjfoQRGzG3fOR-3OCcDVnc2yQlrhPB9HXbwX9jTiy8~nIg2YZRYkcdgq~k9rRiLxSDtpMvWx90VAtY8ELS3gv9x3QB5XIGyoSDWpT05ziT9ySKohPb82Q35gIE0lWHnoscGPMY3sfWnyXmoW27PrpXLgvBYg8OMbglpg__&Key-Pair-Id=APKAIE5G5CRDK6RD3PGA)
Elevated transcript abundances for some Glc transporters during growth of SSB01 cells in the presence of Glc. A, Cells were grown for up to 30 d in IMK or IMK+Glc medium in continuous light. The abundances of transcripts encoding some potential SWEET-type (s6_28295; s6_26300; s6_19007) and GLUT-type (s6_47395) Glc transporters are shown as TPM quantified from the RNA-Seq data (see Fig. 5 and Materials and Methods). Shown are mean ± sds. P values (from t tests). ***P < 0.001; **P < 0.01; *P < 0.05. B, Amino acid-sequence alignment of regions of the same predicted SSB01 SWEETs with SWEET1 from Arabidopsis thaliana. The red stars indicate the conserved Asn (N) residue that binds Glc and the conserved Tyr (Y) residue located in the putative intrafacial gate of the transporter. C, Amino acid-sequence alignment of a region of the same predicted Symbiodinium GLUT with GLUT4 from Homo sapiens (GTR4_hs). The residues predicted to be hydrogen-bonded to d-Glc are indicated by red stars. The conserved signature motifs of the sugar-transporter family [D(N)RXGRR and PETK motifs] are underlined in red.
Small Changes in the Levels of Transcripts Associated with Carbon Metabolism and Cell-Surface Structure
Some transcripts encoding proteins previously shown to be involved in TAG biosynthesis were identified as potentially differentially expressed, although the levels of change were small. Diglyceride acyltransferase (or O-acyltransferase) (DGAT) is an integral membrane protein that functions in catalyzing the terminal and only committed step in TAG synthesis, using diacylglycerol and fatty acyl CoA as substrates (Cases et al., 1998). The s6_3806 and s6_25682 transcripts, which encode DGATs, increased by 1.5- to 2-fold in cultures grown in IMK+Glc medium (Supplemental Table S7, bold). In addition, a transcript encoding α-amylase (s6_40013) declined in abundance following Glc supplementation (Supplemental Table S7), although it also declined in the control culture in IMK medium.
Because we had observed major changes in the internal and surface features of the cells in the presence of Glc (Fig. 4), we also examined the levels of transcripts potentially involved in the synthesis and structure of the cell matrix and/or recycling of internal cellular features. There were some differences in the levels of transcripts encoding proteins involved in the biogenesis of the extracellular matrix and cell wall. For example, the level of transcript s6_33804, which encodes a probable glucan 1,3-β-glucosidase that may be involved in cell wall metabolism (Yoko-o et al., 2001), has an almost 3-fold decrease in cultures supplemented with Glc (Supplemental Table S8). The levels of another 13 transcripts encoding proteins typically associated with cell adhesion were also modulated to some extent (Supplemental Table S8, bold).
However, in many cases, the changes in transcript levels observed for genes potentially involved either in lipid biosynthesis or in cell-surface structure were similar following transfer of the cells to all three of the growth conditions used, suggesting that the generally small changes in expression that we noted for these transcripts may not drive the physiological modifications observed during exposure of the cells to Glc.
Reduced Ability of Glc-Grown SSB01 Cells to Establish Symbiosis
To further investigate the functional significance of the switches in trophic state and cell structure during growth of SSB01 in the presence of Glc, we examined the ability of the cells grown in IMK or IMK+Glc medium to populate the larvae of a model host cnidarian, the sea anemone Aiptasia. SSB01 cells grown in IMK medium in the light readily infect and populate aposymbiotic Aiptasia larvae (Hambleton et al., 2014). However, after 14 d of growth in IMK+Glc medium, the partially bleached algae were much less efficient in populating the larvae (Fig. 7). This result suggests that the differences in photosynthetic function, surface properties, and/or other cell characteristics that occur during growth on Glc impact the establishment and/or maintenance of the symbiotic association, a topic that we are currently exploring in more detail (see “Discussion”).
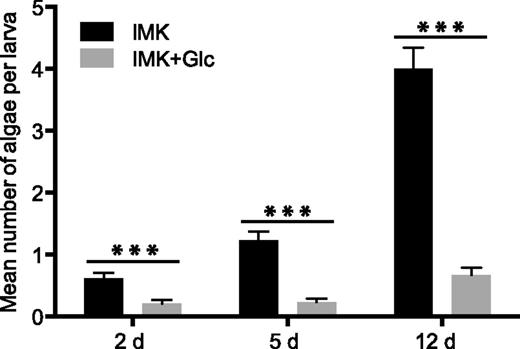
Inefficient population of a cnidarian host by SSB01 cells after growth in the presence of Glc. Six-day-old Aiptasia larvae (see “Materials and Methods”) were exposed for 2 d to SSB01 cells (1 x 10⁴ cells mL−1) that had been grown in IMK or IMK+Glc medium for 14 d in continuous light, and the numbers of algae in larval gastrodermal cells were determined by fluorescence microscopy (see “Materials and Methods”) at the indicated times after the initial exposure. Shown are means ± sems. ***P (t test) < 0.001.
DISCUSSION
In vascular plants and many algae, external stimuli can elicit marked changes in the transcriptional activity of genes present in the nuclear genome (González-Ballester et al., 2010; Urzica et al., 2012; Lan et al., 2013; Schmollinger et al., 2014; Gaudinier and Brady, 2016). In contrast, several groups have reported that changes in environmental conditions elicit relatively small changes in the abundance of nuclear transcripts in both Symbiodinium (Leggat et al., 2011; Barshis et al., 2014; Xiang et al., 2015) and other dinoflagellates (Lin, 2011; Moustafa et al., 2010). For example, Barshis et al. (2014) examined the transcriptome-wide responses of coral-associated clades C and D Symbiodinium after 3 d of heat stress and observed no detectable changes in gene expression. Similarly, when corals were exposed to an 8-d period of elevated temperature, little change (less than 2x) in expression was observed for any of the Symbiodinium genes thought to be important for stress tolerance, while 10-fold differences in transcript abundances were noted for the analogous animal host genes (Leggat et al., 2011). Similarly, our study shows pronounced physiological changes in Symbiodinium upon transfer of the cells from Glc-free to Glc-containing medium that are not reflected at the level of nuclear-transcript accumulation; there is a lack of congruence of physiological behavior with nuclear-gene expression. The “muted” nuclear transcriptional responses of Symbiodinium and other dinoflagellates may reflect the unique characteristics of their nuclear chromosomes, which appear to be in a permanently condensed state (Dodge, 1965; Lin, 2011; Wisecaver and Hackett, 2011), and raise the possibility that many processes in the cells are controlled at the posttranscriptional level. For example, two recent reports have indicated that miRNAs may play a regulatory role in controlling transcript levels, and possibly the level of translation, in Symbiodinium in response to different nutrient conditions (Baumgarten et al., 2013; Lin et al., 2015).
In our studies, we have examined the physiological and transcriptional changes elicited in Symbiodinium strain SSB01 under various light (Xiang et al., 2015) and nutrient (this study) conditions. We showed that SSB01 loses pigmentation and photosynthesis as it switches from photoautotrophic to mixotrophic growth following the addition of Glc to the medium in the light. Similar bleaching phenomena were observed in the green alga Chlorella protothecoides maintained in Glc-supplemented medium in the dark (Matsuka and Miyachi, 1974) and in spinach (Spinacia oleracea) leaves supplied with Glc (Krapp et al., 1991). In vascular plants, elevated sugar levels resulted in repression of both nuclear and plastid genes involved in photosynthesis (Pego et al., 2000). For example, the abundance of nuclear transcripts encoding the small subunit of Rubisco dramatically declined in tomato (Solanum lycopersicum) when leaf discs were floated on solutions containing Suc or Glc (Van Oosten and Besford, 1994).
In parallel with the loss of pigment, we observed a dramatic decrease in both PSI and PSII activities in SSB01 cells during growth on Glc-supplemented medium. This decrease was accompanied by a loss of the evenly spaced, parallel-arranged thylakoid membranes observed in plastids of photoautotrophically growing SSB01 cells, as well as the occurrence of a membrane arrangement that appeared fragmented with essentially no ordered structure. This change in cellular morphological/physiological features was also reflected by changes in the fixed carbon stored by the dinoflagellate. Mixotrophically grown SSB01 sequesters high levels of carbon reserves as TAGs, possibly through opportunistic uptake and storage of Glc from the medium. Accumulation of TAG also occurred in photoautotrophically grown cells as the cultures aged, but the levels were much lower.
The levels of transcripts from a small number of nuclear genes encoding proteins involved in photosynthesis and carbon storage were very modestly impacted by inclusion of Glc in the medium, but the great majority of such transcripts did not change significantly. In sharp contrast, Glc supplementation of the medium resulted in a marked decline (85%–95%) in the abundance of all plastid-encoded transcripts examined (encoding photosynthetic proteins), with little (<50%) or no change in the copy numbers of the minicircles that harbor these genes. Symbiodinium plastid genes also exhibited a transcriptional response when cells were exposed to elevated temperature (McGinley et al., 2012; Baumgarten et al., 2013). Overall, our results and those of others indicate that various external stimuli can strongly modulate Symbiodinium plastid gene expression (and/or transcript turnover), with much less of an impact on levels of the DNA minicircles on which those genes reside.
The growth of SSB01 cells is more rapid under mixotrophic than under either heterotrophic or photoautotrophic conditions (Xiang et al., 2013), suggesting that the cells can utilize extracellular Glc in the light as well as in the dark. In mammalian cells, there are many genes encoding GLUT-type Glc transporters for which expression is cell-type specific and/or subject to hormonal and environmental control (Medina and Owen, 2002). Unicellular free-living organisms like yeast have high-affinity Glc transporters that exhibit elevated expression on nonfermentable carbon sources and are repressed by high levels of Glc, whereas low-affinity transporters predominate in the presence of a high concentration of Glc (Rolland et al., 2002). Plants have a family of SWEET-type sugar transporters that are bidirectional and mainly responsible for the efflux and intracellular trafficking of sugars (Chen et al., 2010). SSB01 has at least 24 transcripts encoding proteins similar to GLUT or SWEET transporters. Transcripts encoding the SWEETS are also present in Symbiodinium clades C and D from the coral Acropora hyacinthus (Ladner et al., 2012) and Symbiodinium sp. CassKB8 (clade A) originally isolated from Cassiopea sp. in Kaneohe Bay, HI (Bayer et al., 2012), as well as encoded in the genome of Symbiodinium kawagutii (Lin et al., 2015; Supplemental Table S9). Expression of some of the genes encoding the Glc transporters in SSB01 appears to be regulated by Glc: the levels of three transcripts encoding SWEETs and one encoding a GLUT increased when the medium was supplemented with Glc. These data raised the possibility that SSB01 may be able to sense environmental Glc levels and adjust expression of some GLUT and SWEET genes. However, the increases in expression were only about 2-fold.
We also exploited our ability to generate bleached SSB01 to begin investigating a potential role of photosynthesis in controlling the initiation and maintenance of the symbiotic association. A hallmark of the algal-cnidarian symbiosis is the transfer of photosynthetically fixed carbon from the alga to the host. We found that once Glc-grown SSB01 loses most photosynthetic activity, it is no longer able to rapidly populate Aiptasia larvae, raising the possibility that photosynthetic function impacts the establishment and/or maintenance of the symbiotic association. Interestingly, it was recently reported that the sugar trehalose is released into the medium by Symbiodinium and can act as a chemoattractant of coral larvae, stimulate feeding behavior in the larvae, and serve as a cue that indicates that the algae are photosynthetically competent (Hagedorn et al., 2015). Thus, photosynthetically derived, fixed-carbon signaling molecules may be critical for optimizing various aspects of Symbiodinium-cnidarian interactions such as attraction between the organisms, symbiont uptake, symbiont spread in the host tissue, and/or maintenance of the association.
The surface structure of Symbiodinium cells may also be critical for interactions with anemone and coral hosts. Surface ligand-receptor interactions are important for animal-microbial phagocytosis (Janeway and Medzhitov, 2002) and have been suggested to be integral to dinoflagellate-cnidarian symbiosis (Davy et al., 2012). We found that growth in the presence of Glc causes a change in the SSB01 cell-surface morphology, with a reduction in what appears to be a morphologically complex extracellular matrix. These surface differences may contribute to the reduced infection seen with Glc-grown cells.
The experimental tools available for investigation of the impact of photosynthesis on coral symbiotic associations at the molecular level have been limited. The use of axenic Symbiodinium cultures, along with the ability to grow some Symbiodinium strains heterotrophically on Glc, expands this toolkit significantly. It should also allow the isolation of algal mutants defective in photosynthetic functions. The establishment of heterotrophic growth in the green alga Chlamydomonas was a major factor in facilitating the use of this organism as a leading model for photosynthesis research (Levine and Goodenough, 1970; Rochaix, 2001; Jinkerson and Jonikas, 2015), and this feature of some Symbiodinium strains should be similarly powerful in elucidating the roles of photosynthetic activities in the cnidarian-alga association.
CONCLUSIONS
The inclusion of Glc in the growth medium elicits profound changes in the morphology and metabolism of Symbiodinium strain SSB01, including a loss of pigmentation and photosynthetic function, disruption of plastid morphology, and an increased accumulation of TAG. The changes in levels of nuclear-encoded transcript were generally small, but there was a marked reduction in the levels of all plastid-encoded transcripts examined. We also observed modest changes in the levels of some nuclear-encoded transcripts for Glc transporters. Taken together, the results suggest that in contrast to what is observed in many other organisms, the physiological alterations that occur in Symbiodinium cells maintained on Glc depend primarily on posttranscriptional regulation of nuclear-gene expression. Glc-grown, bleached SSB01 cells are also less able to efficiently populate Aiptasia larvae. Overall, this research demonstrates various physiological features of SSB01 that are sensitive to growth conditions (life style) and suggests that the life style and means of acquiring fixed carbon are linked to the ability of SSB01 cells both to survive periods outside of a host and to populate and metabolically integrate with a cnidarian host.
MATERIALS AND METHODS
Strain and Growth Conditions
The clonal, axenic Symbiodinium minutum strain SSB01 (Xiang et al., 2013; Baumgarten et al., 2015) was used in all experiments. Stock cultures were grown in Daigo’s IMK medium for marine microalgae (Wako Pure Chemicals) supplemented with casein hydrolysate (IMK+Cas; Xiang et al., 2013) at 27°C at a light intensity of 10 μmol photons m−2 s−1 from Philips ALTO II 25-W bulbs on a 12-h-light:12-h-dark cycle. The medium was prepared in artificial seawater (ASW; Xiang et al., 2013). To examine the effects of growth in the presence of exogenous Glc, approximately 1.25-2.5 x 10⁷ cells from a growing stock culture (approximately 1.5 x 10⁶ cells/mL) were collected by centrifugation at 100 g for 5 min at room temperature, washed once with autoclave-sterilized ASW, transferred to 50 mL of either IMK medium or IMK medium supplemented with 5 g/L Glc (IMK+Glc medium) in 250-mL flasks, and grown without agitation or a change of medium either in continuous (24 h) light at the intensity described above or in continuous dark. To examine recovery from the effects of having Glc in the medium, approximately 2.5 x 10⁷ cells that had been grown for 30 d on IMK+Glc medium in the light were collected by centrifugation (as above), washed 2x in sterile ASW, resuspended in 50 mL of fresh IMK or IMK+Glc medium in a 250-mL flask, and grown in continuous light without agitation as described above. Cell concentrations were monitored using a Guava flow cytometer (Krediet et al., 2015); the counting window was adjusted to ensure that even cells with reduced Chl content were counted (Supplemental Fig. S5). Cell diameters were quantified from ≥500 cells under each culture condition using a Countess II FL Automated Cell Counter (Invitrogen) and are reported as the mean values ± sds.
Analyses of Photosynthetic Pigments and Function
To analyze photosynthetic pigments, approximately 106 cells were collected by centrifugation (as above), washed once in sterile ASW, resuspended in 1 mL of 100% methanol at room temperature, vortexed for approximately 2 min, and incubated overnight in the dark at −20°C. After removal of cell debris by a brief centrifugation in a microfuge at full speed at room temperature, pigment absorbances were determined at 300 to 800 nm using a Shimazu UV-2550 spectrophotometer. Absorbance readings were normalized to 106 cells based on cell counts made just prior to cell collection. Chl a concentrations were determined as described previously (Mackinney, 1941).
Maximum quantum yields of photosystem II, F v/F m = (F m −F 0)/F m, were determined for samples of cell culture (approximately106 cells/mL) using a Dual Pam-100 fluorometer (Heinz Walz) after a dark adaptation of 5 min. To measure PSI activities, cells were collected from growing cultures (approximately106 106 cells/mL) by centrifugation at 200g for 8 min at room temperature, and the cell pellets were resuspended in sterile ASW medium containing 20% Ficoll. The fraction of photo-oxidizable P700 (P700 OX) was then measured for whole cells using a JTS-10 spectrophotometer (Bio-Logic; Joliot and Delosme, 1974). Before the measurements, the cells were incubated with 20 μm DCMU for 15 min in the dark to block electron flow out of PSII. Levels of P700ox were determined by optical changes at 705 nm and corrected based on the kinetics measured at 735 nm (Takahashi et al., 2016).
Analyses of Cellular Lipid Content
Lipid extraction and analysis of neutral lipids by TLC were performed as described previously (Li et al., 2012). Briefly, approximately 106 2 x10⁶ cells for each sample were collected by centrifugation (as above), and lipids were extracted using methanol/chloroform/88% formic acid (20:10:1 by volume) followed by the addition of 0.5 volumes of 1 m KCl, 0.2 m H3PO4 and separation of the phases by centrifugation at 3000g for 3 min at room temperature. The organic phase was spotted onto Silica G60 TLC plates (EMD Chemicals), and lipids were resolved by developing the plates with petroleum ether/diethyl ether/acetic acid (80:20:1 by volume). A commercial preparation of TAGs (Sigma Aldrich #47118) was used as the standard. After visualization by brief staining with iodine, the plates were scanned, and densities of the TAG bands quantified using ImageJ software (Gassmann et al., 2009).
Cellular lipid bodies were stained with Nile Red as described previously (Terashima et al., 2015). Briefly, cells were collected by centrifugation (as above), fixed in 4% methanol-free formaldehyde (Thermo Fisher no. 28906) for 1 h at 4°C, washed five times with PBS, and resuspended in PBS. Nile Red (Sigma Aldrich no. 72485) was then added to the cell suspensions at 1:100 dilution from a stock of 100 μg mL−1 in methanol, followed by an incubation for 30 min in the dark at room temperature. Cells were then imaged using a Leica SP5 confocal microscope with excitation at 488 nm and fluorescence emission measured at 508 to 600 nm (Nile Red) and 650 to 700 nm (chlorophyll).
SEM and TEM
Cells grown in IMK or IMK+Glc medium at 27°C in the light for 14 d were collected by centrifugation at 100g and imaged by SEM and TEM as described previously (Xiang et al., 2015; Bieri et al., 2016). The surface patterns of cells observed by SEM were categorized as smooth, medium or rough, as described in Figure 4A and in Xiang et al. (2015). Briefly, images from all treatments were made anonymous and scored independently three separate times as being smooth, medium, or rough. The three trials gave similar results.
Analysis of Plastid Transcript and Gene Levels
Cells grown under various conditions were collected by centrifugation, and RNA was extracted and used to construct libraries for RNA-Seq as described previously (Xiang et al., 2015). Analyses of the data were also performed as described by Xiang et al. (2015), except that DESeq2 (Love et al., 2014) was used to identify differentially expressed genes; mRNA abundances are expressed in TPM (Wagner et al., 2012). Changes in transcript levels with a FDR-adjusted P value of ≤ 0.05 were regarded as representing differential expression. All raw sequencing reads are available in the Sequence Read Archive (http://www.ncbi.nlm.- nih.gov/sra) with accession number PRJNA388224. Expression levels for all transcripts under all conditions are given in Supplemental Data S1.
To measure the relative copy numbers of plastid minicircles, total DNA was extracted from the various cell populations using the Plant DNeasy kit (Qiagen) and then used for qPCR with the primers listed in Supplemental Table S10. To determine mRNA levels for plastid genes, total RNA was prepared (Xiang et al., 2015), primed with random hexamers, and reverse transcribed using Superscript II (Invitrogen) to generate cDNA. qPCR was then performed using a LightCycler 480 (Roche) on triplicate 20-μL reactions with the primers listed in Supplemental Table S10. cDNA of transcript s6_22283 (encoding cyclophilin; the level of this transcript remained the same under the different conditions examined based on TPM from the RNA-Seq) and the corresponding genomic DNA were used as references for normalization of plastid transcript levels and gene abundances, respectively (Rosic et al., 2011). Calculations of the average crossing point (Cp) values, standard deviations, and the resulting expression ratios for each target gene were determined using LightCycler 480 software.
Amino Acid-Sequence Alignments
Alignments of multiple amino acid sequences were performed using MUSCLE (Edgar, 2004a, 2004b). The analysis for SWEETs involved seven protein sequences predicted from the transcriptome assembly symb6 (Xiang et al., 2015; Supplemental Table S5) and four AtSWEET protein sequences from Arabidopsis (Arabidopsis thaliana; AtSWEET1, AtSWEET9, AtSWEET11, and AtSWEET12). The analysis for GLUTs involved 17 protein sequences predicted from symb6 (Supplemental Table S5), five GLUT-type transporter sequences from Homo sapiens (GTR2, GTR3, GTR4, and GTR1), and one sequence from Chlorella kessleri (HUP1, ID P15686).
Exposure of Aiptasia Larvae to Glc-Bleached Symbiodinium
Larvae of Aiptasia were obtained by inducing adult anemones to spawn in the laboratory using the following protocol (originally developed by S.F. Perez & J.R. Pringle); the clonal lines CC7 (male; Sunagawa et al., 2009) and PLF3 (female; from the same FL-derived population as CC7) were used. Large adults (>15 mm in oral-disk diameter) were paired, one male to one female, in small plastic polycarbonate tanks containing 300 mL of ASW, which were then maintained at 27°C with white fluorescent bulbs (Philips ALTO II 25-W bulbs) at an intensity of 25 μmol photon m−2 s−1 and actinic blue LED lights (peak output at 453 nm) at an intensity approximately 1 μmol photon m−2 s−1. Anemones were induced to spawn using the light regimen (1) 12 h light:12 h dark for 25 d followed by (2) 16 h light:8 h dark for 5 d, with the blue LEDs kept on throughout the dark period. External fertilization of gametes resulted in swimming larvae within 24 h after spawning, and 6-d-old larvae (with well-developed mouths) were used for the experiments.
On day 0 (before addition of algae), 50 larvae were fixed in 3.7% formaldehyde at 4°C for 1 h, followed by three washes with PBS. Then 300 larvae were placed in 5 mL of ASW in each well of a 6-well polypropylene plate and exposed to SSB01 cells at 104 cells mL−1; the algae had been grown in either IMK or IMK+Glc medium for 14 d in continuous light and were washed in ASW before being provided to the larvae. After 1 d, the algae plus the growth medium were removed and replaced with fresh medium containing the same concentration of algae as present during the initial incubation; after 2 d, the algae were removed and not replaced, and the ASW was changed daily thereafter. At intervals, approximately 100 larvae per treatment were fixed and washed with PBS as described above and then washed five more times with PBS containing 0.2% Triton X-100 (PBT) for 20 min per wash. Larvae were then stained with Alexa Fluor 488 Phalloidin (Thermo Fisher no. A12379; 1:40 in PBT) for 20 min at room temperature, washed three times with PBS for 5 min each, mounted on a glass slide in 3:1 glycerol:PBS, and imaged on a Zeiss Axioskop2 Plus fluorescence microscope. The number of algae within each larva was quantified manually using the red Chl autofluorescence of the algae, and counting only algae that appeared to be within the gastrodermal layer of the larva, as determined by the Phalloidin-labeling of the cell boundaries. Three independent replicates of the infection assay were performed and about 600 larvae were used for quantification. The mean numbers of algae per larva were determined across all larvae for each treatment and time point.
Supplemental Data
The following supplemental materials are available.
Supplemental Table S1. cDNA libraries used for RNA-Seq analyses. See text for details.
Supplemental Table S2. Numbers of differentially expressed transcripts after growth of SSB01 cells for up to 30 d in IMK medium in continuous light, IMK+Glc medium in continuous light, or IMK+Glc medium in the dark.
Supplemental Table S3. Transcripts with expression elevated by more than 10-fold relative to the day 0 sample in IMK+Glc medium; also shown are the levels of these transcripts after growth of the cells in IMK and IMK+Glc medium in the dark.
Supplemental Table S4. Expression levels of photosynthesis-related genes after growth of SSB01 cells on IMK or IMK+Glc medium in continuous light for up to 30 d.
Supplemental Table S5. The potential SWEET-type and GLUT-type Glc transporters identified in the SSB01 transcriptome assembly symb6.
Supplemental Table S6. Expression levels of genes encoding potential Glc transporters after growth of SSB01 cells for up to 30 d on IMK medium in continuous light, IMK+Glc medium in continuous light, or IMK+Glc medium in the dark.
Supplemental Table S7. Expression levels of genes encoding proteins related to lipid and starch metabolism after growth of SSB01 cells for up to 30 d in IMK medium in continuous light, IMK+Glc medium in continuous light, or IMK+Glc medium in the dark.
Supplemental Table S8. Expression levels of genes encoding extracellular-matrix-related proteins after growth of SSB01 cells for up to 30 d on IMK medium in continuous light, IMK+Glc medium in continuous light, or IMK+Glc medium in the dark.
Supplemental Table S9. Transcripts encoding potential SWEET-type Glc transporters found in available transcriptomes and genome for Symbiodinium strains in clades A, C, D, and F. See Discussion for details.
Supplemental Table S10. Primers used for qRT-PCR and qPCR analyses. See text for details.
Supplemental Figure S1. Surface complexity and subcellular structures of representative SSB01 cells as observed by TEM after growth for 14 d in IMK or IMK+Glc medium in continuous light. Representative images are shown. Scale bars, 1 µm.
Supplemental Figure S2. Amino acid-sequence alignment of predicted SWEET transporters in SSB01 transcriptome assembly symb6 with four SWEETs from Arabidopsis (ARATH). See also Supplemental Table S5.
Supplemental Figure S3. Amino acid sequence alignment of predicted GLUT transporters in SSB01 transcriptome assembly symb6 with GLUT-type transporters from Homo sapiens (HUMAN) and Chlorella kessleri (HUP1_PARKE).
Supplemental Figure S4. Levels of transcripts for potential Glc transporters of the SWEET (s6_28295, s6_26300, and s6_19007) and GLUT (s6_10561, s6_47395, and s6_35311) types during growth of SSB01 in IMK medium in continuous light, IMK+Glc medium in continuous light, or IMK+Glc medium in continuous dark. x axis, days of growth; y axis, the TPM quantified from RNA-Seq data.
Supplemental Figure S5. Red-fluorescence and side-scatter profiles generated by the Guava flow cytometer for SSB01 cells grown in IMK medium (left; unbleached cells) or IMK+Glc medium (right; partially bleached cells) medium for 14 d in continuous light (Krediet et al., 2015).
Supplemental Data S1. Expression levels of all genes after growth of SSB01 cells for up to 30 d on IMK medium in continuous light, IMK+Glc medium in continuous light, or IMK+Glc medium in the dark.
ACKNOWLEDGMENTS
We are indebted to Xiaobo Li for technical assistance with the lipid analyses, Lydia-Marie Joubert for processing and imaging the SEM samples, Jon Mulholland and John Perrino (Stanford University Cell Sciences Imaging Facility) for assistance with TEM, Heather Cartwright for assistance with light and fluorescence microscopy, and Feng Wang, Dimitri Tolleter, and members of the Grossman and Pringle laboratories for helpful discussions.
LITERATURE CITED
Author notes
This work was supported by the Gordon and Betty Moore Foundation Grant 2629.01 to A.R.G. and J.R.P., a Simons Fellowship of the Life Science Research Foundation to R.E.J., and a National Institutes of Health Shared Instrumentation Grant 1S10RR02678001 to J. Mulholland.
Address correspondence to [email protected].
The author responsible for distribution of materials integral to the findings presented in this article in accordance with the policy described in the Instructions for Authors (www.plantphysiol.org) is: Tingting Xiang ([email protected]).
T.X. and A.G. conceived and planned the research and analyzed the data; T.X. performed most of the experiments; R.J. provided bioinformatics assistance; S.C. measured photosynthetic activities; M.O. performed the TEM; C.T., C.K., and P.C. tested the ability of Symbiodinium to infect Aiptasia; P.C., C.K., C.T., and J.P. provided critical evaluations of the results; and T.X., A.G. and J.P. wrote the manuscript, with contributions from all the authors.
Articles can be viewed without a subscription.
