


Abstract
Sucrose nonfermenting related kinase1 (SnRK1) is a conserved energy sensor kinase that regulates cellular adaptation to energy deficit in plants. Activation of SnRK1 leads to the down-regulation of ATP-consuming biosynthetic processes and the stimulation of energy-generating catabolic reactions by transcriptional reprogramming and posttranslational modifications. Although considerable progress has been made during the last years in understanding the SnRK1 signaling pathway, many of its components remain unidentified. Here, we show that the catalytic α-subunits KIN10 and KIN11 of the Arabidopsis (Arabidopsis thaliana) SnRK1 complex interact with the STOREKEEPER RELATED1/G-Element Binding Protein (STKR1) inside the plant cell nucleus. Overexpression of STKR1 in transgenic Arabidopsis plants led to reduced growth, a delay in flowering, and strongly attenuated senescence. Metabolite profiling revealed that the transgenic lines exhausted their carbohydrates during the dark period to a greater extent than the wild type and accumulated a range of amino acids. At the global transcriptome level, genes affected by STKR1 overexpression were broadly associated with systemic acquired resistance, and transgenic plants showed enhanced resistance toward a virulent strain of the biotrophic oomycete pathogen Hyaloperonospora arabidopsidis Noco2. We discuss a possible connection of STKR1 function, SnRK1 signaling, and plant immunity.
Plants are the prime example of photoautotrophic organisms, using photosynthesis to harness energy from sunlight for the conversion of CO2 into energy-rich carbohydrates. These photoassimilates are then directed to fuel plant growth and development. However, as sessile organisms, plants usually have to cope with strongly fluctuating environmental conditions, many of which negatively impact on energy availability, as they interfere with the production or distribution of photoassimilates. In order to maintain energy homeostasis and to promote survival, energy shortage triggers a massive cellular reprogramming characterized by nutrient remobilization, suppression of biosynthetic processes, and growth arrest (Baena-González, 2010). A central component of low-energy signaling in plants is the sucrose nonfermenting related kinase1 (SnRK1), which is orthologous to the AMP-dependent kinase (AMPK) and sucrose nonfermenting1 (SNF1) in mammals and yeast, respectively. Similar to its opisthokont counterparts, the SnRK1 holoenzyme is a heterotrimeric complex consisting of a catalytic α-subunit and noncatalytic β- and plant-specific βγ-subunits (Ramon et al., 2013; Emanuelle et al., 2015). In Arabidopsis (Arabidopsis thaliana), the catalytic α-subunit is represented by two isoforms, SnRK1α1 (AKIN10; At3g01090) and SnRK1α2 (AKIN11; At3g29160), both of which appear to be expressed ubiquitously, although KIN10 accounts for the majority of SnRK1 activity (Jossier et al., 2009). Activation of SnRK1 involves the phosphorylation/dephosphorylation of a T-loop Thr (Thr-172 of Arabidopsis SnRK1.1α) involving the upstream kinases SnAK1/2 (Baena-González et al., 2007; Polge and Thomas, 2007; Crozet et al., 2014). In contrast to SNF1 and AMPK, the intimate connection between T-loop phosphorylation in response to energy deprivation and kinase activation is not established in plants, indicating the involvement of additional regulatory mechanisms. For instance, several sugar phosphates, most notably trehalose-6-phosphate (T6P), appear to have a prominent role in the regulation of SnRK1 kinase activity. T6P inhibits SnRK1 in physiological amounts (1–100 µm) as well as in a tissue- and developmental stage-specific manner (Zhang et al., 2009; Debast et al., 2011; Martínez-Barajas et al., 2011). Glc-1-P and Glc-6-P also inhibit SnRK1 from Arabidopsis seedlings, and, strikingly, T6P and Glc-1-P inhibit the kinase synergistically (Nunes et al., 2013). Apart from being regulated by sugar signals, SnRK1 also responds to hormonal signals, in particular to abscisic acid, possibly linking hormone and sugar signaling pathways (Radchuk et al., 2006, 2010; Jossier et al., 2009; Coello et al., 2012; Tsai and Gazzarrini, 2012; Rodrigues et al., 2013). Beyond metabolic readjustment, SnRK1 coordinates the responses to a wide array of abiotic stresses, such as flooding, sudden darkness, and salinity (Baena-González et al., 2007; Lee et al., 2009; Cho et al., 2012). A possible role of SnRK1 signaling in response to biotic stresses is far less well established, although available evidence suggests that SnRK1 plays a key role in the interaction of the plant with a range of pathogens and pests (for review, see Hulsmans et al., 2016). Plants cope with pathogen attack by using mechanisms of resistance that rely on preformed protective defenses and on inducible defenses. The latter represent a significant investment of energy resources (e.g. in the form of reducing equivalents and carbon skeletons) that would otherwise be utilized for growth and development (Bolton, 2009). Thus, SnRK1-mediated growth limitation in response to stress could potentially be involved in resource allocation during induced defense, resulting in the prioritization of immunity over growth.
The downstream events of SnRK1 activation include the direct phosphorylation of several central biosynthetic enzymes, such has HMG-CoA reductase, sucrose phosphate synthase (SPS), and nitrate reductase, to reduce their activity (Halford and Hey, 2009), as well as large-scale transcriptional reprogramming (Baena-González et al., 2007). Transient overexpression of KIN10 in Arabidopsis protoplasts resulted in a transcriptional profile reminiscent of various starvation conditions and led to the identification of approximately 1,000 putative SnRK1 target genes (Baena-González et al., 2007). In general, SnRK1-mediated transcriptional reprogramming results in the down-regulation of energy-consuming processes and the induction of catabolic pathways to provide alternative energy sources. Although the broad effect on transcription and the specificity that is required to respond to a particular stress are likely to require modulation of a range of different downstream target proteins, only a few transcription factors representing potential direct SnRK1 substrates have been identified (Kleinow et al., 2009; Tsai and Gazzarrini, 2012; Jeong et al., 2015; O’Brien et al., 2015; Zhai et al., 2017). Recently, Mair et al. (2015) identified the Arabidopsis transcription factor bZIP63 as a key regulator of the starvation response and a direct target of the SnRK1 kinase. Phosphorylation of bZIP63 by SnRK1 was shown to change its dimerization preference, thereby affecting target gene expression and, ultimately, primary metabolism (Mair et al., 2015).
In previous work, we established an Arabidopsis protein-protein interaction network around the two catalytic SnRK1 α-subunits, KIN10 and KIN11, that contains indirect and direct interactions of SnRK1 with a range of transcriptional regulators (Nietzsche et al., 2014, 2016). One protein found to interact with both SnRK1 α-subunits in yeast was STOREKEEPER RELATED1 (STKR1), also known as GL1 enhancer binding protein (GeBP; At4g00270.1; Curaba et al., 2003). STKR1/GeBP together with three GeBP-like (GPL) genes belong to a small gene family encoding noncanonical Leu zipper transcription factors with redundant roles in the indirect regulation of some cytokinin response genes in Arabidopsis (Chevalier et al., 2008) and that also might be involved in the transcriptional regulation of certain stress responses (Perazza et al., 2011). A STOREKEEPER protein has been described to regulate Suc-inducible expression of patatin in potato (Solanum tuberosum) tubers, suggesting that this family of transcriptional regulators also could be involved in relaying metabolic signals to adjust gene expression (Zourelidou et al., 2002).
In this study, the interaction between SnRK1 and STKR1 was further investigated on the biochemical and molecular levels. We also generated transgenic Arabidopsis plants overexpressing STKR1, which showed reduced growth and delayed senescence. Metabolite analyses revealed reductions of Suc and starch especially during the dark phase and an increase in free amino acids. Transcriptional profiling showed that STKR1-overexpressing lines displayed a constitutive systemic acquired resistance (SAR) response. A possible connection between STKR1 function, SnRK1 signaling, and plant defense is discussed.
RESULTS
STKR1 and SnRK1 Interact inside the Plant Cell Nucleus
We have shown previously that the Arabidopsis STKR1 protein binds to the two SnRK1 α-subunits, AKIN10 and AKIN11, in the yeast two-hybrid system (Nietzsche et al., 2014). In order to investigate whether this interaction also occurs in planta, a bimolecular fluorescence complementation (BiFC) experiment was conducted in which either AKIN10 or AKIN11 was fused to the N-terminal 173 amino acids of the Venus protein and coexpressed together with STKR1 fused to the C-terminal 155 residues of Venus in leaves of Nicotiana benthamiana. Interaction of the AKINs with STKR1 can be visualized by the reconstitution of Venus fluorescence. As shown in Figure 1A, coexpression of STKR1 with either of the two SnRK1 α-subunits resulted in a fluorescence signal within the plant cell nucleus that was enriched in punctate structures. This result confirms the interaction of the two proteins in planta and suggests that both proteins bind each other inside the nucleus. Coexpression of AKIN10-VenusN or KIN11-VenusN with FBPase-VenusC and coexpression of STKR1-VenusC with FBPase-VenusN induced a considerably weaker or no fluorescence signal at all, indicating that the AKIN-STKR1 interaction is specific (Supplemental Fig. S1). To further corroborate the results of the BiFC experiment, coimmunoprecipitation was used to confirm the STKR1-KIN10 interaction in planta. To this end, GFP-STKR1 was transiently coexpressed with AKIN10-HA (hemagglutinin) in N. benthamiana. Two days after Agrobacterium tumefaciens infiltration, GFP-STKR1 was pulled down using GFP-trap beads, and the eluates were analyzed by immunoblot with anti-GFP and anti-HA antibodies. GFP-STKR1 was able to pull down AKIN10-HA, verifying the interaction of both proteins in planta (Fig. 1B). STKR1/GeBP has been proposed to act as a transcriptional regulator, and a YFP-STKR1/GeBP fusion protein was shown to localize to nuclei (Curaba et al., 2003). In line with these previous observations, a STKR1-GFP fusion protein produced a fluorescence signal inside nuclei when transiently expressed in leaves of N. benthamiana (Fig. 1C). Also in this case, the fluorescence signal was not distributed evenly throughout the nucleus but was concentrated in larger granules that appear to reside inside the nucleus as well as in smaller puncta, which are smaller and densely distributed in the nuclear envelope, potentially resembling nuclear pores.

Interaction of KIN10/11 with STKR1 and subcellular localization of STKR1 in planta. A, Visualization of protein interactions in planta by the BiFC assay. YFP confocal microscopy images show tobacco leaf epidermal cells transiently expressing constructs encoding the fusion proteins indicated. DIC, Differential interference contrast. Bars = 20 µm. B, Coimmunoprecipitation of GFP-STKR1 with KIN10-HA. Both proteins were transiently coexpressed in leaves of N. benthamiana using A. tumefaciens infiltration. After 48 h, total proteins (Input) were subjected to immunoprecipitation (Eluat) with GFP-trap beads followed by immunoblot analysis using either anti-GFP or anti-HA antibodies. C, Subcellular localization of GFP-STKR1 in N. benthamiana leaves transiently transformed by A. tumefaciens infiltration. Bars = 20 µm.
STKR1 Binds SnRK1 via Its N Terminus
To further dissect the STKR1-KIN10 interaction on the molecular level, a series of deletion constructs of both proteins was produced and tested for their interaction in yeast. First, it was investigated whether the STKR1-KIN interaction involves the SnRK1 catalytic domain (CD; amino acids 1–289) or regulatory domain (RD; amino acids 294–495). The CD contains the activation loop (T-loop), while the RD binds the β- and βγ-subunits as well as upstream kinases and phosphatases and harbors a ubiquitin-associated domain that was proposed to mediate the interaction with ubiquitinated proteins (Crozet et al., 2014). Direct interaction assays in yeast revealed that neither the CD nor the RD by itself was sufficient to mediate binding to STKR1, indicating that both domains play a role in the SnRK1-STKR1 interaction (Supplemental Fig. S2). Next, we analyzed which part of the STKR1 protein was required for its interaction with SnRK1. To this end, a series of N-terminal STKR1 deletions was tested for their ability to bind AKIN10 in yeast. As shown in Figure 2A, deletion of 63 amino acids from the N terminus still enabled STKR1 binding to KIN10, although the interaction appeared to be weaker, while the binding was abolished upon deletion of the 171 N-terminal amino acids (Fig. 2A). This indicates that the STKR1 N terminus is required for its interaction with the SnRK1 α-subunits.
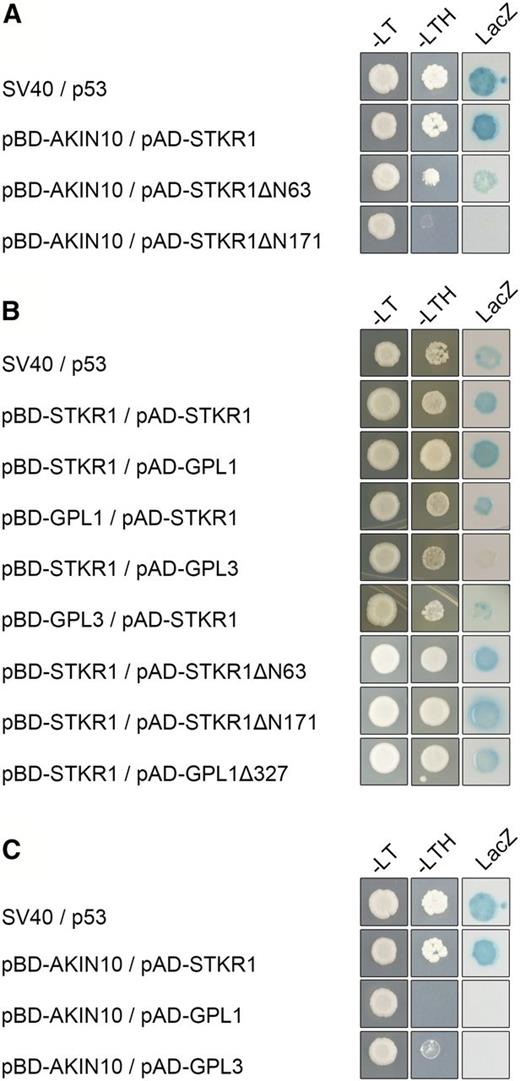
Interaction of STKR1 with its binding partners in the yeast two-hybrid assay. Cells were grown on selective medium before a lacZ filter assay was performed. SV40 and p53 served as positive controls. –LT, Yeast growth on medium without Leu and Trp; –HTL, yeast growth on medium lacking His, Leu, and Trp, indicating expression of the HIS3 reporter gene; LacZ, activity of the lacZ reporter gene. A, KIN10 requires the N terminus of STKR1 for interaction. Full-length and N-terminal deletions of STKR1 fused to the GAL4 activation domain (AD) were individually cotransformed with AKIN10 fused to the GAL4 DNA-binding domain (BD) and tested for reporter gene activation. B, STKR1 homomerizes and heteromerizes with GPL1 and GPL3 via the C terminus. The self-interaction of STKR1 and the heteromerization of STKR1 with GPL1 and GPL3 and various N-terminal deletion constructs were assayed by direct Y2H assays. C, AKIN10 does not interact with GPL1 and GPL3 in direct Y2H assays.
Previous studies have shown that STKR1/GeBP and its close homologs GPL1, GPL2, and GPL3 belong to a plant-specific family of transcription factors that form homodimers and heterodimers through their noncanonical Leu zipper motif located at the C terminus of the proteins (Chevalier et al., 2008). A direct interaction assay confirmed that STKR1 forms homodimers and heteromerizes with the GPL proteins via its C-terminal part (Fig. 2B), indicating that dimerization and SnRK1 interaction are mediated by different domains of the protein. Because STKR1/GeBP and GPL proteins have been proposed to act redundantly (Chevalier et al., 2008), we tested the ability of GPL1 and GPL3 to interact with SnRK1 in yeast. The data revealed that these proteins did not bind to the SnRK1 α-subunits, suggesting a specific functional relationship of STKR1 with SnRK1 (Fig. 2C).
STKR1 Is a Short-Lived Protein
We observed that coexpression of STKR1-HA and AKIN10-GFP in leaves of N. benthamiana consistently led to a stronger STKR1-HA signal on western blots than in the case of STKR1-HA expression alone (Fig. 3A). This suggests that KIN10 could potentially affect STKR1 protein stability by preventing its degradation. Many short-lived regulatory proteins undergo regulated protein degradation through the ubiquitin-proteasome pathway (Vierstra, 2009). In order to investigate whether STKR1 undergoes proteasomal turnover, we followed its stability in cell-free extracts over time either in the presence or absence of the proteasome inhibitor MG132. As shown in Figure 3B, the STKR1-HA signal vanished within 1 h after extraction from transiently expressing N. benthamiana leaves, while the signal was reduced only slightly in extracts treated with MG132 at the same time point. Nevertheless, after 3 h of incubation, the STKR1-HA signal disappeared in both extracts, as did Rubisco, which served as a loading control (Fig. 3B). A similar trend was observed when STKR1 protein stability was analyzed in transgenic Arabidopsis lines carrying an HA-tagged STKR1 version expressed under the control of the cauliflower mosaic virus (CaMV) 35S promotor (see below). In total extracts of these plants, the STKR1-HA signal vanished within 1 h of incubation but was stabilized in the presence of MG132 (Fig. 3C). Taken together, these data suggest that STKR1 could be a short-lived protein whose turnover is attenuated in the presence of the proteasome inhibitor MG132 and potentially also by coexpression with KIN10.
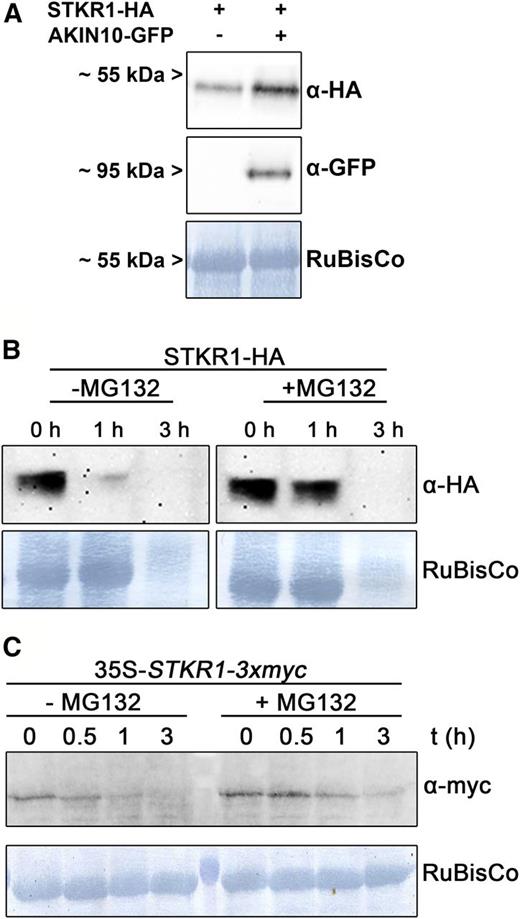
Transient coexpression of STKR1 with AKIN10 or inhibition of the proteasome stabilizes STKR1 protein levels. A, STKR1-HA was transiently expressed in leaves of N. benthamiana either alone or together with AKIN10-GFP. After 48 h, total leaf extracts were subjected to western blotting using the antibodies indicated. Staining of Rubisco served as a loading control. B, A total leaf extract prepared from leaves of N. benthamiana transiently expressing STKR1-HA was incubated at room temperature either in the absence or presence of the proteasome inhibitor MG132. At the time points indicated, aliquots were removed and subjected to western blotting using an anti HA-antibody to monitor protein fate. Staining of the Rubisco band served as a control. C, Total protein extracts were prepared from transgenic Arabidopsis plants expressing a myc-tagged version of STKR1 under the control of the CaMV 35S promoter and incubated at room temperature either in the absence or presence of the proteasome inhibitor MG132. In aliquots removed at the indicated time points, STKR1 protein stability under both conditions was assessed using an anti-myc antibody.
Transiently Expressed STKR1 Is a Phosphoprotein in Planta But Is Not Phosphorylated by KIN10 in Vitro
The interaction of STKR1 with the SnRK1 α-subunits suggests that STKR1 could be phosphorylated by SnRK1 to modulate its function. Analysis of the STKR1 protein sequence suggests the presence of at least one potential SNF1/AMPK/SnRK1 phosphorylation site at Ser-27 (LSHRRpSPRNI; pS indicates the phosphorylated Ser residue at position 27) that resembles the minimal recognition motif Hyd-(Basic/X)-X3-Ser/Thr-X3-Hyd, where Hyd indicates the hydrophobic residues Met, Leu, Val, Phe, or Ile (Halford and Hardie, 1998). In addition, a survey of publicly available phosphorylation data (PhosPhAt 4.0; http://phosphat.uni-hohenheim.de/) revealed two phosphorylated STKR1 peptides that have been identified repeatedly in independent proteomic studies. These comprise the Ser residues at positions 39 and 184, respectively (Supplemental Fig. S3).
To test whether STKR1 is a substrate of AKIN10, we immunoprecipitated KIN10 from plants overexpressing an HA-tagged version (35S:SnRK1.1-HA; Baena-González et al., 2007) and used the precipitate for an in vitro phosphorylation assay with Escherichia coli-produced MBP-STKR1 as a potential substrate. However, although the immunopurified KIN10-HA was active in this assay, as suggested by the strong phosphorylation of the generic SnRK1 substrate MBP-SAMS, there was no phosphorylated MBP-STKR1 detectable (Fig. 4A). Thus, at least under the assay conditions applied, MBP-STKR1 does not seem to constitute a SnRK1 phosphorylation substrate in vitro.
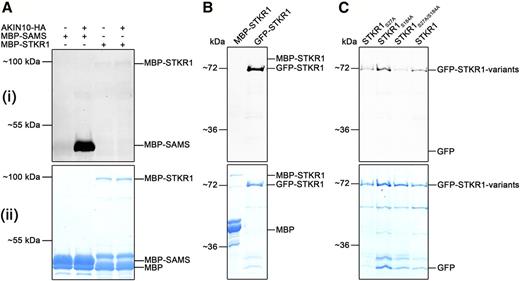
STKR1 is not phosphorylated by AKIN10 in vitro but is a phosphoprotein in planta. A, Pro-Q Diamond (Pro-Q) phosphostaining, to selectively stain for phosphorylated proteins, of SnRK1-HA immunopurified from dark-incubated transgenic Arabidopsis plants incubated without and with recombinant MBP-STKR1 in vitro. Recombinant MBP-SAMS served as a positive control for SnRK1 phosphorylation (i). Coomassie Blue staining was used for protein visualization (ii). B, Pro-Q staining of affinity-purified GFP-STKR1 transiently expressed in leaves of N. benthamiana indicates STKR1 phosphorylation in planta. E. coli-produced MBP-STKR1 does not produce a signal (i). Proteins were visualized by Coomassie Blue staining (ii). C, GFP-STKR1 variants carrying substitutions in predicted SnRK1 phosphorylation sites were transiently expressed in N. benthamiana, purified using a GFP-trap, and subjected to Pro-Q diamond staining (i). Proteins were visualized by Coomassie Blue staining (ii).
In order to analyze the phosphorylation state of plant-expressed STKR1, the GFP-tagged protein was pulled down from N. benthamiana leaf extracts and, after gel electrophoresis, subjected to a fluorescence staining selective for phosphorylated proteins. As shown in Figure 4B, plant-expressed GFP-STKR1 produced a strong signal indicative of phosphorylation of the protein, while an E. coli-produced MBP-STKR1 yielded no band. This finding supports the notion that transiently expressed GFP-STKR1 is phosphorylated by a kinase in the plant. To obtain the first hints about the phosphorylation sites in STKR1, Ala substitution variants at Ser-27 (S27A) or at Ser-184 (S184A) and a combination of both (S27/184A) were produced in plants, purified, and subjected to in gel phosphostaining. As indicated by Coomassie Blue staining, similar amounts of protein could be recovered for all protein variants; however, the phosphorylation-specific staining signal was considerably reduced in the case of the S27A variant and the S27/184A double mutant, while substitution of Ser-184 alone had no obvious effect on the phosphorylation state of the protein (Fig. 4C). This suggests that Ser-27, which is located within the SnRK1 consensus phosphorylation site, is required for in planta STKR1 phosphorylation by an endogenous protein kinase.
Overexpression of STKR1 in Arabidopsis Affects Plant Growth and Development
To address the role of STKR1 in vegetative growth and development, we generated transgenic Arabidopsis lines overexpressing a myc-tagged STKR1 version under the control of the constitutive CaMV 35S promoter. Three independent homozygous lines of the T3 generation were analyzed by western blotting (Supplemental Fig. S4) and used for subsequent analyses. In addition, a SALK T-DNA line (SALK_115723C), carrying an insertion in the second exon of the STKR1 genomic locus 593 nucleotides downstream of the start codon, was characterized by PCR on genomic DNA (Supplemental Fig. S4). Reverse transcriptase PCR analysis revealed a reduction in STKR1 transcript abundance in fully expanded stkr1-1 mutant leaves relative to leaves of equivalently aged wild-type plants (Supplemental Fig. S4).
The phenotype of 35S-STKR1 lines and the stkr1-1 mutant relative to the wild-type control plants was investigated throughout plant development. Under short-day conditions, 1-week-old plants from all genotypes were of similar size; however, after 2 weeks, a reduction in growth of the 35S-STKR1 lines relative to the wild-type control became apparent that increased over time (Fig. 5A), and a reduction of rosette diameter of about 40% relative to the control was observed in 35S-STKR1 lines 1 and 5 after 6 weeks of cultivation, while the rosette diameter of stkr1-1 plants increased slightly as compared with the control (Fig. 5, A and B). The reduced growth of 35S-STKR1 lines was accompanied by a significantly reduced number of leaves relative to the control as well as to stkr1-1 plants (Fig. 5C). When grown under long-day conditions, the appearance of flower buds in 35S-STKR1 plants was approximately 7 d later than in wild-type plants (Supplemental Fig. S5), whereas stkr1-1 plants bolted 5 to 7 d earlier than the control.
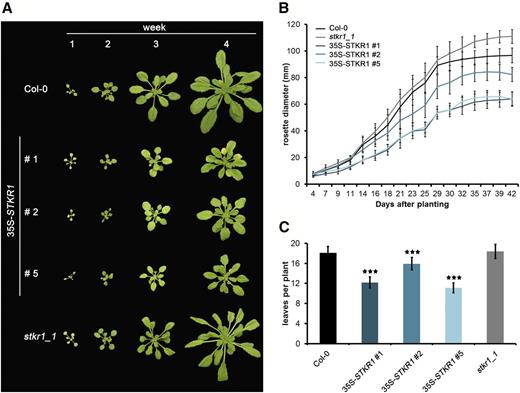
Constitutive overexpression of STKR1 reduces plant growth. A, 35S-STKR1 lines 1, 2, and 5 were grown in short-day conditions (8 h of light/16 h of dark) on soil alongside stkr1-1 knockout mutant plants and Columbia-0 (Col-0) as the wild-type control. Photographs were taken every week over a period of 4 weeks. B, Rosette diameter of 35S-STKR1 plants and the stkr1-1 mutant compared with Col-0 as a proxy for plant growth on soil under short-day conditions (8 h of light/16 h of dark). Each value is the mean ± sd of at least three measurements. C, Number of leaves in plants with altered STKR1 expression as compared with the wild type. Leaves were counted 4 weeks after sowing. Asterisks indicate significant differences according to Student’s t test (P < 0.001). Bars represent means ± se ( n = 15).
Overexpression of STKR1 Delays Senescence
When kept under short-day conditions for a period of 8 weeks, leaves of Arabidopsis wild-type plants as well as of the stkr1-1 mutant showed the red-purple coloration typical for the accumulation of anthocyanins. In contrast, all three STKR1-overexpressing lines showed no visible signs of anthocyanin accumulation in their leaves. In addition, 35S-STKR1 plants contained less chlorophyll during early development but remained green longer. However, chlorotic regions appeared around the edges of the leaves (Fig. 6A). We next analyzed the relative anthocyanin content in the three 35S-STKR1 lines using spectrophotometric methods. Compared with wild-type as well as with stkr1-1 plants, the total anthocyanin content was reduced by more than 90% in the STKR1-overexpressing lines as compared with the control (Fig. 6B). No difference in total anthocyanin content was observed between wild-type and stkr1-1 plants. In accordance with a reduced accumulation of anthocyanins in 35S-STKR1 lines, the mRNA level of PRODUCTION OF ANTHOCYANIN PIGMENTS1 (PAP1 [also called AtMYB75]; At1g56650), one of the two positive transcriptional regulators of anthocyanin synthesis (Borevitz et al., 2000), was reduced to 10% to 20% of the wild-type level, while no significant change in PAP1 expression was observed in stkr1-1 plants (Fig. 6C). The expression of the late senescence marker gene SAG12 (At5g45890) was reduced strongly in 35S-STKR1 lines 2 and 5 relative to the control (Fig. 6D). Similarly, expression of the Gln synthetase gene GLN1;4, which is typically enhanced during developmental senescence in order to mediate nitrogen remobilization, was reduced strongly in all three transgenic lines relative to the control (Fig. 6E). Thus, the gene expression analyses confirm the delayed-senescence phenotype of STKR1 overexpression lines on the molecular level.
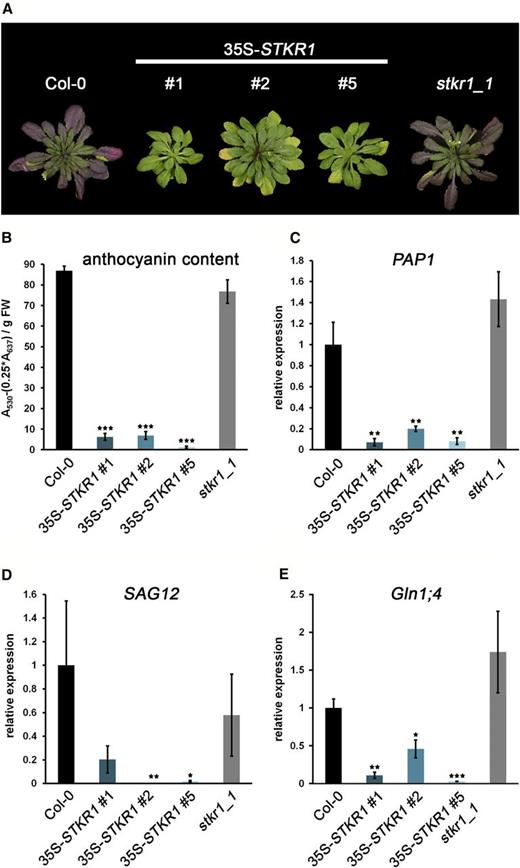
35S-STKR1 plants display reduced anthocyanin accumulation and delayed senescence. A, Phenotypes of STKR1-overexpressing plants compared with the stkr1-1 knockout as well as Col-0. The photograph was taken after growing the plants for 8 weeks in short-day conditions (8 h of light/16 h of dark). B, Anthocyanin content in 8-week-old 35S-STKR1 plants compared with stkr1-1 and control plants. Bars represent means ± se ( n = 5). Significant differences were calculated according to Student’s t test and are indicated by ***, P < 0.001. FW, Fresh weight. C, PAP1 mRNA levels were quantified by qRT-PCR in 8-week-old plants. UBC9 (for ubiquitin carrier protein) was used as a reference gene. Similar results were obtained in three independent experiments. Each bar represents the mean of three biological replicates ± sd. Significant changes in fold expression according to Student’s t test are indicated by **, P < 0.01. D and E, Expression of senescence marker genes is reduced in 35S-STKR1 plants. UBC9 was used as a reference gene. Similar results were obtained in three independent experiments. Each bar represents the mean of three biological replicates ± sd. Significant changes in fold expression according to Student’s t test are indicated by *, P < 0.01; **, P < 0.01; and ***, P < 0.001.
Senescence also can be induced by darkness, and keeping detached leaves in the dark has been shown to induce rapid and synchronous senescence following similar transcriptional programs to developmental senescence or dark-induced senescence of attached leaves (van der Graaff et al., 2006). However, it should be noted that leaf detachment also affects the expression of a subset of wounding-related genes, indicating that other physiological processes also are induced by this treatment (van der Graaff et al., 2006). In order to monitor senescence-related processes over time, detached leaves from 3-week-old soil-grown plants of 35S-STKR1 lines along with stkr1-1 leaves and the wild-type control were subjected to dark treatment for 12 d on moist filter paper. Leaves from the wild type as well as those sampled from the STKR1 overexpression lines displayed a similar time course of yellowing with only residual areas of green leaf coloration after 12 d in the dark (Supplemental Fig. S6). In contrast, leaves from stkr1-1 plants turned yellow faster and lost their green coloration almost completely already after 10 d in darkness (Supplemental Fig. S6). Taken together, these data indicate that overexpression of STKR1 delays the induction of age-induced senescence while a loss of STKR1 in the stkr1-1 mutant line leads to a faster progression of leaf senescence in the dark.
Metabolite Changes in STKR1 Overexpression Lines
Several studies suggest that sugar levels and sugar signaling play prominent roles in the initiation and/or acceleration of leaf senescence (Wingler et al., 2009). In order to determine if the phenotypic changes in 35S-STKR1 plants are associated with altered levels of nonstructural carbohydrates, levels of Glc, Fru, Suc, and starch were measured in short-day-grown plants either at the end of the light period or at the end of the dark period and compared with those in stkr1-1 plants or in the wild-type control. At the end of the light period, soluble sugars such as Glc, Fru, and Suc were reduced significantly in 35S-STKR1 lines as well as in stkr1-1 plants as compared with the wild type, while starch contents in leaves from all genotypes investigated were not altered significantly (Table I). Toward the end of the dark period, Glc levels were increased significantly in 35S-STKR1 lines 1 and 5 relative to the control, while Fru levels were reduced significantly in line 1 of the STKR1-overexpressing plants as well as in stkr1-1 (Table I). The degradation of leaf starch reserves at night occurs at an essentially linear rate to provide a constant supply of Suc, and almost all of the reserves are used up at dawn, when photosynthesis can resume again (Smith and Stitt, 2007). When compared with the end of the light period, wild-type and stkr1-1 plants have mobilized approximately 90% of their starch reserves at the end of the night (Table I). Although 35S-STKR1 plants contain comparable amounts of starch toward the end of the day, starch degradation appears to occur at a higher rate than in wild-type plants, as suggested by a 4- to 7-fold reduction in residual starch content at the end of the dark period (Table I). Notably, Suc levels at the end of the night were decreased by approximately 90% in all three 35S-STKR1 lines (Table I). Taken together, the reduction in starch and Suc in STKR1-overexpressing lines toward the end of the night indicates altered rates of starch degradation in these plants that could be brought about by an imbalance in carbon use during the dark.
Changes in carbohydrate contents in leaf material harvested from the different SPS knockout genotypes compared with the Col-0 wild-type control
Plants were 6 weeks old (4–5 weeks in soil). Values represent means ± sd of at least four independent samples. Samples were taken at the end of the 8-h light period (EL) and at the end of the 16-h dark period (ED). Each set of samples has its corresponding wild type. Asterisks indicate significant differences from Col-0 according to Student’s t test: *, P < 0.05; **, P < 0.01; and ***, P < 0.001.
| Plant Line | Glc | Fru | Suc | Starch |
|---|---|---|---|---|
| µmol g−1 fresh wt | ||||
| Col-0 / EL | 6.43 ± 0.20 | 4.84 ± 0.21 | 1.68 ± 0.14 | 78.12 ± 1.89 |
| 35S-STKR1#1 / EL | 5.15 ± 0.43* | 3.68 ± 0.19* | 0.91 ± 0.12** | 81.90 ± 4.99 |
| 35S-STKR1#2 / EL | 3.77 ± 0.40** | 3.05 ± 0.47* | 1.07 ± 0.18* | 70.21 ± 3.65 |
| 35S-STKR1#5 / EL | 4.13 ± 0.36** | 2.79 ± 0.26*** | 0.57 ± 0.02** | 74.98 ± 3.85 |
| stkr1-1 / EL | 3.33 ± 0.20*** | 2.00 ± 0.14*** | 0.79 ± 0.07** | 79.26 ± 2.34 |
| Col-0 / ED | 0.89 ± 0.06 | 0.35 ± 0.05 | 0.5 ± 0.05 | 3.72 ± 0.48 |
| 35S-STKR1#1 / ED | 1.90 ± 0.08*** | 0.16 ± 0.01* | 0.02 ± 0.00** | 0.93 ± 0.10** |
| 35S-STKR1#2 / ED | 0.77 ± 0.10 | 0.15 ± 0.08 | 0.05 ± 0.01** | 0.36 ± 0.12** |
| 35S-STKR1#5 / ED | 1.21 ± 0.10* | 0.19 ± 0.05 | 0.04 ± 0.01** | 0.47 ± 0.06* |
| stkr1-1 / ED | 0.88 ± 0.24 | 0.18 ± 0.02* | 0.45 ± 0.06 | 3.44 ± 0.80 |
In order to investigate broader metabolic changes upon altered expression of STKR1, an established gas chromatography-mass spectrometry protocol (Lisec et al., 2011) was used to assess the alteration in primary metabolite content in leaves of transgenic plants as compared with the wild type as well as with the stkr1-1 mutant line. To this end, leaf tissue was harvested either 6 h into the light phase or after an extended dark period (16 + 6 h) to activate SnRK1 signaling and analyzed in triplicate. The results of these analyses are presented in the heat map of Figure 7. During the light period, 14 of the 70 measured metabolites were consistently and significantly different in leaves of all three 35S-STKR1 lines as compared with the control, while during the extended dark period, 17 compounds were consistently altered (Fig. 7; Supplemental Table S1). The measurement confirmed the strong reduction in Suc content during the dark period in the overexpressing lines and, additionally, revealed that a number of minor soluble carbohydrates and sugar alcohols, such as raffinose, trehalose, and galactinol, also were reduced upon STKR1 overexpression, although this reduction was irrespective of the light conditions. Overexpression of STKR1 seems to grossly affect the levels of amino acids, most of which show increases during the light as well as during the dark. However, in some cases, such as for Tyr, Ile, Val, and Leu, the increases were more pronounced during the light period than after extended darkness, while Asn followed the opposite trend. Others, such as Met, Gln, and Glu, were unaltered or decreased slightly during the light, but their levels in the transgenic lines increased during the extended dark. Gly increased slightly during the light but was strongly reduced in the dark. The measurement also revealed that the level of the phytohormone salicylic acid (SA) was elevated in 35S-STKR1 lines relative to the wild type in the light as well as during the dark (Fig. 7; Supplemental Table S1). The stkr1-1 mutant line showed fewer significant changes as compared with the control, with a general trend toward a reduction in measured metabolites that is opposite to what can be observed in the overexpression lines (Fig. 7).
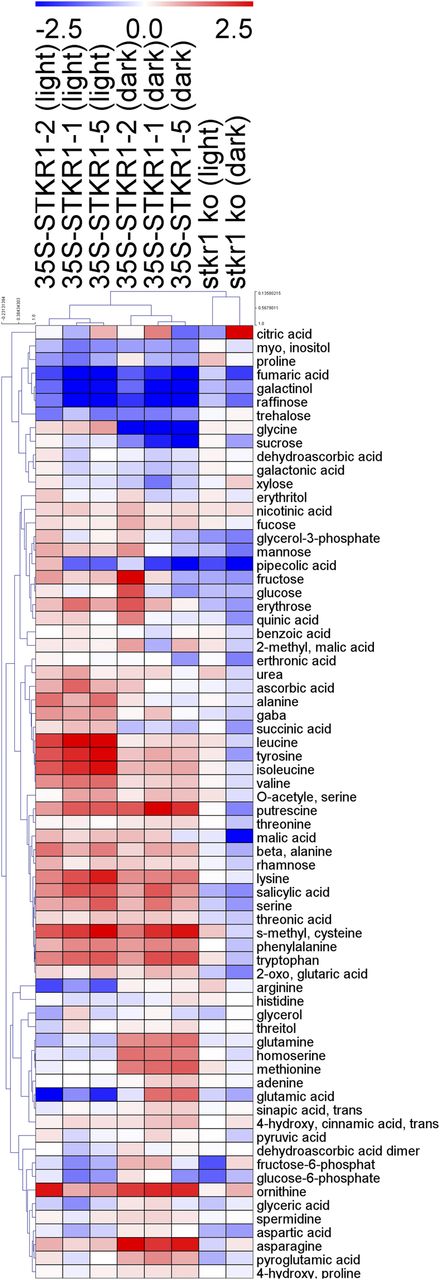
Heat map showing the metabolite changes in 35S-STKR1 lines as compared with stkr1-1 and Col-0 wild-type plants. Plants were grown for 4 weeks in soil under short-day conditions (8 h of light/16 h of dark), and leaves were harvested either 6 h after the onset of light or after a prolongation of the dark period for 6 h. Metabolite data were normalized by control (Col-0) at light and dark conditions. A negative score, depicted in blue, represents decreased levels, while a positive score (red color) shows increased levels. The depth of the color corresponds to the magnitude of the change in levels. The log2 fold change scale is indicated above the heat map. For details, see Supplemental Table S1.
SA is an important regulator of defense responses as well as of plant growth and development (Vlot et al., 2009; Rivas-San Vicente and Plasencia, 2011). In order to determine absolute changes in total SA in 35S-STKR1 plants, its levels were additionally quantified by liquid chromatography-mass spectrometry. This revealed a significant increase in total SA accumulation in the transgenic lines 35S-STKR1 lines 1 and 5 as compared with the wild-type or stkr1-1 plants (Fig. 8A). The measurement also showed that the synthesis of camalexin, one of the principal phytoalexins produced in Arabidopsis, was significantly induced upon STKR1 overexpression lines 35S-STKR1 lines 1 and 5 (Fig. 8B). Although 35S-STKR1 shows a tendency toward elevated SA and camalexin levels, the differences from the wild type are not statistically significant. This is in accordance with the somewhat intermediate phenotype of this transgenic line in terms of growth rate, rosette diameter, and leaf number. However, the weaker phenotype of 35S-STKR1 plants as compared with the other lines apparently does not correlate to the STKR1-3xmyc protein amount as detected by western blotting (Supplemental Fig. S4); thus, its cause is currently not clear.
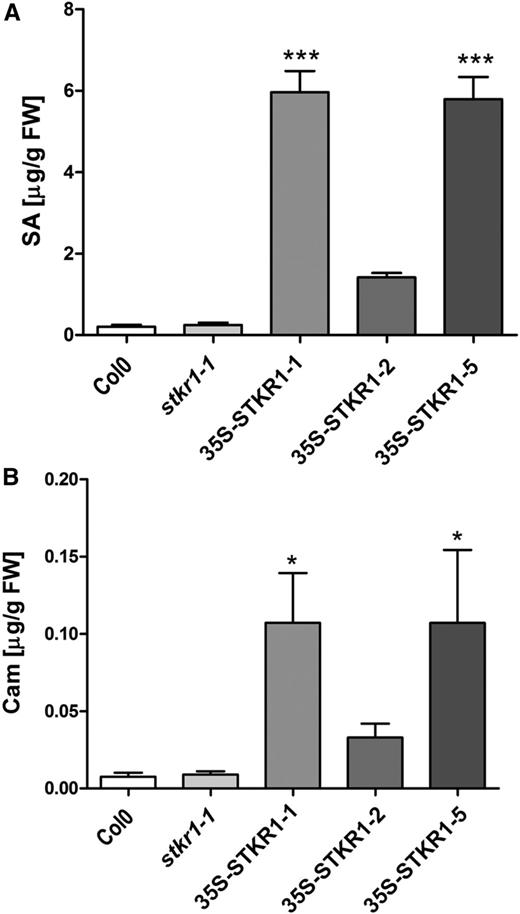
Changes in SA and camalexin levels in 35S-STKR1 lines. A, Total SA (free SA + glycosylated SA) levels were measured after 4 weeks of plant growth under short-day conditions (8 h of light/8 h of dark). Data represent means ± sd (n = 3). Significant differences are indicated by asterisks (***, P < 0.001) and were calculated using Student’s t test. FW, Fresh weight. B, Camalexin levels in 35S-STKR1 plants compared with stkr1-1 mutants and the Col-0 wild type in 4-week-old plants. Data represent means ± sd (n = 3). Significant differences are indicated by asterisks (*, P < 0.05) and were calculated using Student’s t test.
Overexpression of STKR1 in Arabidopsis Results in Large-Scale Transcriptional Reprograming
Driven by the hypothesis that STKR1 might be involved in the SnRK1 signaling pathway and that STKR1 overexpression might affect SnRK1 activity, selected SnRK1 marker genes from Arabidopsis for which expression is repressed or induced by SnRK1 (Baena-González et al., 2007) were analyzed by quantitative real-time (qRT)-PCR. Samples for gene expression analysis were taken either 6 h after the onset of the light period, when SnRK1 signaling should be switched off, or after extension of the dark period for 6 h, which leads to the activation of SnRK1 signaling (Baena-González, 2010). SnRK1 maker genes ASN1, TPS8, TPS10, and AKINβ1, normally up-regulated by SnRK1, showed no consistent differences between the control and plants with altered STKR1 expression at both time points investigated (Supplemental Fig. S7). As expected, a clear induction of the marker genes in all plants investigated was observed after prolongation of the dark period, indicative of a functional SnRK1 signaling pathway. The SnRK1 marker gene UGD2, normally down-regulated by SnRK1, was slightly but significantly more repressed in 35S-STKR1 lines 1 and 5 as compared with the wild type (Supplemental Fig. S7). These results indicate that SnRK1-mediated transcriptional reprogramming during a prolonged darkness period, in principle, also operates in STKR1-overexpressing lines.
To further identify transcriptional changes in 35S-STKR1 plants that could aid in interpreting the observed phenotypic and metabolic changes, we carried out a global transcriptional profiling using microarrays. To this end, leaves were sampled from the three transgenic lines as well as from the wild type either 6 h into the light period or after an extended dark period to activate SnRK1 signaling. Microarray data were filtered using Student’s t test with Benjamini and Hochberg multiple test correction (P < 0.05) and a 2-fold change cutoff to mark significant changes in gene expression. We first compared the expression profile of wild-type plants in the light and after the extended dark period in order to confirm that the experimental setup is suitable for the analysis of SnRK1-mediated transcriptional changes. The analysis revealed that, during the extended dark period, the expression of 3,611 genes was significantly induced while 5,068 genes were significantly down-regulated (Supplemental Table S2). Among the genes showing significant differential expression during the dark period as compared with the light, 562 overlapped with the established set of SnRK1-induced genes (Baena-González et al., 2007; Supplemental Table S2). This indicates that the prolonged dark treatment is sufficient to trigger SnRK1 signaling.
The analysis of differential gene expression in 35S-STKR1 lines after a prolonged dark period as compared with the light period revealed 8,453 differentially expressed genes (DEGs), which is comparable with the number of DEGs found in the wild type under the same conditions. Of these, 3,498 were significantly induced in the dark as compared with the light, while 4,955 were reduced (Supplemental Table S3). A comparison with the SnRK1 marker gene set revealed an overlap of 642 SnRK1-responsive genes also to be regulated in 35S-STKR1 plants. In summary, in accordance with the previous quantitative PCR data, the transcriptome analysis suggests that, upon prolonged dark treatment, SnRK1 signaling is functional in 35S-STKR1 plants.
Next, the differential gene expression between wild-type and 35S-STKR1 plants was analyzed. During the light period, 475 genes were significantly differentially expressed consistently in all three transgenic lines relative to the wild type (Supplemental Table S4). Of these, 129 showed an induction and 346 were down-regulated. The comparison of wild-type and STKR1-overexpressing plants subjected to an extended dark period revealed much larger transcriptional differences, with 3,780 DEGs, including 1,987 up-regulated and 1,793 down-regulated genes (Supplemental Table S5). A comparison of the 3,780 DEGs with the established SnRK1 target genes revealed very little overlap (171 genes; Supplemental Table S5). Thus, we performed a Gene Ontology term enrichment analysis to identify those functions, processes, and cellular components that are associated with DEGs in the transgenic plants (www.pantherdb.org). This revealed a significant overrepresentation of categories related to plant defense, such as SAR (3.4-fold enrichment), response to SA (2.9-fold enrichment), and others, as well as categories including transcription factor genes such as DNA-dependent DNA replication (3.6-fold enrichment; Fig. 9A; Supplemental Table S6). The DEGs in 35S-STKR1 plants associated with the category SAR included key regulators and output genes of SAR, such as PATHOGENESIS RELATED1 (PR1), FLAVIN-CONTAINING MONOOXYGENASE1, and AGD2-LIKE DEFENSE RESPONSE PROTEIN1 (Návarová et al., 2012; Fig. 9B). The strong induction of these critical SAR pathway components in 35S-STKR1 plants could be confirmed by qRT-PCR in an independent set of samples (Supplemental Fig. S8), indicating that these plants display a constitutively activated SAR response.
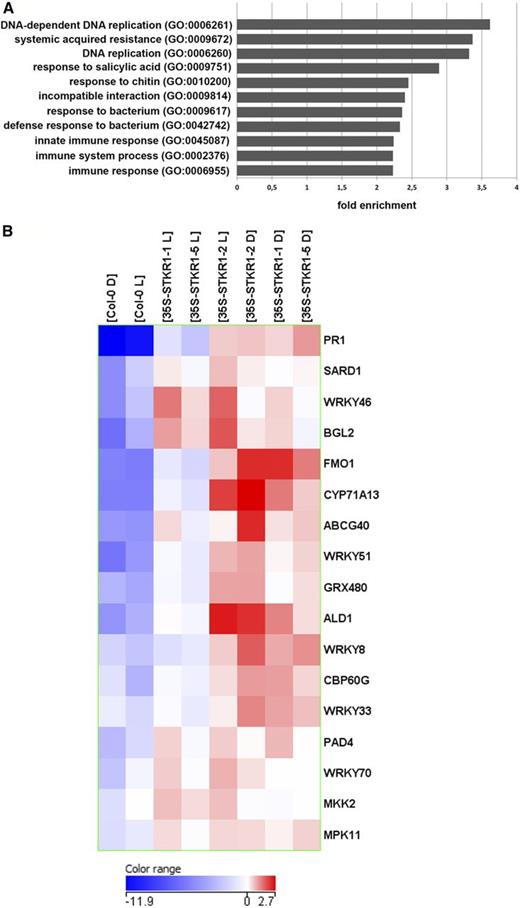
Overexpression of STKR1 in Arabidopsis leads to constitutive defense gene expression. A, Functional categories at least 2-fold overrepresented in the entire set of DEGs in 35S-STKR1 Arabidopsis lines after extended dark as determined by the panther tool (www.pantherdb.org). For details, see Supplemental Table S6. B, Heat map showing transcriptional changes of SAR-related genes in 35S-STKR1 transgenic Arabidopsis lines. Normalized (log2) expression values of selected transcripts were clustered using the Euclidean similarity matrix and Ward linkage rule by means of GeneSpring GX 12.5 tools.
Another group of genes that are up-regulated in STKR1-overexpressing plants encode for members of the WRKY and NAC (for NAM, ATAF1,2, and CUC2) families of transcription factors (Table II). Members of these plant-specific transcription factor families have been implicated in biotic and abiotic stress responses as well as in the regulation of developmental programs such as senescence (Nuruzzaman et al., 2013; Bernsdorff et al., 2016; Kim et al., 2016; Phukan et al., 2016). The expression of a subset of differentially expressed WRKY and NAC genes was analyzed by qRT-PCR in an independent set of plants (Supplemental Fig. S9). This confirmed the up-regulation of these transcription factors in 35S-STKR1 transgenic Arabidopsis plants.
NAC and WRKY transcription factors significantly up-regulated in 35S-STKR1 transgenic Arabidopsis plants as compared with the wild-type control
| Gene Symbol | Arabidopsis Genome Initiative Code | Log2 Fold Change |
|---|---|---|
| NAC087 | At5g18720 | 6.43 |
| NAC003 | At1g02220 | 4.36 |
| NAC042 | At2g43000 | 4.15 |
| NAC019 | At1g52890 | 3.91 |
| NAC016 | At1g34180 | 3.84 |
| NAC048 | At3g04420 | 3.81 |
| NAC004 | At3g02230 | 2.92 |
| NAC047 | At3g04070 | 2.84 |
| NAC001 | At1g01010 | 2.25 |
| NTM1 | At4g01540 | 2.14 |
| NAC053 | At3g10500 | 2.09 |
| NAC046 | At3g04060 | 1.98 |
| ATAF2 | At5g08790 | 1.87 |
| NAC1 | At1g56010 | 1.86 |
| WRKY75 | At5g13080 | 6.28 |
| WRKY46 | At2g46400 | 5.62 |
| WRKY54 | At2g40750 | 5.33 |
| WRKY45 | At3g01970 | 3.71 |
| WRKY61 | At1g18860 | 3.60 |
| WRKY8 | At5g46350 | 3.38 |
| WRKY18 | At4g31800 | 3.28 |
| WRKY60 | At2g25000 | 3.09 |
| WRKY70 | At3g56400 | 2.99 |
| WRKY58 | At3g01080 | 2.76 |
| WRKY71 | At1g29860 | 2.71 |
| WRKY55 | At2g40740 | 2.43 |
| WRKY33 | At2g38470 | 1.89 |
| WRKY40 | At1g80840 | 1.88 |
| WRKY48 | At5g49520 | 1.40 |
| WRKY47 | At4g01720 | 1.17 |
Overexpression of STKR1 in Transgenic Arabidopsis Plants Results in Increased Resistance toward a Virulent Oomycete
The strong overrepresentation of genes associated with plant defense among the DEGs in 35S-STKR1 plants and the observation that SA levels also were increased prompted us to investigate whether the overexpression plants show altered resistance toward pathogens. To this end, we inoculated 35S-STKR1 plants as well as stkr1 plants with the virulent strain Noco2 of the obligate biotrophic oomycete Hyaloperonospora arabidopsidis (Hpa). Arabidopsis Col-0 eds1-2 plants have been shown previously to be more susceptible toward Hpa Noco2 (Bartsch et al., 2006), while snc1 plants are more resistant (Li et al., 2001); thus, these genotypes served as controls. The number of conidiospores as a proxy for disease severity was assessed at 5 d post inoculation. As shown in Figure 10, all three 35S-STKR1 lines displayed significant reductions in conidiospores per gram of leaf tissue and, thus, are more resistant than the Arabidopsis wild type, while stkr1 plants showed no difference in susceptibility toward Hpa Noco2 in multiple independent experiments. These results demonstrate that the constitutive defense response in STKR1 overexpression lines is functional against Hpa Noco2.
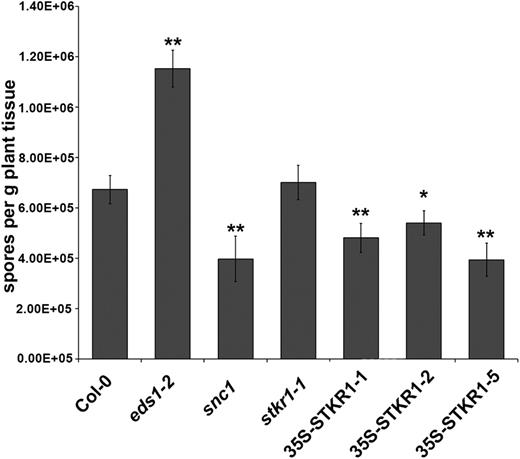
Overexpression of STKR1 results in enhanced resistance to the virulent oomycete Hpa Noco2. Two-week-old seedlings of the indicated genotypes were spray inoculated with Hpa Noco2 conidiospore suspension (4 × 10⁴ mL−1), and pathogen sporulation on leaves was quantified 5 d after inoculation. Values are averages ± sd of four replicates. Asterisks indicate significant differences from Col-0 (Student’s t test: *, P < 0.05 and **, P < 0.01). The experiment was repeated twice with similar results.
DISCUSSION
We demonstrated previously that both Arabidopsis SnRK1 catalytic α-subunits and STKR1 interact in yeast and, thus, hypothesized that STKR1 could be involved in SnRK1 signaling in plants (Nietzsche et al., 2014). In this study, we show by independent methods that both Arabidopsis SnRK1 α-subunit isoforms interact with STKR1 also in planta. BiFC assays show that the interaction occurs predominantly inside the plant cell nucleus, which is consistent with a proposed role of STKR1 in transcriptional regulation (Curaba et al., 2003; Chevalier et al., 2008; Perazza et al., 2011) and suggests a functional link between STKR1-mediated transcriptional regulation and SnRK1 signaling inside the nucleus. Previous data suggest that SnRK1 can be localized to the cytosol as well as to the nucleus in Arabidopsis and N. benthamiana (Gazzarrini et al., 2004; Bitrián et al., 2011) and that the binding of SnRK1 to nucleus-localized proteins can change the partitioning in favor of a nuclear localization of the kinase (Nietzsche et al., 2014). Along that line, the interaction of SnRK1 with other transcription factors, such as FUSCA3, IDD8, and PETAL LOSS, also has been shown to occur inside the plant cell nucleus (Tsai and Gazzarrini, 2012; Jeong et al., 2015; O’Brien et al., 2015). Thus, we consider the nuclear localization of the SnRK1-STKR1 interaction physiologically relevant.
STKR1 and its relatives, the GPL proteins, form homodimers and heterodimers through a noncanonical Leu zipper in the C-terminal domain of the protein; thus, there is a high combinatorial flexibility for the formation of functional protein complexes (Chevalier et al., 2008). Heterodimeric protein-protein interactions mediated by the Leu zipper could increase the repertoire of potential DNA-protein interactions and, thus, allow for a tissue- or stimulus-specific regulation of gene expression by STKR1/GPL protein complexes. The STKR1 protein seems to lack an activation domain required to recruit the basal transcriptional machinery to potential target promoter regions and does not seem to act as a transcriptional activator by itself (Curaba et al., 2003). Thus, it likely requires additional protein partners for its regulatory role in transcription. However, it is currently unknown whether and how STKR1/GPL complex formation is regulated and if certain combinations of proteins could serve specific functions or interact with additional proteins in planta. Protein truncation analyses suggest that SnRK1 binds to the STKR1 N-terminal region in yeast and, thus, could interact with the protein while it is assembled into a protein complex to alter its dimerization preferences. It was shown recently that, during dark-induced starvation in Arabidopsis, SnRK1 phosphorylates the transcription factor bZIP63 to change its dimerization preference, thereby affecting target gene expression and, ultimately, primary metabolism (Mair et al., 2015). However, tests of the phosphorylation of STKR1 by AKIN10 proved negative, although AKIN10 itself was active in the in vitro test system, as shown by the phosphorylation of the generic SnRK1 substrate MBP-SAMS. The STKR1 polypeptide contains at least two potential consensus recognition sequences of AMPK/SnRK1 Ser/Thr kinases (Weekes et al., 1993), and it appears to be phosphorylated in planta involving these sites. Thus, it is possible that the phosphorylation of STKR1 by SnRK1 requires additional factors that are absent from the in vitro assay. Indeed, we have shown previously that both SnRK1a proteins and STKR1 interact with a protein containing a domain of unknown function581 (DUF581-18; K and Laxmi, 2014; Nietzsche et al., 2014). DUF581 proteins are represented by a small gene family with 18 members in Arabidopsis, and evidence suggests that they all bind the SnRK1α subunits AKIN10 and AKIN11 via their conserved DUF581, while specific additional protein partners interact with their variable region. Thus, DUF581 proteins could potentially act as mediators conferring tissue- and stimulus-specific differences in SnRK1 regulation by the recruitment of potential substrate proteins and the kinase into the same complex (Nietzsche et al., 2014). Whether SnRK1a, STKR1, and DUF581-18 assemble to form a trimeric complex needs to be experimentally investigated. Our yeast interaction data imply that an additional protein such as DUF581-18 is not strictly required for SnRK1a to interact with STKR1; however, within a trimeric complex, DUF581-18 could modulate the interaction between SnRK1a and STKR1 to effect the phosphorylation of the latter. Alternatively, SnRK1 could use STKR1 itself as a scaffold to phosphorylate other proteins in a STKR1/GPL heterocomplex.
Direct phosphorylation of a transcription factor by SnRK1 has been shown for FUS3, an essential regulator of seed maturation in Arabidopsis, within its B2 DNA-binding/protein-protein interaction domain (Tsai and Gazzarrini, 2012). FUS3 is a short-lived protein that is degraded rapidly by the 26S proteasome (Lu et al., 2010), and overexpression of AKIN10 delays FUS3 degradation by a yet uncharacterized mechanism and, thus, enhances its activity (Tsai and Gazzarrini, 2012). Negative regulation of a transcription factor by SnRK1-mediated phosphorylation has been shown for IDD8, which regulates flowering time in Arabidopsis by modulating sugar metabolism and transport under sugar-limiting conditions (Jeong et al., 2015). In this case, the protein stability of IDD8 is unaffected by protein phosphorylation but the modification inhibits the transcriptional activation activity of IDD8 through a yet unknown mechanism (Jeong et al., 2015).
Although the phosphorylation of STKR1 by SnRK1a needs to be proven experimentally, the data obtained so far suggest that both proteins interact inside the plant cell nucleus and that transient coexpression of STKR1 and SnRK1a in leaves of N. benthamiana affects either directly or indirectly the stability of the STKR1 protein and, thus, might alter its activity in transcriptional regulation.
If a functional link between SnRK1 and STKR1 exists, then there should at least be phenotypic similarities in plants with altered expression of either of the two genes. In contrast to 35S-STKR1 transgenic Arabidopsis lines, plants overexpressing AKIN10 show no reduced growth when grown on soil (Baena-González et al., 2007). However, AKIN10 overexpression resulted in late flowering and a delay in the onset of developmental senescence (Baena-González et al., 2007; Cho et al., 2012), similar to what was observed in plants overexpressing STKR1, suggesting that both genes negatively regulate developmental phase transitions. In addition, AKIN10 overexpression repressed the expression of MYB75/PAP1, a key transcription factor for anthocyanin biosynthesis, resulting in a reduced accumulation of anthocyanins (Baena-González et al., 2007). Similarly, MYB75/PAP1 expression was reduced in soil-grown transgenic 35S-STKR1 lines as compared with wild-type plants of the same age, suggesting that STKR1 also acts as a negative regulator of MYB75/PAP1 expression and, thus, anthocyanin synthesis. Whether SnRK1 and STKR1 act together in the regulation of anthocyanin production needs further experimentation.
In summary, although a firmly established direct functional link between SnRK1 and STKR1 beyond the physical interaction of the two proteins inside the nucleus is yet missing, some of the phenotypic alterations of the 35S-STKR1 transgenic lines resemble those described for plants with altered SnRK1 signaling through the overexpression of AKIN10. Thus, both proteins could be at least partially involved in the same pathways for the regulation of plant growth and development.
SnRK1 has been proposed to coordinate and adjust physiological and metabolic demands for growth, including the regulation of carbohydrate metabolism and starch biosynthesis (Polge and Thomas, 2007). Overexpression of a catalytic SnRK1 α-subunit has been shown to increase starch accumulation in potato tubers as nonphotosynthetic storage organs (McKibbin et al., 2006). On the contrary, AKIN10 overexpression in Arabidopsis plants led to a reduced leaf starch content (Jossier et al., 2009), while silencing of both SnRK1 α-subunits prevented starch degradation in leaves during the dark period (Baena-González et al., 2007). This suggests an important regulatory role of SnRK1 in storage carbohydrate metabolism, although it appears to have different functions in sink and source organs. The connection of SnRK1 signaling to starch metabolism on the molecular level is currently unknown. At the end of the light period, the starch content in leaves of 35S-STKR1 plants was unaltered as compared with the wild-type control, while the levels of Glc, Fru, and Suc were reduced in the transgenics. The reduction in soluble carbohydrates upon the overexpression of STKR1 could be brought about by a restriction in Suc synthetic capacity, as, for instance, it is observed in plants with reduced activity of SPS, the enzyme catalyzing the rate-limiting step within this pathway (Chen et al., 2005; Volkert et al., 2014). However, a restriction in Suc biosynthetic capacity has been shown to result in increased leaf starch levels caused by an impaired starch mobilization during the night (Chen et al., 2005; Volkert et al., 2014). Starch levels in STKR1 overexpression lines were strongly reduced at the end of the dark period, arguing for an accelerated rate of starch breakdown in these plants despite the lower Suc levels also observed at the end of the dark period. Thus, the likely explanation for the reduced Suc content in 35S-STKR1 leaves at the end of the light period as well as after dark is an increased export and/or consumption of carbohydrates in metabolic processes. However, the transgenic plants are smaller than wild-type plants of the same age; thus, carbohydrates are not invested into plant growth but rather diverted to other energy-demanding cellular processes.
In contrast to major and minor carbohydrates, most amino acids, representing the primary nitrogen-containing compounds, are increased in 35S-STKR1 transgenic plants. As with other metabolites, the level of amino acids will depend on the relative rate of synthesis and utilization. Protein synthesis for growth is a major sink for amino acids. Thus, given the lack of carbohydrates and the decreased growth of 35S-STKR1 plants, the accumulation of amino acids could be ascribed to a reduced demand for building blocks otherwise fueling protein synthesis. Contrariwise, energy deficit can lead to the catabolism of proteins and the release of amino acids for further catabolism (Thimm et al., 2004; Baena-González et al., 2007; Usadel et al., 2008). This process is mediated at least in part by SnRK1 signaling, which induces the catabolism of branched-chain amino acids and the synthesis of Asn through transcriptional induction of the respective metabolic pathways (Baena-González et al., 2007). Indeed, Asn levels in 35S-STKR1 plants are higher in the dark as compared with the light period but also when dark-treated transgenic lines are compared with the wild type under the same conditions. Thus, alterations in SnRK1 signaling in 35S-STKR1 lines could lead to an increased accumulation of Asn but also could help to explain the decrease in branched-chain amino acids such as Ile and Val observed in the dark.
Plant SnRK1s orchestrate transcriptional networks that generally promote catabolism and suppress anabolism in order to maintain cellular energy homeostasis in stressful conditions (Baena-González et al., 2007; Baena-González and Sheen, 2008). Available evidence suggests that group S1 basic Leu zipper (bZIP) transcription factors play a role in the regulation of a subset of SnRK1 target genes during starvation, although direct phosphorylation of these transcription factors by SnRK1 so far has not been shown. However, S1 bZIPs preferentially form heterodimers with the low-energy-controlled group C bZIPs. Of these, bZIP63 has been implicated in controlling gene expression in response to starvation and recently was identified as an in vivo transcription factor target of SnRK1 (Mair et al., 2015). SnRK1 phosphorylates bZIP63 on three Ser residues, promoting the formation of C/S1 heterodimers and, hence, constituting an important regulatory mechanism in gene expression. Analysis of a limited set of SnRK1 marker genes, including ASN1 as a known bZIP target (Hanson et al., 2008), in 35S-STKR1 lines suggests that the expression of these genes is unaltered as compared with the wild type during the light as well as during a prolonged dark period, indicating that this branch of SnRK1 signaling is not affected by STKR1 overexpression.
Along that line, a global transcriptional profiling of dark-treated 35S-STKR1 lines using cDNA microarrays showed no significant overlap with the set of SnRK1 marker genes found to be differentially regulated in AKIN10-overexpressing Arabidopsis protoplasts (Baena-González et al., 2007). However, a Gene Ontology enrichment analysis revealed an overrepresentation of differentially induced genes related to plant immunity and SA-mediated defense. This transcriptional profile fits well with the observed increase in SA levels as well as the enhanced resistance toward the virulent oomycete Hpa Noco2 in STKR1-overexpressing plants and is reminiscent of the phenotype of mutants carrying a defect in the CPR5 (constitutive expressor of pathogenesis-related genes5) gene (Bowling et al., 1997). cpr5 was isolated originally as a pathogen-resistant mutant with constitutive expression of the PR1 gene and high SA content. However, the isolation of additional cpr5 alleles suggests that CPR5 is a master regulator of diverse cellular processes, including cell cycle-related effector-triggered immunity (Wang et al., 2014), senescence (Yoshida et al., 2002), sugar signaling (Jing et al., 2007), and cell proliferation and expansion (Kirik et al., 2001). Recent evidence suggests that CPR5 is an integral part of the nuclear pore complex and appears to be involved in the regulation of nuclear pore complex penetrability, as overexpression of an N-terminally truncated CPR5 variant leads to the cytoplasmic retention of stress- and hormone-controlled nuclear proteins (Gu et al., 2016). The similarities between cpr5 and STKR1-overexpressing plants raise the possibility that STKR1 and its related GPL proteins are involved in a subset of CPR5 responses. It was shown previously that overexpression of GPL2 with constitutive transcriptional activation activity or a quadruple knockout of stkr1/gpl1,2,3 also leads to transcriptional changes similar to cpr5 (Perazza et al., 2011), lending further support to the notion that STKR1/GPL proteins and CPR5 share a subset of regulated genes. Interestingly, both cpr5 and stkr1/gpl1,2,3 plants display misregulation of the SnRK1 marker gene ASN1 (Perazza et al., 2011). Thus, other than being a kinase substrate in a direct SnRK1 signaling pathway, STKR1 could be involved in the facilitation of nuclear signaling events, including SnRK1, but likely also of other nuclear-cytoplasmic proteins.
An important difference between cpr5 and 35S-STKR1 plants is their senescence phenotype. While cpr5 displays accelerated senescence (Jing et al., 2002, 2007), overexpression of 35S-STKR1 strongly delays developmental senescence. SA plays a vital role not only in plant defense but also in the regulation of senescence-associated processes (Rivas-San Vicente and Plasencia, 2011). In Arabidopsis senescent leaves, SA levels increase approximately 4-fold at the midsenescence stage, and plants carrying defects in SA synthesis or signaling exhibit delayed senescence as compared with wild-type plants (Morris et al., 2000). In STKR1-overexpressing plants, senescence is strongly delayed despite increased SA levels and a constitutive activation of SA-mediated defense responses, indicating that other regulatory mechanisms override the senescence-promoting effect of SA in 35S-STKR1 plants. Among the DEGs identified in 35S-STKR1 plants were a number of genes encoding members of the WRKY and NAC families of transcription factors. These protein families are particularly rich in senescence-regulated transcription factors in many plant species (Kim et al., 2016; Phukan et al., 2016), and their members have been described as positive as well as negative regulators of plant senescence, although a distinct regulatory function with respect to senescence regulation has only been reported for some WRKY and NAC transcription factors so far. Among the WRKY transcription factors significantly induced in 35S-STKR1 plants are WRKY70 and WRKY54, which were recently shown to act as negative regulators of leaf senescence in Arabidopsis (Besseau et al., 2012). Similarly, overexpression of NAC042, which is induced in 35S-STRKR1 lines, strongly delays the senescence of transgenic Arabidopsis plants (Wu et al., 2012). It is currently unclear how the induction of transcription factors is functionally related to STKR1 overexpression or SnRK1 signaling. Notably, SnRK1 has been shown to interact with a member of the NAC transcription factor family, namely ATAF1 (Kleinow et al., 2009), and overexpression of ATAF1 was shown recently to induce a transcriptional reprogramming similar to the SnRK1-induced C-starvation response, affecting, for example, starch metabolism, autophagy, and amino acid catabolism (Garapati et al., 2015).
In summary, this study establishes STKR1 as a SnRK1-interacting protein inside the plant cell nucleus. Although evidence for the phosphorylation of STKR1 by SnRK1 is currently missing, STKR1-overexpressing plants show many phenotypic changes that have been associated with SnRK1 overexpression; thus, STKR1 could act as a downstream component of SnRK1 signaling. The transgenic Arabidopsis plants display transcriptional changes that suggest a constitutive activation of SA-related defense. Induced defense represents a substantial investment of energy, and the ability of plants to control growth-defense balance is vital for survival and adaptation to the environment (Huot et al., 2014; Smakowska et al., 2016). One possible explanation for the observed changes in gene expression is that STKR1 together with SnRK1 is involved in the redirection of metabolic expenditure from growth toward defense in order to fuel, for instance, the synthesis of phytoalexins such as camalexin. However, given the lack of direct phosphorylation of STKR1 by SnRK1 and the similarities of the transcriptional profile of 35S-STKR1 plants with that reported for cpr5, STKR1 also could act as a general regulator of nuclear signaling, including SnRK1, but also of other signaling pathways.
MATERIALS AND METHODS
Plant Material and Growth Conditions
Nicotiana benthamiana plants were grown in soil in a phytochamber with daily watering and subjected to a 16-h-light/8-h-dark cycle (25°C/21°C) at 300 µmol m−2 s−1 light and 40% relative humidity.
The T-DNA insertion line stkr1-1 T-DNA (SALK_115723C) was obtained from the Nottingham Arabidopsis Stock Centre. Homozygous plants were identified by PCR amplification using the primer combination LP and RP for the wild type and the primer combination RP and BP for T-DNA. Primer lists are provided in Supplemental Table S7. Transgenic 35S-STKR1 Arabidopsis (Arabidopsis thaliana) lines were generated by transformation of Col-0 wild-type plants with a plasmid containing the entire STKR1 (At4g00270.1) coding region fused to a triple myc tag and under the control of the CaMV 35S promoter using the floral dip method (Clough and Bent, 1998). For the selection of transgenic plants, seeds of T0 plants were sterilized and sown onto Murashige and Skoog medium (Sigma) supplemented with Gamborg’s vitamin solution (1:1,000) and 50 μg mL−1 kanamycin. Primary transformants were allowed to self-fertilize and propagated into the homozygous T3 generation.
Wild-type Arabidopsis ecotype Col-0, 35S-STKR1 transgenic lines 1, 2, and 5, and the stkr1-1 T-DNA insertion line (SALK_115723C) in this background were sown on soil and stratified at 4°C in the dark for 3 d. Subsequently, plants were grown in an 8-h-light (22°C)/16-h-dark (20°C) photoperiod at 50% relative humidity and a photon flux density of 150 μmol m–2 s–1. For the induction of reproductive growth, plants were transferred to long-day conditions (20°C day/18°C night) with 16 h of supplementary light (150 μmol m−2 s−1) and 8 h of darkness.
Plasmid Construction
The plasmids for transient in planta expression as well as for yeast two-hybrid analyses containing the Arabidopsis SnRK1 α-subunits AKIN10 and AKIN11 have been described previously (Nietzsche et al., 2016). To generate plasmids containing the STKR1 coding region, the entire open reading frame was amplified by PCR from Arabidopsis cDNA using the primers listed in Supplemental Table S3. The resulting fragments were inserted into the pENTR-D/TOPO vector according to the manufacturer’s instructions (Thermo) and verified by sequencing. For yeast two-hybrid analysis, fragments were recombined into Gateway-compatible versions of the GAL4 DNA-binding domain vector pGBT-9 and the activation domain vector pGAD424 (Clontech) using L/R Clonase (Thermo). To generate translational fusions between STKR1 and the GFP, coding sequences were inserted into the vector pK7FWG2 (Karimi et al., 2002).
Transient Expression in N. benthamiana Using Agrobacterium tumefaciens Infiltration
For infiltration of N. benthamiana leaves, A. tumefaciens C58C1 carrying the construct of interest was infiltrated into the abaxial air space of 4- to 6-week-old plants using a needleless 2-mL syringe. Plasmid-containing agrobacteria were cultivated overnight at 28°C, harvested by centrifugation, and the pellet was resuspended in sterile water to a final OD600 of 1. The cells were used for the infiltration directly after resuspension. The A. tumefaciens suspension was mixed in a ratio of 1:1 or for coexpression experiments. Each infiltration assay was repeated at least three times, where three plants were infiltrated and two leaves per plant.
BiFC
Constructs were transformed into A. tumefaciens C58C1 and transiently expressed by A. tumefaciens infiltration in N. benthamiana. The BiFC-induced YFP fluorescence was detected by confocal laser scanning microscopy (LSM510; Zeiss) after 48 h post inoculation. The specimens were examined using the LD LCI Plan-Apochromat 253/0.8 water-immersion objective for detailed images with excitation using the argon laser (458- or 488-nm line for BiFC or chlorophyll autofluorescence). The emitted light passed the primary beam-splitting mirrors at 458/514 nm and was separated by a secondary beam splitter at 515 nm. Fluorescence was detected with filter sets as follows: on channel 3, 530 to 560 band pass; and on channel 1, for red autofluorescence of chlorophyll.
Yeast Two-Hybrid Analyses
Yeast two-hybrid techniques were performed according to the Yeast Protocols Handbook and the Matchmaker GAL4 Two-Hybrid System 3 manual (both Clontech). The direct interaction of two proteins was investigated by cotransformation of the respective plasmids in the yeast strain Y190, followed by selection of transformants on medium lacking Leu and Trp at 30°C for 3 d and subsequent transfer to medium lacking Leu, Trp, and His (supplemented with 25 mm 3-aminotriazole) for growth selection and lacZ activity testing of interacting clones.
Site-Directed Mutagenesis
Site-directed mutagenesis of STKR1 constructs was carried out using the Quick-Change site-directed mutagenesis kit (Agilent) employing the primers listed in Supplemental Table S3. All base changes were verified by sequencing.
Western Blotting
Leaf material was homogenized in SDS-PAGE loading buffer (100 mm Tris-HCl, pH 6.8, 9% [v/v] β-mercaptoethanol, 40% [v/v] glycerol, 0.0005% [w/v] Bromphenol Blue, and 4% [w/v] SDS) and, after heating for 10 min at 95°C, subjected to gel electrophoresis. Separated proteins were transferred onto nitrocellulose membranes (Porablot; Macherey-Nagel). Proteins were detected by an anti-HA-peroxidase high-affinity antibody (Roche), anti-myc-peroxidase antibody (Roche), and anti-GFP antibody (Roche) via chemiluminescence (GE Healthcare) using a myECL imager (Thermo).
In Vitro Kinase Assay
Active SnRK1 was generated by immunoprecipitation from leaves of 35S:SnRK1.1-HA plants (kindly provided by Filip Rolland, Katholieke Universiteit Leuven) treated for 1 h in darkness essentially as described (Rodrigues et al., 2013). For in vitro kinase assays, 1 µg of immunoprecipitated SnRK1.1 was coincubated with 5 µg of Escherichia coli-produced and purified recombinant MBP-STKR1 or MBP-SAMS for 30 min at 30°C in kinase buffer (50 mm Tris-HCl, pH 7.4, 10 mm MgCl2, 0.1 mm EGTA, 1 mm DTT, and 0.1 mm ATP). Subsequently, the reaction was stopped by heating to 95°C for 5 min, and proteins were separated by SDS-PAGE. After gel separation, phosphoproteins were detected by phospho-specific ProQ Diamond stain (Thermo).
RNA Extraction and qRT-PCR
Total RNA was isolated from leaf material and then treated with RNase-free DNase to degrade any remaining DNA. First-strand cDNA synthesis was performed from 2 mg of total RNA using Revert-Aid reverse transcriptase (Thermo). For qRT-PCR, the cDNAs were amplified using SensiFAST SYBR Lo-ROX Mix (Bioline) in the AriaMx Realtime PCR System (Agilent Technologies) as described previously (Arsova et al., 2010). At least three biological repeats and three technical repeats were used for each analysis. The transcript level was standardized based on cDNA amplification of UBC9 as a reference. Statistical analysis was performed using Student’s t test. Primers are provided in Supplemental Table S3.
Microarray Analysis
Leaf samples were taken in triplicate from 4-week-old wild-type plants or 35S-STKR1 line 1, 2, or 5 either after 6 h of illumination or after an extended dark period for 6 h, and total RNA was extracted using the RNAeasy Kit (Qiagen). Transcriptome profiling was performed on ArrayXS Arabidopsis version 2 (XS-5010) microarrays in the Agilent 8×60K format (Oaklabs) that represent 30,541 Arabidopsis genes. The array design is described in Gene Expression Omnibus accession GPL19779. Labeling of total RNA and microarray processing were performed by Oaklabs. Briefly, the RNA quality was reassayed on an Agilent 2100 Bioanalyzer. Cy3-labeled cRNA was synthesized with the Agilent Quick Amp Labeling Kit one-color and hybridized to the microarrays according to the manufacturer’s instructions. Microarrays were scanned on Agilent High-Resolution Scanner G2505C, and the images were processed with the Agilent Feature Extraction software using default settings.
Data were imported into GeneSpring GX version 12.5 software (Silicon Genetics) and normalized using default settings: intensity values were set to a minimum of 1, followed by log2 transformation, a per chip normalization to the 75th percentile, and a baseline correction to the median of all samples. Entities that passed the quality check (flags detected) and showed changes in expression equal to or more than 2-fold were subjected to one-way ANOVA against control samples (P ≤ 0.05) with Benjamini-Hochberg multiple test correction (Benjamini and Hochberg, 1995). Volcano plot analysis was applied to identify statistically significant (P ≤ 0.05), equal to or more than 2-fold differentially expressed entities by pairwise comparisons. Entities that were changed in all transgenic lines as compared with the wild type were extracted from the intersection of Venn diagrams created in GeneSpring. Hierarchical clustering of genes was performed using the Euclidean similarity matrix and Ward linkage rule. Functional assignment was based on MAPMAN bins (Usadel et al., 2009) complemented by hand-edited gene annotation. Microarray raw data have been lodged with the Gene Expression Omnibus and are available under the accession number GSE104652.
Metabolite Analysis
Metabolite profiling was performed exactly as described by Lisec et al. (2011). Metabolite identities were verified via comparison with spectral libraries of authentic standards housed in the Golm Metabolome Database (Kopka et al., 2005).
Carbohydrate Determination
Soluble sugar and starch levels were determined in leaf samples extracted with 80% (v/v) ethanol/20 mm HEPES, pH 7.5, as described (Stitt et al., 1989), adapted for determination in a plate reader by direct downscaling of the assay to a volume of 200 μL.
Determination of SA and Camalexin
The extraction of SA and camalexin was carried out as described previously (Meuwly and Métraux, 1993; Nawrath and Métraux, 1999) with slight modifications.
In brief, 50 mg of frozen leaf material was homogenized in liquid nitrogen and extracted two times with 70% (v/v) methanol and 90% (v/v) methanol for 1 h at 65°C, respectively. A total of 100 ng of SA-d4 (Sigma) was added as an internal standard. The extracts were evaporated under N2, and samples were resuspended in 5% (w/v) TCA. The solution was partitioned against 600 µL of cyclohexane:ethyl acetate (1:1) two times, and the upper organic phase was evaporated (not completely). The residual sample was dissolved in 100 µL of 80% (v/v) formic acid/20% (v/v) acetonitrile (contains free SA and camalexin). The aqueous phase was acidified with 1 volume of formic acid and incubated at 80°C for 1 h. The solution was partitioned against 600 µL of cyclohexane:ethyl acetate (1:1) two times, and the upper organic phase was evaporated (not completely). The residual sample was dissolved in 100 µL of 80% formic acid/20% acetonitrile (v/v) (contains conjugated SA).
The concentrations were analyzed using an ultra-performance liquid chromatography system (Agilent Technologies) coupled to an Agilent 6530 quadrupole time of flight liquid chromatograph-mass spectrometer (Agilent Technologies).
The separation was performed on a Zorbax 5B-C18 column (Agilent Technologies) at a flow rate of 0.4 mL min−1 in gradient mode formed by 0.24% (v/v) acetic acid (A) and acetonitrile (B). The gradient used for eluent B was 0 to 3 min, isocratic 2%; 3 to 10 min, 2% to 22%; 10 to 16 min, 22% to 80%; 16 to 18 min, isocratic 80%; 18 to 19 min, 80% to 100%; and 19 to 20 min, isocratic 100%. An electrospray ionization source was used in negative ionization mode using the following settings: capillary voltage, 2,000 V; nozzle voltage, 1,000 V; fragmentor, 100 V; gas temperature, 250°C; gas flow rate, 8 mL min−1; nebulizer, 35 psi; sheath gas temperature, 270°C; and sheath gas flow rate, 8 mL min−1. The data were processed using Mass Hunter Qualitative Analysis (B.07.00) and Quantitative Analysis (B.08.00). The concentrations were calculated based on external calibration curves of SA and the recovery of the internal standard d4-SA using as qualifier ions SA [M-H]− = 137.0244 and d4-SA [M-H]− = 141.0495, respectively.
Pathogen Assays
Hyaloperonospora arabidopsidis isolate Noco2 was spray inoculated onto 2-week-old seedlings at a concentration of 4 × 10⁴ conidiospores per mL of water. For each tested Arabidopsis genotype, 40 to 50 seedlings were inoculated per experiment. Inoculated plants were kept under a propagator lid in a growth chamber at 18°C and an 8-h photoperiod. Five days after inoculation, spores were harvested from all seedlings and counted using a light microscope with a Neubauer counting cell chamber, with sporulation levels expressed as the number of conidiospores per gram of leaf tissue.
Supplemental Data
The following supplemental materials are available.
Supplemental Figure S1. Negative controls for AKIN/STKR1 BiFC experiments.
Supplemental Figure S2. Yeast two-hybrid assay to test for the interaction of STKR1 with either the AKIN10 catalytic domain or its regulatory domain.
Supplemental Figure S3. Predicted and experimentally confirmed phosphorylation sites within the STKR1 polypeptide.
Supplemental Figure S4. Characterization of Arabidopsis plants with modulated STKR1 expression.
Supplemental Figure S5. Overexpression of STKR1 in Arabidopsis delays flowering.
Supplemental Figure S6. Dark-induced senescence in Arabidopsis plants with altered STKR1 expression as compared with the wild-type control.
Supplemental Figure S7. qRT-PCR analysis of SnRK1 marker gene expression in Arabidopsis plants with altered STKR1 expression as compared with the Col-0 control.
Supplemental Figure S8. qRT-PCR analysis of SAR marker gene expression in 35S-STKR1 Arabidopsis plants as compared with the Col-0 control.
Supplemental Figure S9. qRT-PCR analysis of transcription factor gene expression in 35S-STKR1 Arabidopsis plants as compared with the Col-0 control.
Supplemental Table S1. Metabolite profiling of Arabidopsis plants with altered STKR1 expression as compared with the wild-type control.
Supplemental Table S2. DEGs in wild-type Col-0 Arabidopsis plants at 6 h of extended dark versus 6 h into the light.
Supplemental Table S3. DEGs in 35S-STKR1 Arabidopsis transgenic lines at 6 h of extended dark versus 6 h into the light.
Supplemental Table S4. DEGs in 35S-STKR1 Arabidopsis transgenic lines versus Col-0 wild-type plants 6 h after the onset of light.
Supplemental Table S5. DEGs in 35S-STKR1 Arabidopsis transgenic lines versus Col-0 wild-type plants after extension of the dark period for 6 h.
Supplemental Table S6. Gene Ontology term enrichment analysis of genes differentially expressed in 35S-STKR1 transgenic Arabidopsis lines after an extended dark period for 6 h as compared with the wild-type control.
Supplemental Table S7. Oligonucleotides used in this study.
ACKNOWLEDGMENTS
We thank Alexander Korpys for help during the characterization of the transgenic Arabidopsis plants and Mario Drungowski for the initial microarray analysis.
LITERATURE CITED
Author notes
This work was supported by grants from the Deutsche Forschungsgemeinschaft (grant no. WI3208/4-2 to M.W. and grant no. CRC973, “Priming and Memory of Organismic Responses to Stress,” to F.B.).
Address correspondence to [email protected].
The author responsible for distribution of materials integral to the findings presented in this article in accordance with the policy described in the Instructions for Authors (www.plantphysiol.org) is: Frederik Börnke ([email protected]).
M.N. and F.B. conceived the study; M.N., T.G., S.A., S.B., and M.W. performed the experiments; M.N., T.G., S.A., M.W., A.R.F., and F.B. analyzed the data; S.S. performed the bioinformatics analysis; F.B. wrote the article with input from all authors.
Articles can be viewed without a subscription.
