


Abstract
Prior studies with Nicotiana and Arabidopsis described failed assembly of the chloroplastic NDH [NAD(P)H dehydrogenase] supercomplex by serial mutation of several subunit genes. We examined the properties of Zea mays leaves containing Mu and Ds insertions into nuclear gene exons encoding the critical o- and n-subunits of NDH, respectively. In vivo reduction of plastoquinone in the dark was sharply diminished in maize homozygous mutant compared to normal leaves but not to the extreme degree observed for the corresponding lesions in Arabidopsis. The net carbon assimilation rate (A) at high irradiance and saturating CO2 levels was reduced by one-half due to NDH mutation in maize although no genotypic effect was evident at very low CO2 levels. Simultaneous assessment of chlorophyll fluorescence and A in maize at low (2% by volume) and high (21%) O2 levels indicated the presence of a small, yet detectable, O2-dependent component of total linear photosynthetic electron transport in 21% O2. This O2-dependent component decreased with increasing CO2 level indicative of photorespiration. Photorespiration was generally elevated in maize mutant compared to normal leaves. Quantification of the proportion of total electron transport supporting photorespiration enabled estimation of the bundle sheath cell CO2 concentration (Cb) using a simple kinetic model of ribulose bisphosphate carboxylase/oxygenase function. The A versus Cb relationships overlapped for normal and mutant lines consistent with occurrence of strictly CO2-limited photosynthesis in the mutant bundle sheath cell. The results are discussed in terms of a previously reported CO2 concentration model [Laisk A, Edwards GE (2000) Photosynth Res 66: 199–224].
One of the world’s highest-yielding crop species, Zea mays (“maize”), owes its success to the C4 pathway of CO2 assimilation. C4 plants exhibit high rates of photosynthesis, use less nitrogen, and are drought-tolerant. This adaptation requires cooperation between two distinct, adjacent leaf cell types to accomplish concentration of CO2 around ribulose bisphosphate (RuBP) carboxylase/oxygenase (Rubisco) in the bundle sheath cell (BSC)—a capability absent in C3 species. Understanding this mechanism would benefit efforts to engineer less efficient C3 species such as the staple rice into C4 plants (Jiao et al., 2009, von Caemmerer et al., 2012). Although the biochemical and structural features associated with BSC function in C4 photosynthesis are now familiar, regulation of the ratio of CO2 import/fixation, which relies on interactions of energy metabolism in the mesophyll cell (MC) and BSC, is not.
The main features of photosynthesis in NADP-ME (malic enzyme)-type species such as maize and sorghum have been well described (Edwards and Walker 1983, Zelitch et al., 2009). Atmospheric CO2 is first fixed in the MC by carboxylation of PEP (phosphoenolpyruvate) to form OAA (oxaloacetate). The OAA is reduced to MAL (malate) and shuttled to the BSC chloroplast where the recently fixed CO2 is released by ME. Pyruvate produced in this reaction returns to the MC and is used to regenerate PEP, completing the C4 cycle. The CO2 released in the BSC is refixed by carboxylation of RuBP as catalyzed by Rubisco to form PGA (3-phosphoglyceric acid). Thus, C4 photosynthesis is an intrinsically C3 process overlaid with a CO2-pumping C4 cycle leading to enhanced carboxylation of RuBP by Rubisco. The beneficial kinetic effect of high CO2 is reinforced by competitive inhibition of Rubisco-catalyzed oxygenation of RuBP to produce glycolate-P and PGA (Laing et al., 1974, Ogren 2003). Glycolate-P is obligatorily metabolized with a detrimental release of CO2 in the light (Somerville and Ogren 1979). This connection among RuBP, Rubisco, and O2 was preceded by evidence that glycolic acid, an early product of photosynthesis, is in fact the substrate for photorespiration (Zelitch 1965, 2001). Reversal of the O2-sensitivity of Rubisco (and synthesis of glycolate) highlights the significance of the C4 pathway.
The MC and BSC compartments differ markedly in terms of carbon metabolism and reductant-generating capacities in NADP-ME C4 species. Reduction of OAA to MAL and of PGA to triose-P in the MC is supported by an oxygenic electron transport system involving sequential turnover of photosystem II (PSII) and photosystem I (PSI) similar to C3 mesophyll cells (Edwards and Walker 1983). On the other hand, most schemes of NADP-ME C4 photosynthesis discount existence of PSII in the BSC. Indeed, a recent analysis of sources of F o-level Chl (chlorophyll) fluorescence in intact maize leaves suggested that PSI levels in the BSC and MC compartments are similar but cast real doubt as to the occurrence of PSII in the BSC (Peterson et al., 2014). Also, the level of Chl b, an antenna pigment predominantly associated with PSII, is depleted in the BSC of NADP-ME C4 species (Edwards and Walker 1983). The apparent absence of water-splitting in the BSC is important since it emphasizes the important role of MAL as not only a transporter of CO2 from the MC to the BSC, but also as a stoichiometric transporter of reducing equivalents originating in PSII of the MC chloroplast. The latter appears as NADPH in the BSC after oxidative decarboxylation of MAL by ME. The fate of this NADPH is consequential to operation of the Calvin cycle in the BSC. In this study, we explore the role of chloroplastic NAD(P)H dehydrogenase (NDH) in maize leaf photosynthesis with special consideration of its proposed function in concentration of CO2 in the BSC.
A consensus model of plastid NDH structure and function is based on extensive biochemical and genetic work with C3 Arabidopsis. The 1000-kD NDH supercomplex is comprised of five thylakoid membrane subcomplexes. At least 11 plastid and 25 nuclear genes encode NDH subunits and related protein factors in Arabidopsis (Ifuku et al., 2011, Peng et al., 2011). Serial disruption of several nuclear genes encoding structural subunits or assembly factors resulted in failed NDH supercomplex assembly and disrupted electron flow to PQ (plastoquinone) in the dark (Rumeau et al., 2005, Munshi et al., 2006, Ishihara et al., 2007, Ishikawa et al., 2008, Sirpiö et al., 2009, Takabayashi et al., 2009, Ifuku et al., 2010, Peng et al., 2010, Suorsa et al., 2010, Yabuta et al., 2010, Armbruster et al., 2013). Chloroplastic NDH has been assigned to a redundant NAD(P)H-dependent PSI cyclic electron transport pathway in C3 plants (Nixon 2000). Tobacco deficient in NDH grew normally, but showed symptoms of reduced photoprotective capacity during water stress (Burrows et al., 1998). Likewise, linear electron transport rates in PGR5-deficient Arabidopsis were significantly reduced by simultaneous loss of NDH (Munekage et al., 2004). Early work indicated a probable similar plastid NDH organization and structure in maize (Funk et al., 1999). Maize MC and BSC plastid proteomes revealed expression of 23 NDH-associated components involving eight chloroplast and 26 nuclear gene homologs (Friso et al., 2010). Moreover, elevated expression of NDH in the maize BSC compared to the MC implies a special role with respect to fixation of CO2 by the Calvin cycle (Takabayashi et al., 2005, Majeran et al., 2008, Friso et al., 2010). However, interpretations differ as to the nature of this role.
Plastid NDH catalyzes the reduction of PQ at the expense of NADPH potentiating PSI cyclic electron flow according to PQ → cytochrome f → plastocyanin (PC) → P700 → ferredoxin (Fd) → NADP. Takabayashi et al. (2005) proposed that an NDH-dependent cyclic electron transport pathway and associated Q-cycle turnover was the preferred means of producing adequate ATP for CO2 fixation in the maize BSC as opposed to the conventional cyclic pathway involving reduction of PQ by Fd−. In contrast, the model proposed by Laisk and Edwards (2000, 2009) envisions linear BSC electron flow from MAL-derived NADPH, via PSI, to a separate NADP pool used by the Calvin cycle (Supplemental Fig. S1). The model emphasizes the stoichiometric constraints inherent in electron transport and H+-translocation [i.e. 12 H+/3 ATP; (Laisk et al., 2005)] in support of NADPH and ATP production by the MC-BSC system. Furthermore, exclusive coupling of production of these substrates to utilization by photosynthetic carbon metabolism supports stable CO2 fixation, but CO2 is not concentrated in the BSC. Conversely, imperfect coupling of ATP production to utilization by the Calvin cycle leads to an imbalance in MAL import versus CO2 fixation in the BSC. Specifically, postulated leakage of ATP to non-photosynthetic processes (e.g. protein or starch synthesis) sets the stage for faster MAL import compared to CO2 fixation, resulting in accumulation of CO2 in the BSC. In the steady state, the CO2 fluxes are balanced by passive diffusion of CO2 from the BSC to the MC (CO2 over-cycling). Hence, the likely competition for ATP between the Calvin cycle and alternate processes establishes a robust basis for sustained concentration of CO2 in the BSC, which accounts for the diminished O2-sensitivity in maize.
To our knowledge, this is the first experimental test of the Laisk-Edwards model. Specifically, we examined maize lines carrying mutations that disrupt expression of key chloroplastic NDH subunits. Interestingly, comparisons to Arabidopsis lines possessing lesions in homologous genes revealed the existence of a lesser, secondary NDH-like activity in maize leaves. Parallel measurements of CO2 exchange and Chl fluorescence showed that the O2-dependent linear electron flow that occurred in maize leaves was characteristic of photorespiration. Photorespiration in the mutant lines was elevated compared to normal lines, suggesting that CO2 was less efficiently concentrated in the BSC compartment of the former. We conclude that the results support the proposed mechanism of Laisk and Edwards (2000, 2009) as a contributor to concentration of CO2 in the BSC of NADP-ME type C4 species.
RESULTS
Molecular Characterization of Maize NDH Lines
The 26 nuclear-encoded maize plastid NDH homologs identified by Friso et al. (2010) were screened in silico for transposon insertions using the Plant and Maize Genome Databases (www.plantgdb.org and www.maizegdb.org). A total of 16 insertions [2 Ds (Ahern et al., 2009) and 14 Mutator (Settles et al., 2007)] into nine NDH-related genes were found. Precise insertion loci were mapped using flanking and genomic sequence information. Transposon identity (Ds or Mu7) and insertion loci in field-grown plants were verified using oligonucleotides specific to the NDH gene and respective transposable element. Two lines were found to segregate transposon insertions in exons of single-copy genes encoding the critical O and N subunits of plastid NDH (Fig. 1, A and B). Thus, plants containing a normal allele (ZmNDHN) produced a 453-base-pair (bp) PCR fragment (Fig. 1A, lanes 1–5, 7) with primers NDHN1 and NDHN2. Plants carrying a Ds insertion allele (ZmNdhn) produced a 1-kilobase band using primers NDHN2 and Ds2 (lanes 2, 6, and 7). Likewise, homozygous normal (lane 1) and heterozygous (lane 2) plants possessing the ZmNDHO allele produced a 739-bp fragment using primers NDHOa and NDHOb. Insertion of Mu7 (ZmNdho) yielded a 300-bp fragment in heterozygous (lane 2) and homozygous segregates (lanes 3 and 4) using primers NDHOD and TIR8.4 (Fig. 1B). The genotypes were verified using independent primers as discussed in “Materials and Methods”. Seed of two self-fertilized siblings homozygous for the normal (ZmNDHO) and mutant (ZmNdho) alleles were used for characterization of growth chamber-grown plants. Individuals homozygous for Ds insertion (ZmNdhn) did not survive to the reproductive stage in the field. Hence, seed from a self-fertilized heterozygote was the source of normal and mutant siblings in laboratory studies. Seedlings were prescreened using the light-dark Chl fluorescence transient (Fig. 2). In a total of 57 progeny, 17 mutant plants were thus identified consistent with Mendelian segregation of the ZmNdhn allele.
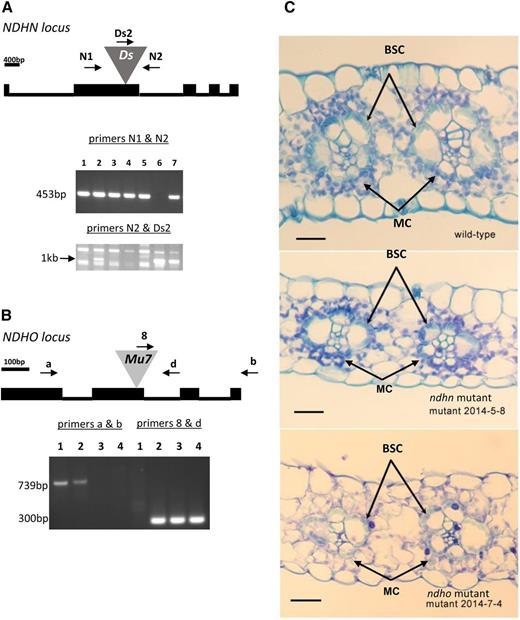
Genotypic analysis of ZmNDH alleles. A, The genomic structure of the ZmNDHN locus is depicted with bars representing exon sequences and lines representing introns. The gray triangle represents Ds insertion (I.S07.1657_JSR05) into exon 2. Specific oligonucleotide primer orientation and positions N1 (NDHN1), N2 (NDHN2), and transposon-specific Ds (DsSeq2) are shown. Gels show DNA fragments amplified from genomic DNA isolated from plants 1 to 7 with primers N1 and N2 (453 bp) or N2 and Ds (1 kb). B, The genomic structure of the ZmNDHO locus is shown in which the gray triangle represents Mu7 insertion (Mu1016286) into exon 2. Specific primer orientation and positions a (NDHOA), b (NDHOB), and d (NDHOD), and Mu7-specific 8 (TIR8.4), are shown. Gel represents amplified DNA fragments from genomic DNA isolated from plants 1–4 with primers a and b (739 bp) or d and 8 (300 bp). C, Light photomicrography of leaf cross sections from ZmNDH (normal or wild-type) and ZmNdh mutant lines. BSCs are arranged radially around vascular elements. The latter are surrounded by MCs in contact with stomatal openings. Scale bar refers to 20 μm. See text for further details.
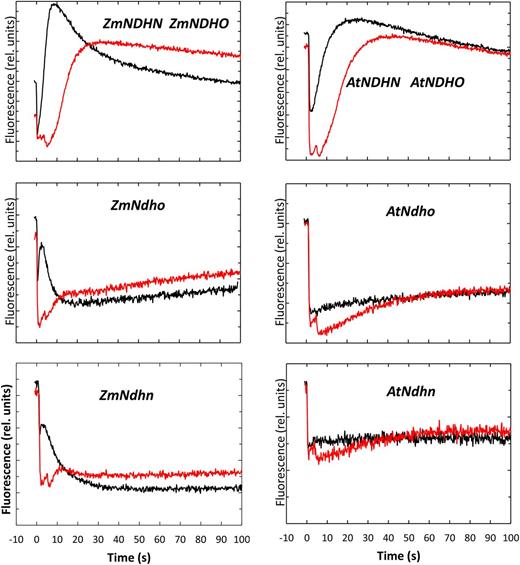
Light-dark fluorescence transients for normal and NDH mutant lines of maize and Arabidopsis. Leaf tissue was pre-illuminated at a WL PFD of 100 μmol quanta m−2 s−1 in normal air (400 μL CO2 L−1, 21% O2) until Fs was stable. (Black traces) The WL was interrupted at time zero. (Red traces) Same as for the black traces, but FRL (50 μmol quanta m−2 s−1) was superimposed on the WL. The FRL was interrupted 5 s after darkening.
Fundamental Properties of NDH-Deficient Maize and Arabidopsis
Under growth chamber conditions, NDH-deficient maize seedlings exhibited marginally visible slower growth and paleness compared to normal sibling lines (Supplemental Fig. S2). Table I shows that loss in expression of ZmNDHO or ZmNDHN resulted in a statistically significant 25% to 35% reduction in total Chl and Car (carotenoid) contents. Not surprisingly, the absorbance of white light (WL) was also reduced in the mutant lines. Microscopy showed that both mutant lines were depleted in chloroplasts relative to normal siblings (Fig. 1C). The average quantum yield of PSII after full (12 h) dark-adaptation (Fv/F md) was lowered by 5% to 6% in the maize mutants, which may result from slight photoinhibition during growth. Large deficits in CO2-saturated CO2 assimilation rates at two incident photon flux density (PFD) levels were observed in these mutants relative to normal controls (see also Fig. 3). Interestingly, a substantial reduction in dark respiration suggests that the NDH complex donates electrons to the maize chlororespiratory system. No significant effects of loss of the NDHO subunit in Arabidopsis on the above parameters were observed. Likewise, no significant NDH-dependent difference in CO2 assimilation was observed in Arabidopsis at a PFD of 100 μmol quanta m−2 s−1 in normal air (270 μm O2, 14.2 μm CO2, 23°C).
Effect of NDH genotype on several photosynthetic parameters in leaf tissue of maize and Arabidopsis
| Chloroplast NDH Subunit | Genotype | Fv/F md | Absorbance of White Light | Chl a+b mg m−2 | Chl a/b g g−1 | Carotenoids mg m−2 | A max (750) μmol CO2 m−2 s−1 | A max (1400) μmol CO2 m−2 s−1 | Dark Respiration μmol CO2 m−2 s−1 |
|---|---|---|---|---|---|---|---|---|---|
| O | ZmNDHO | 0.835 ± 0.004 | 0.785 ± 0.009 | 248 ± 20 | 3.43 ± 0.07 | 48.1 ± 3.5 | 20.62 ± 1.42 | 22.33 ± 1.50 | 0.53 ± 0.03 |
| ZmNdho | 0.786 ± 0.004 | 0.742 ± 0.011 | 198 ± 9 | 3.30 ± 0.08 | 37.8 ± 1.7 | 10.06 ± 0.50 | 10.20 ± 0.41 | 0.35 ± 0.03 | |
| *** (10) | ** (10) | *(10) | NS (10) | ** (10) | *** (4) | *** (3) | ** (10) | ||
| N | ZmNDHN | 0.839 ± 0.004 | 0.820 ± 0.012 | 320 ± 24 | 3.50 ± 0.07 | 61.3 ± 4.3 | 21.89 ± 1.44 | 30.71 ± 3.07 | 0.64 ± 0.09 |
| ZmNdhn | 0.796 ± 0.007 | 0.744 ± 0.008 | 207 ± 6 | 3.32 ± 0.08 | 39.2 ± 1.6 | 10.70 ± 1.21 | 7.48 ± 1.31 | 0.29 ± 0.03 | |
| *** (10) | *** (10) | *** (10) | NS (10) | *** (10) | *** (4) | ** (3) | *** (10) | ||
| O | AtNDHO | 0.809 ± 0.009 | 0.778 ± 0.013 | 205 ± 28 | 2.86 ± 0.05 | 38.4 ± 5.0 | — | — | 0.55 ± 0.11 |
| AtNdho | 0.808 ± 0.009 | 0.799 ± 0.007 | 226 ± 21 | 2.92 ± 0.04 | 39.8 ± 3.8 | — | — | 0.36 ± 0.04 | |
| NS (5) | NS (5) | NS (4) | NS (4) | NS (4) | — | — | NS (5) |
The A max values refer to the maximal CO2 assimilation rates observed at white light PFD levels of 750 or 1400 μmol quanta m−2 s−1 and 30°C. Chls a and b and total carotenoids were assessed according to Lichtenthaler and Buschmann (2001). For each normal/mutant sibling pair, means (± SE)were different at the 0.05 (*), 0.01 (**), or 0.001 (***) probability level based on a Student’s t-test. NS, not significantly different. Values in parentheses refer to the number of replicate determinations per line.
| Chloroplast NDH Subunit | Genotype | Fv/F md | Absorbance of White Light | Chl a+b mg m−2 | Chl a/b g g−1 | Carotenoids mg m−2 | A max (750) μmol CO2 m−2 s−1 | A max (1400) μmol CO2 m−2 s−1 | Dark Respiration μmol CO2 m−2 s−1 |
|---|---|---|---|---|---|---|---|---|---|
| O | ZmNDHO | 0.835 ± 0.004 | 0.785 ± 0.009 | 248 ± 20 | 3.43 ± 0.07 | 48.1 ± 3.5 | 20.62 ± 1.42 | 22.33 ± 1.50 | 0.53 ± 0.03 |
| ZmNdho | 0.786 ± 0.004 | 0.742 ± 0.011 | 198 ± 9 | 3.30 ± 0.08 | 37.8 ± 1.7 | 10.06 ± 0.50 | 10.20 ± 0.41 | 0.35 ± 0.03 | |
| *** (10) | ** (10) | *(10) | NS (10) | ** (10) | *** (4) | *** (3) | ** (10) | ||
| N | ZmNDHN | 0.839 ± 0.004 | 0.820 ± 0.012 | 320 ± 24 | 3.50 ± 0.07 | 61.3 ± 4.3 | 21.89 ± 1.44 | 30.71 ± 3.07 | 0.64 ± 0.09 |
| ZmNdhn | 0.796 ± 0.007 | 0.744 ± 0.008 | 207 ± 6 | 3.32 ± 0.08 | 39.2 ± 1.6 | 10.70 ± 1.21 | 7.48 ± 1.31 | 0.29 ± 0.03 | |
| *** (10) | *** (10) | *** (10) | NS (10) | *** (10) | *** (4) | ** (3) | *** (10) | ||
| O | AtNDHO | 0.809 ± 0.009 | 0.778 ± 0.013 | 205 ± 28 | 2.86 ± 0.05 | 38.4 ± 5.0 | — | — | 0.55 ± 0.11 |
| AtNdho | 0.808 ± 0.009 | 0.799 ± 0.007 | 226 ± 21 | 2.92 ± 0.04 | 39.8 ± 3.8 | — | — | 0.36 ± 0.04 | |
| NS (5) | NS (5) | NS (4) | NS (4) | NS (4) | — | — | NS (5) |
The A max values refer to the maximal CO2 assimilation rates observed at white light PFD levels of 750 or 1400 μmol quanta m−2 s−1 and 30°C. Chls a and b and total carotenoids were assessed according to Lichtenthaler and Buschmann (2001). For each normal/mutant sibling pair, means (± SE)were different at the 0.05 (*), 0.01 (**), or 0.001 (***) probability level based on a Student’s t-test. NS, not significantly different. Values in parentheses refer to the number of replicate determinations per line.

Studies with Arabidopsis and tobacco have shown that failure to form an active chloroplast NDH complex results in a characteristic change in the kinetics of Chl fluorescence in response to darkening (Burrows et al., 1998, Rumeau et al., 2005, Munshi et al., 2006, Ishihara et al., 2007, Ishikawa et al.2008, Peng et al., 2009, Sirpiö et al., 2009, Takabayashi et al., 2009, Suorsa et al., 2010, Yabuta et al., 2010). Figure 2 compares this light-dark transient for the maize mutants ZmNdho and ZmNdhn and respective normal sibling controls. Upon interruption of WL, normal maize and Arabidopsis leaves similarly showed an immediate drop in fluorescence yield followed by a slower rise to levels that often exceeded the steady-state levels observed in the light. Subsequently, the signal decayed on a time scale of minutes. The post-illumination fluorescence rise was completely suppressed in the corresponding Arabidopsis mutant lines (AtNdho and AtNdhn). Interestingly, although fluorescence declined abruptly in the maize mutants upon darkening, the ensuing rise was not diminished to the extent seen in the Arabidopsis mutants. Addition of far red light (FRL, 720 nm, 50 μmol quanta m−2 s−1) to preferentially excite PSI for 5 s after darkening always delayed and attenuated the fluorescence rise. This confirmed that the rise in fluorescence was associated with accumulation of electrons in the inter-photosystem PQ pool leading to partial closure of PSII.
Interactive Effects of O2, CO2, and Maize NDH Genotype
Table II summarizes effects on the MC PSII light utilization parameters of nonphotochemical quenching of excitation [NPQ = (F md – Fm)/Fm], fraction of photochemically competent (open) PSII units [qP = (Fm – Fs)/(Fm – Fo)], and intrinsic PSII quantum yield (Fv/Fm) as well as stomatal (gs) and total mesophyll (liquid phase plus enzymic, gm) values of conductance to CO2. Data were obtained from the CO2 response experiments of Figure 3. Variation in these parameters was assessed for each line by 2-way (O2 versus CO2) ANOVA. A statistically significant [i.e. p (probability) < 0.05] main effect of O2 was most consistently observed for Fv/Fm but the differences were modest. For instance, lowering the O2 concentration from 21% (v/v) to 2% resulted in an 8% versus 12% decline in mean Fv/Fm for ZmNDHO and ZmNdho, respectively. The corresponding O2-dependent declines associated with disruption of expression of ZmNDHN were 7% and 17%, respectively. Similarly, O2 exerted significant, yet small, effects on stomatal conductance (gs) in the maize NDH mutant lines only, suggesting interaction between O2 level and NDH expression with respect to guard cell function. Of greater interest were the consistently significant effects of genotype on PSII parameters qP and NPQ. Loss of ZmNDHO or ZmNDHN expression resulted in a 36% and 27% reduction in photoprotective NPQ, respectively. Not surprisingly, CO2 exerted a strong main effect on PSII light utilization parameters (also gs) but this effector often interacted with genotype. No significant differences in gm were detected in mutant relative to corresponding normal leaves. Importantly, Tables I and II show consistency over a range of properties for the two independently created maize lines under study, which lack expression of distinct subunits essential for assembly of an active NDH supercomplex (Fig. 1). We conclude that neither phenotype is a spurious result of a cryptic mutation linked to the insertion site.
Effects of NDH genotype, O2, and CO2 on maize leaf conductances to CO2 diffusion and PSII light utilization parameters
| Chloroplast NDH Subunit | Genotype | Variation Source | NPQ | qP | Fv/Fm | gs mm s−1 | gm mm s−1 |
|---|---|---|---|---|---|---|---|
| O | ZmNDHO | 2.63 ± 0.18 | 0.609 ± 0.021 | 0.501 ± 0.019 | 4.68 ± 0.10 | 7.53 ± 0.83 | |
| O2 | NS | NS | *** | NS | NS | ||
| ZmNdho | 1.68 ± 0.04 | 0.470 ± 0.016 | 0.415 ± 0.009 | 4.85 ± 0.12 | 7.18 ± 0.51 | ||
| O2 | NS | *** | *** | *** | NS | ||
| Genotype | *** | *** | *** | NS | NS | ||
| CO2 | *** | *** | *** | *** | — | ||
| Genotype × CO2 | *** | NS | *** | NS | — | ||
| N | ZmNDHN | 2.55 ± 0.18 | 0.667 ± 0.018 | 0.463 ± 0.021 | 3.95 ± 0.07 | 7.37 ± 1.04 | |
| O2 | * | NS | *** | NS | NS | ||
| ZmNdhn | 1.85 ± 0.07 | 0.529 ± 0.020 | 0.419 ± 0.013 | 4.35 ± 0.12 | 5.97 ± 0.28 | ||
| O2 | NS | NS | *** | ** | NS | ||
| Genotype | *** | *** | *** | *** | NS | ||
| CO2 | *** | *** | *** | *** | — | ||
| Genotype × CO2 | *** | NS | *** | NS | — |
The data were first analyzed by two-way ANOVA (CO2 versus O2) for an effect of O2 within each line. Two-way ANOVA was then employed to assess effects of genotype and CO2 on data averaged over both O2 levels (white light PFD = 750 μmol quanta m−2 s−1, 30°C). NS, not significantly different. See Table I for additional information.
| Chloroplast NDH Subunit | Genotype | Variation Source | NPQ | qP | Fv/Fm | gs mm s−1 | gm mm s−1 |
|---|---|---|---|---|---|---|---|
| O | ZmNDHO | 2.63 ± 0.18 | 0.609 ± 0.021 | 0.501 ± 0.019 | 4.68 ± 0.10 | 7.53 ± 0.83 | |
| O2 | NS | NS | *** | NS | NS | ||
| ZmNdho | 1.68 ± 0.04 | 0.470 ± 0.016 | 0.415 ± 0.009 | 4.85 ± 0.12 | 7.18 ± 0.51 | ||
| O2 | NS | *** | *** | *** | NS | ||
| Genotype | *** | *** | *** | NS | NS | ||
| CO2 | *** | *** | *** | *** | — | ||
| Genotype × CO2 | *** | NS | *** | NS | — | ||
| N | ZmNDHN | 2.55 ± 0.18 | 0.667 ± 0.018 | 0.463 ± 0.021 | 3.95 ± 0.07 | 7.37 ± 1.04 | |
| O2 | * | NS | *** | NS | NS | ||
| ZmNdhn | 1.85 ± 0.07 | 0.529 ± 0.020 | 0.419 ± 0.013 | 4.35 ± 0.12 | 5.97 ± 0.28 | ||
| O2 | NS | NS | *** | ** | NS | ||
| Genotype | *** | *** | *** | *** | NS | ||
| CO2 | *** | *** | *** | *** | — | ||
| Genotype × CO2 | *** | NS | *** | NS | — |
The data were first analyzed by two-way ANOVA (CO2 versus O2) for an effect of O2 within each line. Two-way ANOVA was then employed to assess effects of genotype and CO2 on data averaged over both O2 levels (white light PFD = 750 μmol quanta m−2 s−1, 30°C). NS, not significantly different. See Table I for additional information.
Although O2 consistently affected the PSII light utilization parameter Fv/Fm (Table II), no statistically significant (i.e. P > 0.05) effect of O2 on net CO2 assimilation rate (A) at a high PFD occurred for the four datasets of Figure 3 based on 2-way (O2 versus CO2) ANOVA. Despite similarity in the initial slopes of A versus MC wall CO2 molarity (Cm) plots (gm; Table II), the linear increase in A extended to higher Cm levels in the normal lines establishing plateaus approximately twice those observed for the mutants.
Also evident in Figure 3 is that the value of C m at which A = 0 (the CO2 compensation point, ½) did not change appreciably with either genotype or O2 level. Additional CO2 response measurements were conducted at five O2 levels ranging from 11 μM to 454 μM (data not shown). Values of ½ for all maize lines were extremely low and difficult to measure precisely. Mean ½ values ranged from 0.008 μM to 0.023 μM CO2 and 2-way ANOVA indicated no significant effect of O2. Conversely, normal and NDHO-deficient Arabidopsis leaves showed highly significant, and identical, linear increases in ½ with an O2 level similar to that commonly observed in C3 plants (Laisk and Oja 1998).
NDH Genotype and Dark Reduction of P700+

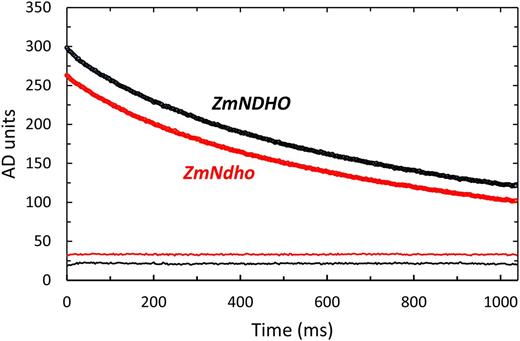
Kinetics of the decline in the in vivo 810-nm absorbance signal for normal and mutant maize. Pre-illuminated leaves were subjected to 10 s of WL (1000 μmol quanta m−2 s−1) followed by 4 s of FRL (50 μmol quanta m−2 s−1) then darkness (time zero in the figure). Data points were recorded at 3-ms intervals. Each trace is an average of six transients. The fine lines at the bottom of the figure are residuals plots displaced from zero for clarity.
Allocation of Linear Electron Flow to O2-Dependent Processes in Maize
Impaired ability to concentrate CO2 in the BSC of maize NDH mutants should be manifested as enhanced photorespiration since Rubisco and the glycolate-metabolizing pathway are confined to this compartment (Edwards and Walker 1983, Majeran et al., 2008, Friso et al., 2010). Although the results of Figure 3 offer no evidence for significant photorespiration (i.e. Warburg effect) in any line, O2-dependent shifts in linear electron transport rate (ETR) have been observed (Peterson 1989, 1990, 1991, 1994), confounding assessments of O2-sensitivity based on CO2 assimilation alone. Chl fluorescence measurements, performed in parallel with CO2 and H2O exchange measurements of Figure 3, enabled independent assessment of PSII photochemical yield [(Fm − Fs)/Fm = ƊF/Fm, Genty et al., 1989]. Two-way ANOVA (O2 versus CO2) indicated that CO2 was consistently the dominant source of variation in ƊF/Fm and Jc (= 4 × A) based on sum-of-squares partitioning. Nevertheless, the main effect of O2 on ƊF/Fm was also statistically significant (P < 0.01) for both ZmNDHO and ZmNdho. However, the sum-of-squares apportioned to O2 was much larger (5.13%) for mutant compared to normal leaves (0.60%). As noted above for A, the main effect of O2 on Jc was not significant (P > 0.05) for either genotype. Results were similar for ZmNDHN and ZmNdhn. This preliminary analysis provided a strong indication of greater allocation of total PSII ETR to photorespiration for the NDH mutants. We next quantified the O2-dependent fraction of total PSII ETR, which enabled estimation of the CO2 level at the Rubisco catalytic sites.

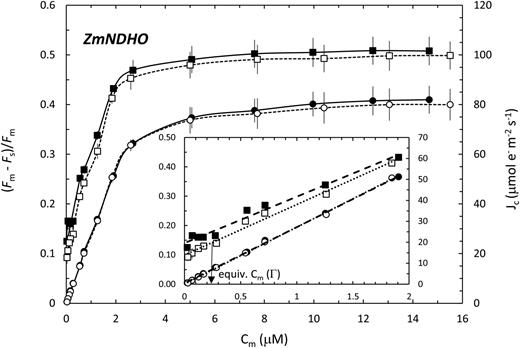
Relationships of Jc (circles) and ƊF/Fm (squares) to Cm for normal maize. Measurements were performed in 2% O2 (white fill) or 21% O2 (black fill). The inset shows the initial portions of the full CO2 response datasets (main panel). The arrow in the inset illustrates how Jo at ½ (21% O2) is estimated from the equivalent Cm (at 2% O2) wherein the associated ƊF/Fm coincides with the y intercept of the 21% O2 plot.

Several relevant features of the CO2-dependencies of ƊF/Fm and Jc (Figs. 5 and 6) are noted. First, under conditions of CO2 limitation, increases in ƊF/Fm and Jc with Cm are linear, which simplifies analysis. Second, the plots of Jc at low and high O2 are virtually coincident and extrapolate to the origin consistent with negligibly low, dark respiration in the light. Third, the slopes of the ƊF/Fm versus C m plots clearly differ and tend to converge as Cm increases, consistent with a CO2-reversal of the O2 effect. Fourth, an extrapolated finite value of ƊF/Fm remains at 2% O2 when Cm = 0, which we ascribe to Ja. Fifth, since CO2-response measurements were conducted at both O2 levels for each test leaf, the analyses of O2-dependent PSII ETR allocation were not subject to leaf-to-leaf or genotypic differences in a 2 (Eq. 2).
The principle behind quantification of allocation of PSII ETR to photorespiration versus net fixation of CO2 is illustrated in the inset to Figure 5. In the special case of the CO2 compensation point (½ ≈ 0.015 μM), the increase in the y intercept of the ƊF/Fm versus Cm plot at 21% O2 versus 2% O2 is an estimate of PSII photochemical yield associated with photorespiratory C-recycling when Jc = 0. Translation of this value to the ƊF/Fm plot at 2% O2 corresponds to a Cm of 0.24 μM. The latter is associated with a Jc of 6.4 µmol e− m−2 s−1, which, in turn, is Jo at ½ (21% O2). The regression fits to the data of Figure 5 were likewise used to generate a continuous profile of Jo (21% O2) up to a Cm of 1.90 μM, where Jc + Jo was 53.8 μmol e− m−2 s−1 and Jo was 2.3 μmol e− m−2 s−1. For ZmNdho (Fig. 6), better fits were obtained using exponential functions. At ½ in 21% O2, Jo was 8.0 μmol e− m−2 s−1, falling to 5.3 µmol e− m−2 s−1 at 1.55 μM CO2. With strict reference to photosynthetic carbon metabolism, we define the ratio of dissipative ETR relative to the total as Jo/(Jc + Jo) = P diss (Peterson 1989, 1990, 1994). Thus, for normal leaves, P diss (in 21% O2) falls from 1.00 at ½ to 0.042 at Cm = 1.90 µM. Interestingly, P diss for the mutant at Cm = 1.55 μM is a significantly higher value of 0.150.

![Relationships of (Jc + Ja)/PAD versus ƊF/Fm at 2% (solid lines) and 21% O2 (dashed lines) for normal and mutant maize. See Figure 5 for definition of symbols. Note the high fidelity of the first- and second-order polynomial regression fits (R 2 = coefficient of determination) to the mean data points and the relatively larger separation between the fits for mutant compared to normal leaves. These fits enable empirical estimation of P diss in 21% O2 by referring the associated ƊF/Fm to the regression equations to evaluate [(Jc + Ja)/PAD]2 and [(Jc + Ja)/PAD]21 (Eq. 3). See text for additional information.](https://oup.silverchair-cdn.com/oup/backfile/Content_public/Journal/plphys/171/1/10.1104_pp.16.00120/2/m_plphys_v171_1_125_f7.jpeg?Expires=1750370000&Signature=umTCEkVPcOtWN5PFoif2w1zkiHWKXifXtYF0GnvvalAjjBZ9mJv6eUx0HvdEzOE3dJrB9~ocS4xkdsmKcjz6I82cO-3O7JmqXZ-0aiTseyhTuWgBYe3rXdPupCE5MX40YCZgi1B-J0a6caM2~tPKoxAk52z0nXU1P05NrVPIrxsIVWtgsRMJlt7H5FD9K-Q3NNnVXRi6pGGXrTazV1s7nzDNTxrvgY8YwEJCt82dVisPtiIZt5ZOJqv9UAG97xyn2SFsjZjwT7xFrEvEyJYiUH0ZJhoferDvmQEz88djg44L0KbRZ0~~~PGrJBELcAcO7Ek5UfEwKfFEJGc2eP2YFA__&Key-Pair-Id=APKAIE5G5CRDK6RD3PGA)
Relationships of (Jc + Ja)/PAD versus ƊF/Fm at 2% (solid lines) and 21% O2 (dashed lines) for normal and mutant maize. See Figure 5 for definition of symbols. Note the high fidelity of the first- and second-order polynomial regression fits (R 2 = coefficient of determination) to the mean data points and the relatively larger separation between the fits for mutant compared to normal leaves. These fits enable empirical estimation of P diss in 21% O2 by referring the associated ƊF/Fm to the regression equations to evaluate [(Jc + Ja)/PAD]2 and [(Jc + Ja)/PAD]21 (Eq. 3). See text for additional information.
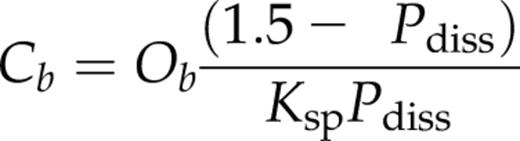
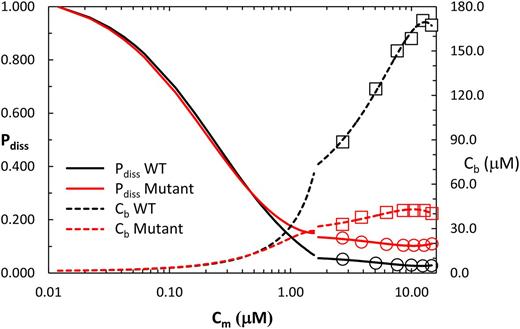
Changes in the fraction of total PSII linear electron transport diverted to photorespiration (P diss, Eq. 3) and the calculated CO2 concentration in the BSC (Cb, Eq. 4) for lines ZmNDHO and ZmNdho. The discontinuity in the traces near Cm of 1.55 μM arises from the different methods used to derive results. Specifically, traces for the lower Cm range were obtained using the approach associated with Figures 5 and 6, where substantial overlap in ƊF/Fm at 2% and 21% O2 occurred for normal and mutant leaves (see text). Data points (circles and squares) at higher measured Cm values were obtained using the regression equations from Figure 7. Note that NDH genotype does not affect P diss at Cm < 0.6 μM. See text for further information.
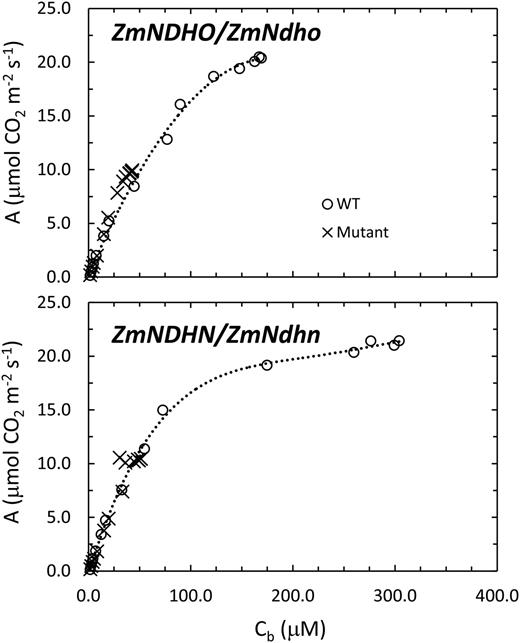
Comparisons of A versus Cb for the maize NDH subunit O and N mutants and associated normal lines.
CO2 Exchange Transients Confirm Elevated Photorespiration in Maize NDH Mutants
We observed that during brief interruptions of actinic WL associated with estimation of Fo, the kinetics of recovery of A once the illumination was restored showed a distinct effect of O2 in the mutant lines only. Figure 10 shows examples of the recovery of A in the light for ZmNDHO and ZmNdho at 2% and 21% O2. Although the extents of change in A differ between these lines, the kinetics of recovery were similar for the mutant at 2% O2 and normal leaves at both O2 levels. However, in 21% O2, the kinetics for the mutant showed a distinct oscillation, resulting in a slower recovery due possibly to reduction of photorespiratory PGA in the MC (Laisk and Edwards 2009). We compared these changes in terms of the transient complementary area (CA) as shown in Figure 10. Transients in CO2 exchange were not detected at Cm < 0.7 μM. Figure 11 shows that CA increased rapidly at higher Cm values, saturating at 4 μM to 6 μM. The ratio of CA in 21% relative to 2% O2 was close to unity for normal leaves over the entire range of Cm investigated. Conversely, this ratio was twice as high for the mutant. Results obtained for the ZmNDHN/ZmNdhn pair were similar to those shown in Figures 10 and 11.
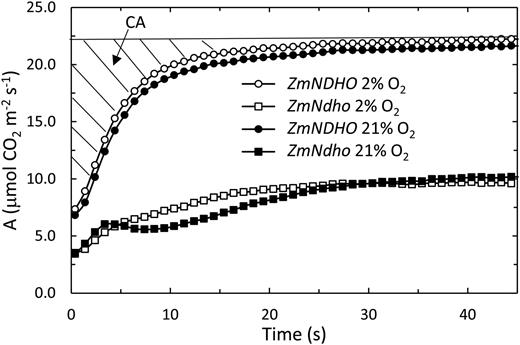
Interactive effects of genotype and O2 level on the time course of A during recovery following a 7 s dark interval. Note the distinctly slower recovery at 21% O2 compared to 2% O2 in the mutant. The complementary area (cross-hatched) is the sum of the difference between the final rate at full recovery and average A over successive 1 s time intervals.
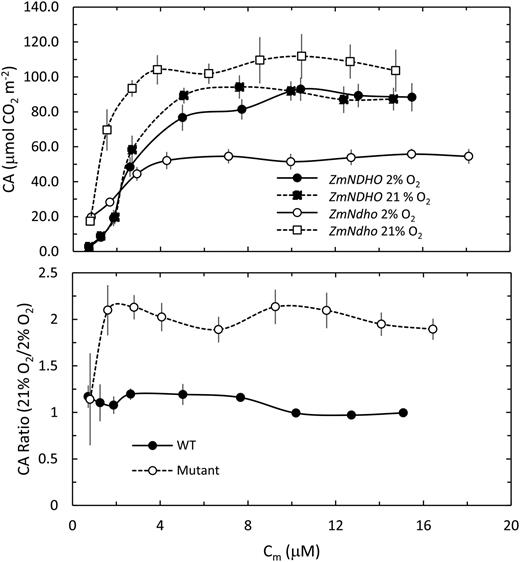
The CA increased with increasing Cm reflecting complex shifts in production of NADPH and ATP relative to consumption of these substrates during the dark-light interval (top panel). Nevertheless, the CA in 21% O2 was generally twice that observed at 2% O2 for the mutant, but relatively unaffected by O2 concentration in normal leaves (bottom panel).
DISCUSSION
Chloroplastic NDH appears to be common in higher plants, but the precise function and regulation of this complex remains obscure. Current opinion holds that NDH catalyzes electron flow from NAD(P)H to PQ in support of a dark respiratory process (chlororespiration) and dissipation of excess stromal reductant (Nixon 2000). Coupling of H+-translocation to NDH turnover has led to a proposed role in PSI-dependent cyclic photophosphorylation (Shikanai et al., 1998, Munekage et al., 2004, Livingston et al., 2010, Ifuku et al., 2011). Numerous phenotypic characterizations in Arabidopsis and tobacco have established that under mild conditions of growth, NDH is dispensable (Burrows et al., 1998, Shikanai et al., 1998, Horváth et al., 2000, Rumeau et al., 2005). Indeed, the most commonly used indicator of loss/impairment of NDH function is the absence/diminution of the post-illumination Fo-rise associated with reduction of the inter-photosystem PQ pool (Fig. 2). A relevant, yet enigmatic, criterion of dispensability relates to the kinetics of reduction of P700+ and PC+ after FRL treatment. Available reports describe only modestly slower decay kinetics for the 810-nm absorbance signal in nonstressed NDH-deficient lines (Burrows et al., 1998, Sazanov et al., 1998, Sirpiö et al., 2009). We observed a slightly higher time constant for decay of the 810-nm signal for the Ndho mutant of Arabidopsis, but were unable to detect any significant effect of NDH mutation in maize (Fig. 4). Assuming that loss of the o- or n-subunit results in a lack of accumulation of the NDH supercomplex (Rumeau et al., 2005, see also results for Arabidopsis in Fig. 2), it is significant that a reduced, yet substantial, Fo-rise persists in the maize mutants (Fig. 2). Together these observations suggest that electrons can flow from the PSI acceptor side to PQ via multiple pathways. This is supported by reports of an Fd-dependent mechanism involving PGR5 in PSI (Munekage et al., 2002, 2004) and a psaE-dependent cyclic pathway (Yu et al., 1993). However, the simple notion of parallel pathways of dark PQ reduction is confounded by report of an Fd-binding site in the NDH complex (Yamamoto et al., 2011) and that, in chloroplast preparations, NDH turnover requires Fd (Munekage et al., 2004, Peng et al., 2009, Suorsa et al., 2009).
In contrast to weak NDH-deficient phenotypes in the C3 systems studied, we observed: (1) slower growth and photosynthesis and reduced pigment levels for maize NDH mutant compared to normal lines (Table I); and (2) significant effects on indicators of PSII function (Table II). Several studies of the effects of water stress (Horváth et al., 2000, Munné-Bosch et al., 2005), temperature stress (Sazanov et al., 1998, Li et al., 2004, Wang et al., 2006), and light stress (Endo et al., 1999) show stronger NDH-deficient phenotypes, consistent with an important role for NDH-dependent cyclic electron flow in production of ATP after stress treatment. Interestingly, stress treatment restored the Fo-rise in NDH-deficient leaves (Sazanov et al., 1998, Munné-Bosch et al., 2005, Wang et al., 2006). The apparent sensitivity of the latter to antimycin A implies that the Fd-dependent PGR5 pathway was active under these conditions (Munné-Bosch et al., 2005). Thus we suggest that the maize NDH-deficient phenotype could be a secondary consequence of the much lower BSC CO2 concentrations attainable for these lines (Fig. 9). Specifically, lower Fv/F md and pigment content is consistent with chronic photooxidative stress associated with excess illumination (Endo et al., 1999). We estimate that growth of the mutant lines in normal air (400 μl CO2 l −1, 21% O2) in this study could be equivalent to growth of normal lines at a CO2 level of 60 to 100 μl CO2 l −1 (Figs. 3 and 9). Lower values of qP (Table II) and ƊF/Fm (Figs. 5–7) for the mutant lines are commonly associated with reduced CO2 assimilation capacity (Peterson 1989, 1990, 1991).
The utility of variable Chl fluorescence as a tool in interpreting downstream changes in CO2 assimilation in maize attests to highly integrated and connected MC/BSC function during photosynthesis such that reduced consumption of ATP and NADPH in the BSC, due to limited CO2 availability, is transmitted to the MC resulting in down-regulation of PSII photochemical yield. Likewise, a close correspondence between CO2 assimilation and oxygenic PSII turnover was observed over a wide range of irradiances and CO2 levels in the C4 NAD-ME species Amaranthus edulis (Kiirats et al., 2002). An unexpected result in this study was the lower mean NPQ (Table II) for the mutants, illustrating that a NDH-dependent H+-translocating cyclic pathway could contribute to ƊpH formation in the MC chloroplast necessary for photoprotective quenching. Alternatively, lower mean steady-state Fv/Fm (and NPQ) values for the mutants (Table II) may not be exclusively associated with lower reversible quenching of Fm, but rather, due in part to increased levels of invariant emission (Fc) resulting from accumulation of nonfunctional PSII units (Peterson et al., 2014).
Plants employing the C4 photosynthetic mechanism typically exhibit O2-insensitive carbon assimilation and very low CO2 compensation points (½) compared to C3 types. Nevertheless, since Rubisco turnover in the BSC is essential to the C4 mechanism, some photorespiration must occur when O2 is present—consistent with the mutual competition between O2 and CO2 at the enzyme active site (Lorimer and Andrews 1973). Indeed, a high level of glycolate oxidase (the initial step in the photorespiratory pathway) is required for survival of Zea mays in normal air (Zelitch et al., 2009). The seeming paradox of a low, O2-independent ½ and occurrence of measureable O2-dependent (and CO2-reversible) linear electron transport reported here for normal and mutant maize can be addressed in terms of the compartmentation inherent in the MC-BSC model. As pointed out by Laisk and Edwards (2000, 2009), under the equilibrium conditions of ½ (i.e. A = 0 and P diss = 1.00) the CO2 level in the BSC equals that which would occur at the same ambient O2 level and temperature in a C3 mesophyll cell. We estimate that at compensation in 21% O2 and 30°C, the CO2 concentration in the BSC is 1.6 μM and essentially zero in the MC. The corresponding linear ETR in the MC of ZmNDHO is 6.4 μmol e− m−2 s−1, equivalent to a maximum potential CO2 fixation rate of 1.6 μmol CO2 m−2 s−1. Thus, the maximal conductance for CO2 diffusion from the BSC to the MC (CO2-overcycling) is only 1.0 mm s−1 (g bsc) and likely to be much smaller, since some of the linear electron flow in the MC could be used for reduction of PGA (Laisk and Edwards 2009). This upper limit for g bsc is less than one-seventh of the magnitude of gm in the MC (Table II). A study with A. edulis mutationally or chemically blocked in C4 cycle function likewise showed conditionally higher rates of O2-dependent PSII linear electron transport (photorespiration) compared to controls and a similarly low conductance to CO2 diffusion from the MC to sites of CO2 fixation by Rubisco in the BSC (Kiirats et al., 2002). Furthermore, in this study Jo at ½ is <0.08 of the CO2-saturated JT (Table I). A corresponding estimate of Jo/JT at ½ in tobacco was at least 0.5 (Peterson 1989). Thus, photorespiration is indeed suppressed in C4 relative to C3 leaves due, in part, to the critical function of the BSC wall in restricting over-cycling of CO2 to the MC (Kiirats et al., 2002).
An important and original result presented here is that photorespiration is elevated in NDH-deficient maize compared to normal maize, over a wide range of MC CO2 levels (Fig. 8). We interpret the lag in recovery of steady-state CO2 assimilation after transient darkening in NDH mutants (Figs. 10 and 11) as diversion of NADPH and ATP from fixation of external CO2 to processing of photorespiratory CO2, PGA, and NH3 (Ogren 1984). Since Rubisco, the Calvin cycle, and the photorespiratory pathway are localized in the BSC (Majeran et al., 2008, Friso et al., 2010), quantification of P diss enabled assessment of Cb in conjunction with Cm. Most important, plots of A versus Cb coincide for normal and mutant siblings (Fig. 9), implying that genotypic differences in A versus Cm (Fig. 3) are fully accounted for in terms of the differing capacities for concentration of CO2 in the BSC. Impaired capacity to generate ATP in the BSC of NDH-deficient maize is associated with depressed processing of MAL by ME due to restricted utilization of product NADPH. This results in slower turnover of the C4 cycle and reduced concentration of CO2 around Rubisco. Despite apparent occurrence of mild photooxidative symptoms in the mutant lines, genotypic differences in gs or gm were respectively minor or absent (Table II). Thus, neither stomatal aperture nor enzymic prerequisites for CO2 assimilation differed substantially in the normal and mutant lines. The question arises as to how NDH enables CO2 accumulation corresponding to respective Cb/Cm molarity ratios of 19 and 37, and equilibrium BSC gas phase CO2 concentrations of approximately 5000 μl l −1 in ZmNDHO and approximately 8700 μl l −1 in ZmNDHN during growth in normal air (12 μM CO2) at 30°C (see Figs. 3 and 9).
Carbon dioxide fixation in the BSC of NADP-ME type C4 species requires 2 ATP for each NADPH consumed (Supplemental Fig. S1; Laisk and Edwards 2000, 2009; Takabayashi et al., 2005). The Laisk-Edwards model postulates a channeled NDH-catalyzed reduction of PQ by NADPH produced by ME turnover. Proton translocation during sequential electron flow from NADPH to PSI, via PQ and cytochrome f, satisfies the BSC ATP/NADPH requirement. However, modest diversion of ATP to non-photosynthetic processes (e.g. protein or starch synthesis) or processing of photorespiratory products in the BSC leads to import of CO2 at a rate slightly faster than the ATP-limited rate of carboxylation of RuBP. Thus, CO2 accumulates until carboxylation of RuBP plus CO2 over-cycling to the MC balances MAL import. The model elegantly explains how a MC-BSC CO2 gradient is sustained in terms of the e−/H+ constraints of ATP and NADPH production balanced to an overall ATP/NADPH utilization ratio of 2.56 (based on the hypothetical example of Supplemental Fig. S1) without the need for PSI cyclic photophosphorylation (Laisk et al., 2005). This contrasts with Takabayashi et al. (2005), who postulated a central role for NDH-dependent cyclic electron flow in the BSC. We point out that the latter model provided no mechanism for balancing the CO2 fluxes in the MC-BSC system, leading to a concentration of CO2 in the BSC. Furthermore, according to this model, a severe ATP deficit could occur in NDH-deficient leaves, leading to an A versus Cb relationship that does not overlap that observed in normal leaves, which is in contrast to results presented here (Fig. 9).
Finally, inability to form an active NDH supercomplex in maize does not completely abolish the capacity for concentration of CO2 in the BSC. Under normal air conditions, the Cb/Cm ratios were still appreciable at approximately 4 and 5.5 for ZmNdho and ZmNdhn, respectively. Nor was PQ reduction activity in the dark diminished in the maize mutants to the extent observed in Arabidopsis mutants (Fig. 2). Although no mechanistic connection between these factors was established in this study, clearly redundancy in the CO2 concentration system of the BSC is present that allows it to function independently of NDH, which may be homologous to the inducible pathways of PQ reduction revealed in C3 plants. Furthermore, maize possesses significant levels of PEPCK (PEP carboxykinase; Koteyeva et al., 2015). Maize leaf PEPCK levels were higher than observed in the C4 NADP-ME species Sorghum bicolor and numerous C4 NAD-ME species but far lower than for the C4 PEPCK species Spartina anglica. PEPCK was reportedly enriched in the BSC of maize and was responsible for Asp (ASP) decarboxylation to principally form PEP in bundle sheath strands (Wingler et al., 1999). Systems analysis of maize gene expression revealed ASP transport as a minor branch of the C4 cycle between the MC and BSC (Pick et al., 2011). The latter authors discussed evidence for environmental or developmental metabolic flexibility in transport of MAL versus ASP, which could shift with patterns of N utilization and PGA reduction. Thus, it would be useful to compare global patterns of gene expression in normal and NDH-deficient maize as a preliminary test of metabolic flexibility. Likewise, it would be interesting to extend studies of NDH-deficiency to other C4 types that harvest radiant energy differently.
MATERIALS AND METHODS
Plant Material
Zea mays seed lines containing putative nuclear NDH gene transposon insertions were obtained from the Maize Genetics Cooperative Stock Center (http://maizecoop.cropsci.uiuc.edu/). The lines were field-grown at Lockwood Farm (The CT Agricultural Experiment Station) in Hamden, CT during the summer of 2014 to genotype individual plants, obtain preliminary phenotypes, and collect progeny seed after selfing. Seed lines UFMu-02153 and AcDs-00112_I.S07.1657 were, respectively, found to segregate Mu7 and Ds transposon insertions into the ZmNDHO (GRMZM2G133844) and ZmNDHN (GRMZM2G110277) loci (Settles et al., 2007, Ahern et al., 2009). Progeny of these lines were studied in the laboratory. Maize was grown in a growth chamber on a 12 h/12 h light/dark 30°/20°C regime at a PFD of 500 μmol quanta m−2 s−1 provided by cool-white fluorescent and incandescent lamps (Peterson et al., 2014). Arabidopsis lines SALK_068922c (Columbia) and ET1999 (Landesberg) were obtained from The Arabidopsis Information Network (https://www.arabidopsis.org). These lines respectively carry a T-DNA insertion into NDHO and a Ds insertion into NDHN. Seedlings were grown on a long-day regime at an irradiance of 130 μmol quanta m−2 s−1 and 23°C (Peterson and Schultes 2014).
DNA Manipulations
Genomic DNA was extracted from maize seedlings using the DNeasy Plant Mini Kit (Qiagen, Hilden, Germany). Fragments corresponding to wild-type sequences were amplified using oligonucleotides NDHN1 (5′ CAATCAAGCGACTCCTCC 3′) and NDHN2 (5′ AAGAAACTAAAGGCGTGCTA 3′) yielding a 453 base-pair (bp) band or NDHOA (5′ AGAAGATCCTCAAGAAGAAGC 3′) and NDHOB (5′ ACTGGCATGTACGTATATACC 3′) yielding a 739-bp band from appropriate lines by PCR. Locus- and transposon-specific (Activator/Dissociator or Mutator) DNA fragments were amplified using oligonucleotides NDHN2 and DsSEQ2 (5′ ACACAACAGCTTGGTGCAAT 3′; Ahern et al., 2009) producing a band of approximately 1 kb or NDHOD (5′ CCCAAGCGATCTGAAATGCA 3′) and TIR8.4 (5′ CGCCTCCATTTCGTCGAATCACCTC 3′; Settles et al., 2007) to produce a 300-bp band, respectively. Genotypes were independently verified using primers NDHOC (5′ CTTCTCCCTCTAGCTCTCGC 3′) and NDHOD; with NDHOD and TIR6 (5′ AGAGAAGCCAACGCCAWCGCCTCYATTTCGTC 3); or NDHN2 and JGp3 (5′ ACCCGACCGGATCGTATCGG 3′) and LC45 (5′ GTGCTGTACTGCTGTGACTTGTG 3′).
Gas Exchange and Optical Methods
Measurements were performed on recently expanded maize leaves at positions ranging from leaf 4 to 9 on plants ranging in age from 21 to 33 d after sowing. Mature rosette leaves of 23- to 30-d-old Arabidopsis plants were likewise employed. Details of the gas exchange and 810-nm absorbance systems (FAST-EST, Tartu, Estonia) and Chl fluorescence (H. Walz, Effeltrich, Germany) apparatus and procedures have been described in Peterson and Schultes (2014) and references therein. Leaf temperatures were 30°C for maize and 23°C for Arabidopsis. The water-jacketed leaf chamber maintained the leaf temperature within ±0.1°C. Dark respiration rate and pre-dawn minimal and maximal fluorescence yields (F od and F md) were recorded after ≥12 h of dark adaptation. Fluorescence signals (>700 nm) were corrected for photosystem I emission (Peterson et al., 2001). Gas concentrations are expressed as volume fractions (% or μl l −1) or equilibrium-dissolved aqueous phase molarities (μM). Responses of net CO2 assimilation rate (A) and transpiration to changes in the external CO2 level (Co) for each maize leaf tested were sequentially assessed at 25, 15, 10, 5, 0, 45, 60, 100, 150, 200, 300, 400, 500, 600, and 700 μl CO2 l −1 in 21% O2 (v/v, balance N2) at an incident white light (400–700 nm) PFD of 750 or 1400 μmol quanta m−2 s−1. This sequence was repeated after lowering the O2 level to 2% (v/v). Minimum (Fo), steady state (Fs), maximal (Fm), and variable (Fv = Fm – Fo) fluorescence yields were measured at each combination of CO2 and O2. Conductances to diffusion of CO2 (expressed as dissolved liquid phase molarity, μM) across the stomatal [gs = A/(Co – Cm), mm s−1] and mesophyll liquid phase plus enzymic (gm = A/Cm at rate-limiting Cm, mm s−1) barriers were assessed according to Laisk et al. (2002). Leaf absorbance of white light was measured on a 2.0-cm2 disc from each test leaf using an integrating sphere.
Pigment Determinations
Individual leaves of Arabidopsis and maize leaf discs (2.0 cm2) were extracted by grinding in acetone. Pigments were quantified spectrophotometrically according to Lichtenthaler and Buschmann (2001).
Supplemental Data
The following supplemental materials are available.
Supplemental Figure S1. A schematic of carbon and energy metabolism in the MC and BSC of maize according to the C4 model of Laisk and Edwards (2000, 2009).
Supplemental Figure S2. Photograph of normal and NDH-deficient maize seedlings.
ACKNOWLEDGMENTS
We thank Agu Laisk for helpful comments on the manuscript.
Glossary
- BSC
bundle sheath cell
- CA
complementary area
- ETR
electron transport rate
- FRL
far red light
- MC
mesophyll cell
- PAD
photosynthetic density
- PSI
photosystem I
- PSII
photosystem II
- WL
white light
LITERATURE CITED
Author notes
This work was supported by Hatch funds to R.B.P., N.P.S., and N.A.M. from the United States Department of Agriculture.
Address correspondence to [email protected]
The author responsible for distribution of materials integral to the findings presented in this article in accordance with the policy described in the Instructions for Authors (www.plantphysiol.org) is: Richard B. Peterson ([email protected]).
R.B.P. led the project, performed gas exchange, fluorescence, 810-nm absorbance measurements, and pigment determinations, analyzed and processed results, and wrote the manuscript; N.P.S. provided guidance on genetic and genomic aspects and performed all the molecular analyses; N.A.M. performed the light microscopy shown in Figure 1; and I.Z. participated in laboratory analyses and provided input into data interpretation involving photorespiration.
Articles can be viewed without a subscription.
