


Abstract
Necrotrophic and biotrophic pathogens are resisted by different plant defenses. While necrotrophic pathogens are sensitive to jasmonic acid (JA)-dependent resistance, biotrophic pathogens are resisted by salicylic acid (SA)- and reactive oxygen species (ROS)-dependent resistance. Although many pathogens switch from biotrophy to necrotrophy during infection, little is known about the signals triggering this transition. This study is based on the observation that the early colonization pattern and symptom development by the ascomycete pathogen Plectosphaerella cucumerina (P. cucumerina) vary between inoculation methods. Using the Arabidopsis (Arabidopsis thaliana) defense response as a proxy for infection strategy, we examined whether P. cucumerina alternates between hemibiotrophic and necrotrophic lifestyles, depending on initial spore density and distribution on the leaf surface. Untargeted metabolome analysis revealed profound differences in metabolic defense signatures upon different inoculation methods. Quantification of JA and SA, marker gene expression, and cell death confirmed that infection from high spore densities activates JA-dependent defenses with excessive cell death, while infection from low spore densities induces SA-dependent defenses with lower levels of cell death. Phenotyping of Arabidopsis mutants in JA, SA, and ROS signaling confirmed that P. cucumerina is differentially resisted by JA- and SA/ROS-dependent defenses, depending on initial spore density and distribution on the leaf. Furthermore, in situ staining for early callose deposition at the infection sites revealed that necrotrophy by P. cucumerina is associated with elevated host defense. We conclude that P. cucumerina adapts to early-acting plant defenses by switching from a hemibiotrophic to a necrotrophic infection program, thereby gaining an advantage of immunity-related cell death in the host.
Plant pathogens are often classified as necrotrophic or biotrophic, depending on their infection strategy (Glazebrook, 2005; Nishimura and Dangl, 2010). Necrotrophic pathogens kill living host cells and use the decayed plant tissue as a substrate to colonize the plant, whereas biotrophic pathogens parasitize living plant cells by employing effector molecules that suppress the host immune system (Pel and Pieterse, 2013). Despite this binary classification, the majority of pathogenic microbes employ a hemibiotrophic infection strategy, which is characterized by an initial biotrophic phase followed by a necrotrophic infection strategy at later stages of infection (Perfect and Green, 2001). The pathogenic fungi Magnaporthe grisea, Sclerotinia sclerotiorum, and Mycosphaerella graminicola, the oomycete Phytophthora infestans, and the bacterial pathogen Pseudomonas syringae are examples of hemibiotrophic plant pathogens (Perfect and Green, 2001; Koeck et al., 2011; van Kan et al., 2014; Kabbage et al., 2015).
Despite considerable progress in our understanding of plant resistance to necrotrophic and biotrophic pathogens (Glazebrook, 2005; Mengiste, 2012; Lai and Mengiste, 2013), recent debate highlights the dynamic and complex interplay between plant-pathogenic microbes and their hosts, which is raising concerns about the use of infection strategies as a static tool to classify plant pathogens. For instance, the fungal genus Botrytis is often labeled as an archetypal necrotroph, even though there is evidence that it can behave as an endophytic fungus with a biotrophic lifestyle (van Kan et al., 2014). The rice blast fungus Magnaporthe oryzae, which is often classified as a hemibiotrophic leaf pathogen (Perfect and Green, 2001; Koeck et al., 2011), can adopt a purely biotrophic lifestyle when infecting root tissues (Marcel et al., 2010). It remains unclear which signals are responsible for the switch from biotrophy to necrotrophy and whether these signals rely solely on the physiological state of the pathogen, or whether host-derived signals play a role as well (Kabbage et al., 2015).
The plant hormones salicylic acid (SA) and jasmonic acid (JA) play a central role in the activation of plant defenses (Glazebrook, 2005; Pieterse et al., 2009, 2012). The first evidence that biotrophic and necrotrophic pathogens are resisted by different immune responses came from Thomma et al. (1998), who demonstrated that Arabidopsis (Arabidopsis thaliana) genotypes impaired in SA signaling show enhanced susceptibility to the biotrophic pathogen Hyaloperonospora arabidopsidis (formerly known as Peronospora parastitica), while JA-insensitive genotypes were more susceptible to the necrotrophic fungus Alternaria brassicicola. In subsequent years, the differential effectiveness of SA- and JA-dependent defense mechanisms has been confirmed in different plant-pathogen interactions, while additional plant hormones, such as ethylene, abscisic acid (ABA), auxins, and cytokinins, have emerged as regulators of SA- and JA-dependent defenses (Bari and Jones, 2009; Cao et al., 2011; Pieterse et al., 2012). Moreover, SA- and JA-dependent defense pathways have been shown to act antagonistically on each other, which allows plants to prioritize an appropriate defense response to attack by biotrophic pathogens, necrotrophic pathogens, or herbivores (Koornneef and Pieterse, 2008; Pieterse et al., 2009; Verhage et al., 2010).
In addition to plant hormones, reactive oxygen species (ROS) play an important regulatory role in plant defenses (Torres et al., 2006; Lehmann et al., 2015). Within minutes after the perception of pathogen-associated molecular patterns, NADPH oxidases and apoplastic peroxidases generate early ROS bursts (Torres et al., 2002; Daudi et al., 2012; O’Brien et al., 2012), which activate downstream defense signaling cascades (Apel and Hirt, 2004; Torres et al., 2006; Miller et al., 2009; Mittler et al., 2011; Lehmann et al., 2015). ROS play an important regulatory role in the deposition of callose (Luna et al., 2011; Pastor et al., 2013) and can also stimulate SA-dependent defenses (Chaouch et al., 2010; Yun and Chen, 2011; Wang et al., 2014; Mammarella et al., 2015). However, the spread of SA-induced apoptosis during hyperstimulation of the plant immune system is contained by the ROS-generating NADPH oxidase RBOHD (Torres et al., 2005), presumably to allow for the sufficient generation of SA-dependent defense signals from living cells that are adjacent to apoptotic cells. Nitric oxide (NO) plays an additional role in the regulation of SA/ROS-dependent defense (Trapet et al., 2015). This gaseous molecule can stimulate ROS production and cell death in the absence of SA while preventing excessive ROS production at high cellular SA levels via S-nitrosylation of RBOHD (Yun et al., 2011). Recently, it was shown that pathogen-induced accumulation of NO and ROS promotes the production of azelaic acid, a lipid derivative that primes distal plants for SA-dependent defenses (Wang et al., 2014). Hence, NO, ROS, and SA are intertwined in a complex regulatory network to mount local and systemic resistance against biotrophic pathogens. Interestingly, pathogens with a necrotrophic lifestyle can benefit from ROS/SA-dependent defenses and associated cell death (Govrin and Levine, 2000). For instance, Kabbage et al. (2013) demonstrated that S. sclerotiorum utilizes oxalic acid to repress oxidative defense signaling during initial biotrophic colonization, but it stimulates apoptosis at later stages to advance necrotrophic colonization. Moreover, SA-induced repression of JA-dependent resistance not only benefits necrotrophic pathogens but also hemibiotrophic pathogens after having switched from biotrophy to necrotrophy (Glazebrook, 2005; Pieterse et al., 2009, 2012).
Plectosphaerella cucumerina ((P. cucumerina, anamorph Plectosporum tabacinum) anamorph Plectosporum tabacinum) is a filamentous ascomycete fungus that can survive saprophytically in soil by decomposing plant material (Palm et al., 1995). The fungus can cause sudden death and blight disease in a variety of crops (Chen et al., 1999; Harrington et al., 2000). Because P. cucumerina can infect Arabidopsis leaves, the P. cucumerina-Arabidopsis interaction has emerged as a popular model system in which to study plant defense reactions to necrotrophic fungi (Berrocal-Lobo et al., 2002; Ton and Mauch-Mani, 2004; Carlucci et al., 2012; Ramos et al., 2013). Various studies have shown that Arabidopsis deploys a wide range of inducible defense strategies against P. cucumerina, including JA-, SA-, ABA-, and auxin-dependent defenses, glucosinolates (Tierens et al., 2001; Sánchez-Vallet et al., 2010; Gamir et al., 2014; Pastor et al., 2014), callose deposition (García-Andrade et al., 2011; Gamir et al., 2012, 2014; Sánchez-Vallet et al., 2012), and ROS (Tierens et al., 2002; Sánchez-Vallet et al., 2010; Barna et al., 2012; Gamir et al., 2012, 2014; Pastor et al., 2014). Recent metabolomics studies have revealed large-scale metabolic changes in P. cucumerina-infected Arabidopsis, presumably to mobilize chemical defenses (Sánchez-Vallet et al., 2010; Gamir et al., 2014; Pastor et al., 2014). Furthermore, various chemical agents have been reported to induce resistance against P. cucumerina. These chemicals include β-amino-butyric acid, which primes callose deposition and SA-dependent defenses, benzothiadiazole (BTH or Bion; Görlach et al., 1996; Ton and Mauch-Mani, 2004), which activates SA-related defenses (Lawton et al., 1996; Ton and Mauch-Mani, 2004; Gamir et al., 2014; Luna et al., 2014), JA (Ton and Mauch-Mani, 2004), and ABA, which primes ROS and callose deposition (Ton and Mauch-Mani, 2004; Pastor et al., 2013). However, among all these studies, there is increasing controversy about the exact signaling pathways and defense responses contributing to plant resistance against P. cucumerina. While it is clear that JA and ethylene contribute to basal resistance against the fungus, the exact roles of SA, ABA, and ROS in P. cucumerina resistance vary between studies (Thomma et al., 1998; Ton and Mauch-Mani, 2004; Sánchez-Vallet et al., 2012; Gamir et al., 2014).
This study is based on the observation that the disease phenotype during P. cucumerina infection differs according to the inoculation method used. We provide evidence that the fungus follows a hemibiotrophic infection strategy when infecting from relatively low spore densities on the leaf surface. By contrast, when challenged by localized host defense to relatively high spore densities, the fungus switches to a necrotrophic infection program. Our study has uncovered a novel strategy by which plant-pathogenic fungi can take advantage of the early immune response in the host plant.
RESULTS
Different Disease Phenotypes by P. cucumerina after Droplet and Spray Inoculation
P. cucumerina spore suspensions of similar density (106 spores mL−1) were applied as droplets or spray onto leaves of 5-week-old Arabidopsis, after which disease symptoms were monitored over an 11-d period. Although similar amounts of inoculum were applied to droplet- and spray-inoculated leaves (Supplemental Fig. S1), disease phenotypes differed markedly between both inoculation methods (Supplemental Fig. S2). Droplet-inoculated leaves started developing localized necrosis under the sites of inoculum application between 5 and 7 d after inoculation, followed by the occurrence of a chlorotic halo around the slowly expanding central necrosis (Fig. 1A; Supplemental Fig. S2). Before the onset of macroscopic symptoms at 4 d after droplet inoculation, microscopy analysis of Trypan Blue-stained leaves revealed that fungal colonization coincided with single cell death, which progressed into widespread cell death and tissue necrosis by 7 dai (Fig. 1B). This cell death-associated colonization pattern is consistent with a necrotrophic lifestyle of the fungus. When spores were applied by spray inoculation, leaves developed small water-soaked lesions by 5 dai, which progressed into extensive chlorosis and necrosis between 7 and 11 dai (Fig. 1B). Interestingly, fungal colonization at 4 d after spray inoculation extended beyond the water-soaked lesions and was not associated with cell death (Fig. 1B). At 7 d after spray inoculation, fungal colonization in spray-inoculated leaves increasingly coincided with cell death, although still to a lower extent than observed at local sites of droplet-inoculated leaves (Fig. 1B). Hence, colonization patterns by droplet- and spray-inoculated P. cucumerina differ during the earlier stages (4 dai), whereas colonization at later stages (7 dai) coincides with cell death and necrosis, irrespective of inoculation method. Consequently, subsequent experiments to assess Arabidopsis resistance against P. cucumerina were performed at 7 dai and were based on quantifications of necrotic lesion diameters and numbers of necrotic leaves after droplet and spray inoculation, respectively.

Disease phenotypes after droplet and spray inoculation of 5-week-old Arabidopsis with P. cucumerina spores (106 spores mL−1). A, Disease progression in droplet- and spray-inoculated leaves at different days after inoculation (dai). B, Hyphal colonization and cell death in Trypan Blue-stained leaves at 4 and 7 d after droplet and spray inoculation. Red arrows indicate cell death.
Droplet and Spray Inoculation of P. cucumerina Elicit Distinct Plant Metabolic Profiles
To determine global metabolome patterns preceding the differential disease phenotypes of droplet- and spray-inoculated leaves, we performed broad-spectrum metabolic profiling by matrix-assisted laser-desorption ionization-quadrupole-time of flight (MALDI-Q-TOF) mass spectrometry. This method enables accurate mass-to-charge ratio (m/z) detection from a wide range of plant metabolites (Ye et al., 2013; Ernst et al., 2014). In order to account for early metabolic signaling events, leaves were collected at the early time point of 2 dai. Methanol extracts from four biologically replicated leaf samples were analyzed in negative (MALDI−) and positive (MALDI+) ionization mode in order to account for both anion- and cation-forming metabolites. Ions (m/z) showing statistically significant responses to infection treatment (ANOVA; P < 0.01) ranged from 5% in MALDI− to 8.7% in MALDI+, out of a total of 7,046 and 34,171 detected ions, respectively (Fig. 2). PCA of statistically significant ions between treatments showed a clear separation between inoculation methods in both ionization modes (Fig. 2). Furthermore, bidirectional orthogonal partial least square discriminant analysis (O2PLS-DA) prior to statistical filtering yielded similar separation patterns between treatments (Supplemental Fig. S3). Because O2PLS-DA constitutes a supervised multivariate analysis that projects predictive variation between treatments, we also carried out unsupervised PCA of unfiltered data to obtain a measure of global metabolic impacts of treatments (Supplemental Fig. S4). Although PCA of MALDI+ data only showed separation of samples from spray-inoculated plants, PCA of MALDI− data revealed separation between all treatments (Supplemental Fig. S4). In the latter case, pathogen-inoculated samples showed the strongest separation between droplet and spray application in comparison with the corresponding mock-inoculated samples (Supplemental Fig. S4). This indicates that the major metabolic impacts are caused by differential pathogen effects between the inoculation methods, rather than the different inoculation methods themselves. Subsequently, we performed a two-way ANOVA (P < 0.01) of the entire data set in order to identify ions displaying a statistically significant interaction between inoculation method and P. cucumerina, yielding 115 and 704 ions in MALDI− and MALDI+, respectively. This selection of ions represents the fraction of metabolites that responds differently to droplet and spray inoculation with P. cucumerina, which was retained for further analysis.
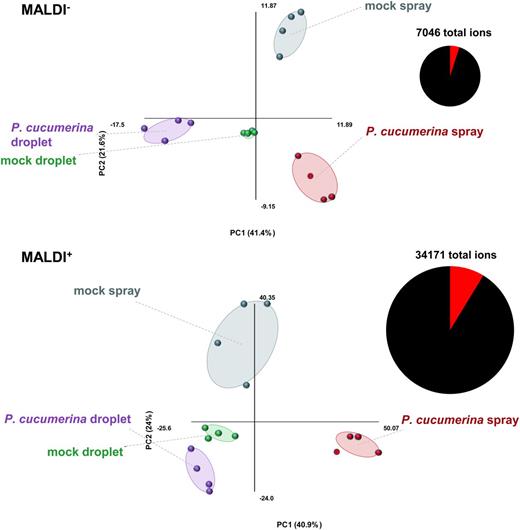
Metabolic profiling by MALDI-Q-TOF analysis of P. cucumerina-infected Arabidopsis leaves following spray and droplet inoculation. Principal component analysis (PCA) of ions (m/z values) that show a statistically significant difference between treatments (n = 4; ANOVA, P < 0.01). Five-week-old leaves were collected at 2 d after mock or P. cucumerina inoculation (106 spores mL−1). Leaf extracts were analyzed by MALDI-Q-TOF in negative (MALDI−) and positive (MALDI+) ionization mode. Pie charts show statistically significant (red) and nonsignificant (black) fractions of all detected ions. Each data point in the PCA plots represents the profile of one biologically replicated sample, which was derived from the average of six technical replicates. Percentages of variation explained by each principal component (PC) are shown in parentheses.
Metabolic Pathway Reconstruction of Droplet- and Spray-Inoculated Leaves
The relatively soft ionization by matrix-assisted laser-desorption ionization (MALDI) in combination with accurate mass detection by quadrupole-time of flight allows for the putative identification of metabolites. To characterize the selection of 819 differentially produced ions between droplet- and spray-inoculated leaves, m/z values were corrected for adducts and carbon isotopes using MarVis software (Kaever et al., 2012; Gamir et al., 2014; Pastor et al., 2014). Hierarchical cluster analysis of corresponding mass predictions confirmed the contrasting intensity profiles between droplet and spray inoculation (Supplemental Fig. S5). Although the identity of single ions remains uncertain, when two or more putative compounds map to the same metabolic pathway, this represents a plausible case for differential activity of this pathway. Therefore, we only selected compounds for which there was at least one other compound mapping to the same plant-specific metabolic pathway. Putative identities were obtained by cross referencing predicted masses against publicly available databases (ChemSpider, METLIN, MassBank, PubChem, KEGG, AraCyc, and MetaCyc; Smith et al., 2005; Williams, 2008; Horai et al., 2010), after which ions with a relatively high mass accuracy fit (0.05 D) were retained for fold change analysis (Table I; Supplemental Fig. S6; Supplemental Table S1). The analysis annotated three ions to JA metabolism (JA, m−H: 209.9645; 12-oxo-phytodienoic acid [OPDA], m+H: 293.1700; and jasmonyl-isoleucine [JA-Ile], m+H: 324.2425), which all showed statistically significant levels of induction after droplet inoculation but not after spray inoculation (Table I; Supplemental Fig. S6). Hence, droplet inoculation with P. cucumerina boosts JA biosynthesis, which is consistent with the notion that the fungus follows a necrotrophic infection strategy. Conversely, spray inoculation induced two ions matching different SA derivatives (salicyl alcohol/catechol monomethyl ether, m+H: 125.0156; and benzoic acid/salicyl aldehyde, m−H: 121.0451) and 10 ions corresponding to different glucosinolate-related metabolites (Table I; Supplemental Fig. S6; Supplemental Table S1). Nine of these ions were detected in MALDI− mode and identified as (intermediates of) aliphatic glucosinolates (Botting et al., 2002). The analysis in MALDI+ mode identified one additional breakdown product of indole-derived glucosinolates (indole-3-acetonitrile, m+H: 157.1203). The fact that multiple ions could be assigned to either SA or glucosinolate metabolism indicates that spray-inoculated P. cucumerina enhances the activity of SA- and glucosinolate-related metabolism. This host defense profile is consistent with a (hemi)biotrophic infection strategy by the fungus (Glazebrook, 2005; Bednarek et al., 2009).
Pathway reconstruction of m/z values that respond differently to droplet and spray inoculation with P. cucumerina
| Accurate m/z Valuea | Adduct | Predicted Massb | Putative Compound | Pathwayc | Fold Change, Dropletd | Fold Change, Sprayd | VIP Rankinge |
|---|---|---|---|---|---|---|---|
| 450.0536 | m−H | 451.0641 | 5-Methylsulfinylpentyl glucosinolate | GS | 0.10 | 7.89 | 36 |
| 462.0879 | m−H | 463.0952 | 7-Methylthioheptyl glucosinolate | GS | NI | 25.61 | 61 |
| 428.1081 | m−H | 427.1087 | 7-Octenyl glucosinolate | GS | 0.10 | 6.27 | 135 |
| 476.1009 | m−H | 477.1161 | 8-Methylthiooctyl glucosinolate | GS | NI | 489.39 | 16 |
| 434.0212 | m−H | 435.0285 | Glucoberteroin | GS | 0.08 | 400.96 | 136 |
| 420.0445 | m−H | 421.0518 | Glucoerucin | GS | 0.07 | 491.81 | 9 |
| 492.0947 | m−H | 493.1020 | Glucohirsutin | GS | NI | 14.87 | 10 |
| 436.0375 | m−H | 437.0448 | Glucoraphanin | GS | 0.11 | 7.19 | 2 |
| 388.0424 | m−H | 389.0497 | Progoitrin | GS | 0.02 | 447.61 | 1,028 |
| 157.1203 | m+H | 156.1130 | 3-Indoleacetonitrile | GS | NI | 11.66 | 905 |
| 293.1700 | m+H | 292.1627 | 12-OPDA | JA metabolism | 19,640.00 | NI | 788 |
| 209.9645 | m−H | 210.9718 | JA | JA metabolism | 4.23 | NI | 15 |
| 324.2425 | m+H | 323.2352 | JA-Ile | JA signaling | 55.09 | NI | 303 |
| 125.0156 | m+H | 124.0083 | Salicyl alcohol/catechol monomethyl ether | SA degradation | 0.32 | 2,933.40 | 4,962 |
| 121.0451 | m−H | 122.0524 | Benzoic acid/salicyl aldehyde | SA metabolism | 0.04 | 435.41 | 244 |
The m/z values were detected by MALDI-Q-TOF analysis. Values were selected (1) when showing a statistically significant interaction between inoculation method and P. cucumerina and (2) if at least one additional mass prediction could be annotated to the same metabolic pathway. bThe m/z values were corrected for adducts and/or for carbon isotopes (m/z tolerance = 0.05 D) using MarVis software. cMass predictions were cross referenced against publicly available databases (ChemSpider, METLIN, MassBank, PubChem, KEGG, AraCyc, and MetaCyc) and selected at a mass accuracy fit of 0.05 D. GS, Glucosinolates. dFold change values of m/z values were determined using MetaboAnalyst software. NI, No statistically significant induction or repression by P. cucumerina. eVIP, Variable importance for projection ranking, derived from the loading plot of the O2PLS-DA analysis (Supplemental Fig. S3).
| Accurate m/z Valuea | Adduct | Predicted Massb | Putative Compound | Pathwayc | Fold Change, Dropletd | Fold Change, Sprayd | VIP Rankinge |
|---|---|---|---|---|---|---|---|
| 450.0536 | m−H | 451.0641 | 5-Methylsulfinylpentyl glucosinolate | GS | 0.10 | 7.89 | 36 |
| 462.0879 | m−H | 463.0952 | 7-Methylthioheptyl glucosinolate | GS | NI | 25.61 | 61 |
| 428.1081 | m−H | 427.1087 | 7-Octenyl glucosinolate | GS | 0.10 | 6.27 | 135 |
| 476.1009 | m−H | 477.1161 | 8-Methylthiooctyl glucosinolate | GS | NI | 489.39 | 16 |
| 434.0212 | m−H | 435.0285 | Glucoberteroin | GS | 0.08 | 400.96 | 136 |
| 420.0445 | m−H | 421.0518 | Glucoerucin | GS | 0.07 | 491.81 | 9 |
| 492.0947 | m−H | 493.1020 | Glucohirsutin | GS | NI | 14.87 | 10 |
| 436.0375 | m−H | 437.0448 | Glucoraphanin | GS | 0.11 | 7.19 | 2 |
| 388.0424 | m−H | 389.0497 | Progoitrin | GS | 0.02 | 447.61 | 1,028 |
| 157.1203 | m+H | 156.1130 | 3-Indoleacetonitrile | GS | NI | 11.66 | 905 |
| 293.1700 | m+H | 292.1627 | 12-OPDA | JA metabolism | 19,640.00 | NI | 788 |
| 209.9645 | m−H | 210.9718 | JA | JA metabolism | 4.23 | NI | 15 |
| 324.2425 | m+H | 323.2352 | JA-Ile | JA signaling | 55.09 | NI | 303 |
| 125.0156 | m+H | 124.0083 | Salicyl alcohol/catechol monomethyl ether | SA degradation | 0.32 | 2,933.40 | 4,962 |
| 121.0451 | m−H | 122.0524 | Benzoic acid/salicyl aldehyde | SA metabolism | 0.04 | 435.41 | 244 |
The m/z values were detected by MALDI-Q-TOF analysis. Values were selected (1) when showing a statistically significant interaction between inoculation method and P. cucumerina and (2) if at least one additional mass prediction could be annotated to the same metabolic pathway. bThe m/z values were corrected for adducts and/or for carbon isotopes (m/z tolerance = 0.05 D) using MarVis software. cMass predictions were cross referenced against publicly available databases (ChemSpider, METLIN, MassBank, PubChem, KEGG, AraCyc, and MetaCyc) and selected at a mass accuracy fit of 0.05 D. GS, Glucosinolates. dFold change values of m/z values were determined using MetaboAnalyst software. NI, No statistically significant induction or repression by P. cucumerina. eVIP, Variable importance for projection ranking, derived from the loading plot of the O2PLS-DA analysis (Supplemental Fig. S3).
Differential Induction of SA- and JA-Dependent Defenses in Spray- and Droplet-Inoculated Leaves
To confirm the differential involvement of SA and JA in plant defense to spray- and droplet-inoculated P. cucumerina, we quantified levels of JA and SA at 2 and 5 dai by ultra-performance liquid chromatography-quadrupole time of flight-tandem mass spectrometry (UPLC-Q-TOF-MS/MS; Glauser et al., 2014). In agreement with our MALDI-Q-TOF results (Table I), droplet-inoculated P. cucumerina enhanced endogenous JA levels, whereas spray-inoculated P. cucumerina enhanced SA levels (Fig. 3A). Although not statistically significant (P = 0.063, Student’s t test), spray inoculation weakly stimulated JA production at 5 dai, suggesting that the pathogen is switching to a necrotrophic infection program at this stage of infection. To test whether the differential production of JA and SA translates to downstream defense gene expression, we quantified induction levels of JA- and SA-inducible marker genes at 2 and 5 dai, using reverse transcription-quantitative PCR analysis. At 2 dai, spray-inoculated P. cucumerina significantly induced the transcription of the SA-dependent genes PR1, PR5, WRKY70 (Li et al., 2004), and ICS1 (Wildermuth et al., 2001; Fig. 3B; Supplemental Fig. S7). Conversely, droplet-inoculated P. cucumerina induced PR1 expression to significantly lower levels and failed to induce PR5, WRKY70, and ICS1 (Fig. 3B; Supplemental Fig. S7). At 5 dai, droplet-inoculated P. cucumerina induced the expression of the JA-dependent marker gene VSP2, whereas spray inoculation failed to induce this gene at either time point (Fig. 3B). Remarkably, the relatively strong induction of PR1 and WRKY70 at 2 d after spray inoculation was severely reduced by 5 dai (Fig. 3B), despite the fact that SA levels had increased further (Fig. 3A). This incongruity between SA accumulation and SA response suggests suppression of the SA response by spray-inoculated P. cucumerina.
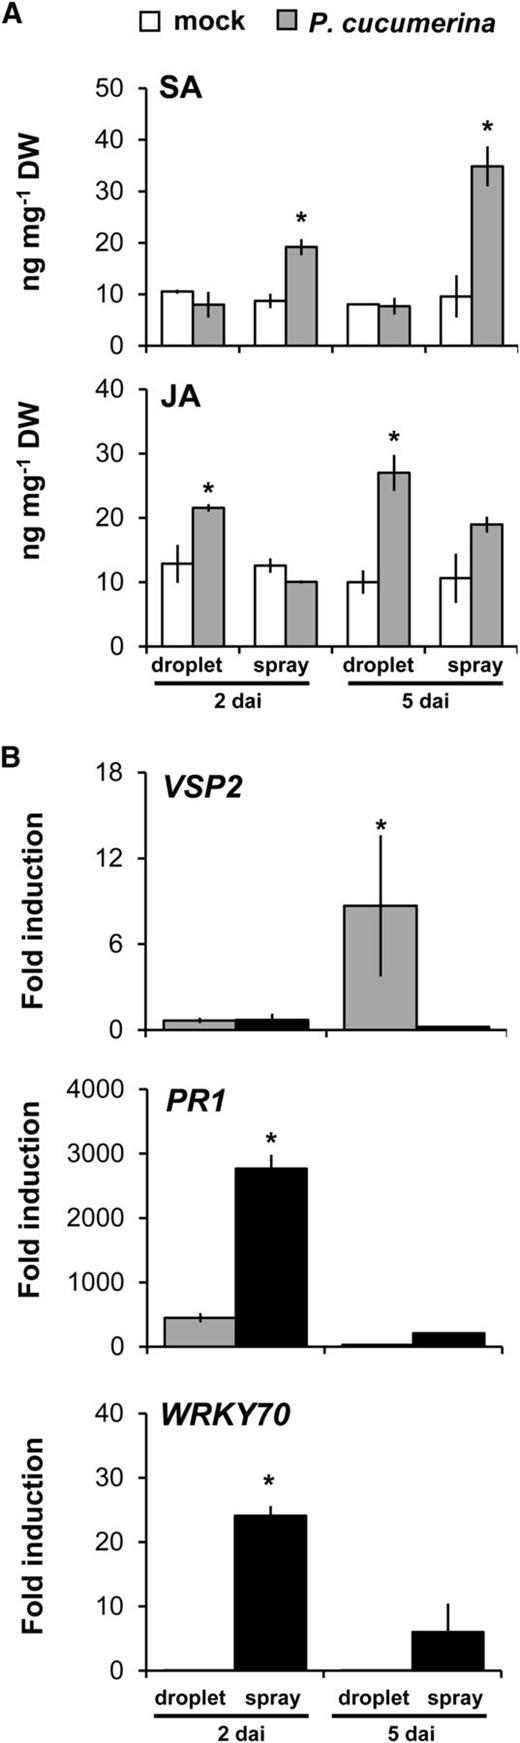
Production and activity of SA and JA in droplet- and spray-inoculated leaves. A, UPLC-Q-TOF-MS/MS quantification of SA and JA in leaves from 5-week-old plants at 2 and 5 dai. Shown are average values ± sd in ng g−1 dry weight (DW; n = 4). Asterisks indicate statistically significant differences relative to corresponding mock treatments (Student’s t test, α = 0.05). B, Reverse transcription-quantitative PCR analysis of JA-dependent transcription of VSP2 and SA-dependent transcription of PR1 and WRKY70 in P. cucumerina-inoculated leaves at 2 and 5 dai. Data represent average fold induction values ± sd (n = 4) relative to transcription levels in mock-treated leaves. Asterisks indicate statistically significant differences in gene induction between droplet- and spray-inoculated leaves (Student’s t test, α = 0.05).
The Effectiveness of SA-Induced Defense against P. cucumerina Depends on Inoculation Method
Treatment of Arabidopsis with JA enhances basal resistance against necrotrophic pathogens, whereas application of SA, or its functional analog BTH (Görlach et al., 1996), induces resistance against biotrophic pathogens (Ton et al., 2002). To test whether the observed differences in SA and JA elicitation after spray and droplet inoculation with P. cucumerina (Fig. 3) relate to the differential effectiveness of the corresponding defense responses, 5-week-old plants were soil drenched with water, 100 µm JA, or 300 µm BTH and inoculated 2 d later (Fig. 4). Pretreatment with JA induced a statistically significant reduction of lesion diameter at 7 d after droplet inoculation, which is consistent with the notion that P. cucumerina follows a necrotrophic lifestyle. Conversely, pretreatment with BTH failed to reduce lesion diameter (Fig. 4A). Both JA and BTH were effective in reducing the number of diseased leaves following spray inoculation with P. cucumerina (Fig. 4B). This indicates that JA- and SA-inducible defenses are effective against spray-inoculated P. cucumerina, which is consistent with a hemibiotrophic lifestyle by the fungus.
![Quantification of BTH- and JA-induced resistance in wild-type Arabidopsis (Columbia-0 [Col-0]) against P. cucumerina following spray (A) or droplet (B) inoculation. Five-week-old plants were soil drenched with water (Control), BTH (300 µm), or JA (100 µm). Two days after chemical treatments, plants were inoculated with P. cucumerina (106 spores mL−1). Symptoms were quantified at 7 dai by lesion diameter (A) or percentage of diseased leaves (B). Values shown represent means ± sd (n = 6–12). Different letters represent statistically significant differences between conditions (Student’s t test, α = 0.05).](https://oup.silverchair-cdn.com/oup/backfile/Content_public/Journal/plphys/170/4/10.1104_pp.15.00551/3/m_plphys_v170_4_2325_f4.jpeg?Expires=1749478647&Signature=38g~AXxoAOzpx2xubiWKPDa1NmWVxnt5-J24DT1huociaD5fIURvKiFRX3ZIxLHZB8RlyYcdVcpmc1c4izOT63V6GTBM4ocrqkQp5b7ffhHb7MP0tajPl9L9VuXC2qF1GSDr5ilsxD1tlW9GqvGJbA-dR3coQhswltPSiRpMd2lbPkqtcS8bswyG0hWBHeTmqHn78~YMCWfzvM8-frkp~zqLgarZbY~yDiAcMKiuhNX56XBk4wxNUBw~Bsw0h-rQW1lHYn8LHuLEISKuG9fDvUVx~JNfQCdJheRpq5zWGjVC5HjUiTrBdS-lvZVtZGicoJ0-s2ccQVoXRODCKJybJw__&Key-Pair-Id=APKAIE5G5CRDK6RD3PGA)
Quantification of BTH- and JA-induced resistance in wild-type Arabidopsis (Columbia-0 [Col-0]) against P. cucumerina following spray (A) or droplet (B) inoculation. Five-week-old plants were soil drenched with water (Control), BTH (300 µm), or JA (100 µm). Two days after chemical treatments, plants were inoculated with P. cucumerina (106 spores mL−1). Symptoms were quantified at 7 dai by lesion diameter (A) or percentage of diseased leaves (B). Values shown represent means ± sd (n = 6–12). Different letters represent statistically significant differences between conditions (Student’s t test, α = 0.05).
The Intensity of Callose Deposition and Cell Death Depends on P. cucumerina Spore Density
To further characterize the differential immune response to droplet- and spray-inoculated P. cucumerina, we quantified callose deposition at 3 dai using Aniline Blue staining. Droplet-inoculated leaves showed dramatically higher levels of callose deposition than spray-inoculated leaves, in which levels of callose were just marginally higher than in mock-inoculated leaves (Fig. 5A). Furthermore, the relatively high callose deposition at the sites of droplet inoculation were spreading to the surrounding leaf tissues, suggesting spatially active defense signaling (Fig. 5A). To link the differential callose response to numbers of germinating fungal spores on the leaf surface, leaves were double stained with Aniline Blue and Calcofluor at 3 dai. Despite using similar inoculum densities of 106 spores mL−1, droplet inoculation resulted in a 15-fold higher spore density on the leaf surface compared with spray inoculation (Fig. 5B; Supplemental Fig. S8). Hence, localized application of relatively high spore densities after droplet inoculation elicits high levels of callose deposition, whereas application of evenly distributed spores at lower density after spray inoculation elicits relatively low levels of callose elicitation. Consistent with the outcome of PR1 and WRKY70 gene expression profiling (Fig. 3B), these results suggest that spray-inoculated P. cucumerina suppresses plant immune responses, which is characteristic of biotrophic infections (Glazebrook, 2005; Dou and Zhou, 2012).
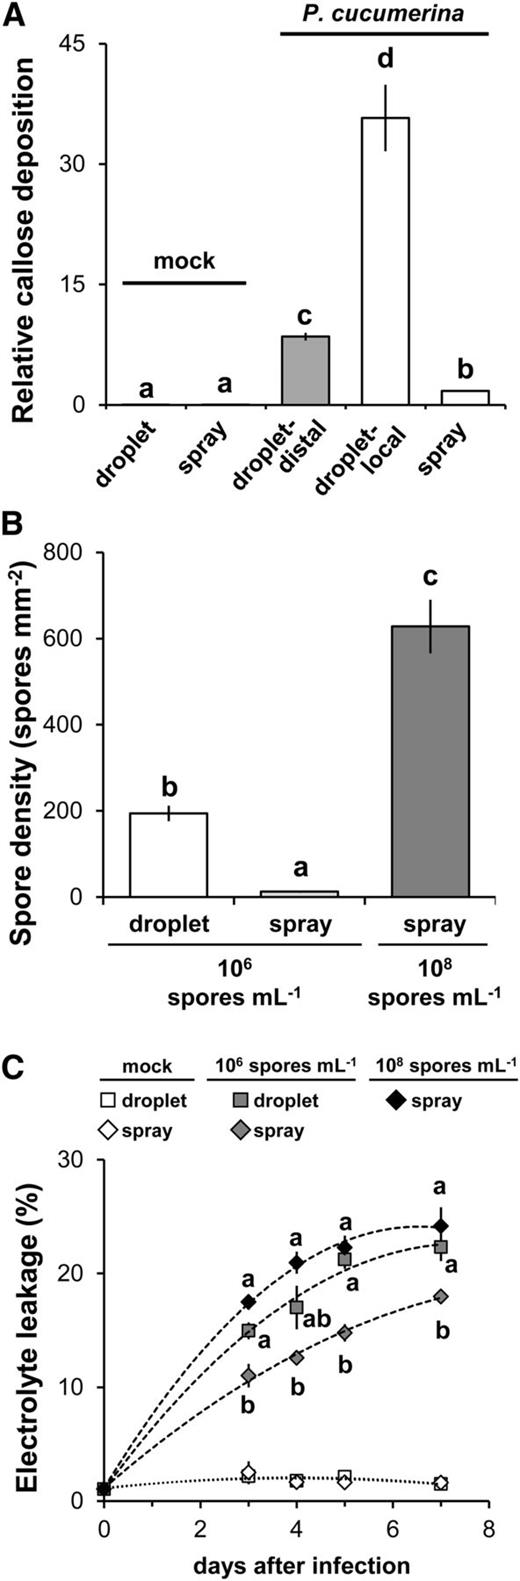
Relationship between callose deposition, cell death, and P. cucumerina spore density on the leaf surface. A, Relative callose quantities in droplet- and spray-inoculated leaves of 5-week-old plants. Leaves were stained by Calcofluor/Aniline Blue at 3 dai (106 spores mL−1) and analyzed by UV epifluorescence microscopy. Callose was quantified from digital microscopy photographs. Shown are mean areas of callose per leaf relative to total leaf area ± sd (n = 24). Callose after droplet inoculation with P. cucumerina spores was quantified within (droplet-local) and outside (droplet-distal) the spore-containing area on the leaf surface. B, Spore density of germinating P. cucumerina at 3 dai. Shown are average numbers of P. cucumerina spores mm−2 leaf area ± sd (n = 24). Different letters indicate statistically significant differences (multiple Student’s t test, α = 0.05). C, Time course of cell death occurrence in mock- and P. cucumerina-inoculated leaves. Cell death was quantified by relative levels of electrolyte leakage from water-suspended leaves. Shown are average levels of conductivity ± sd (n = 4) relative to the maximum level of conductivity after subsequent tissue lysis (set at 100%). Different letters indicate statistically significant differences at each time point between P. cucumerina-inoculated samples (multiple Student’s t test, α = 0.05).
While cell death can contribute to resistance against biotrophic pathogens (Glazebrook, 2005), it can facilitate infection by necrotrophic pathogens (Govrin and Levine, 2000; Kabbage et al., 2013). Supported by our observation that early colonization of droplet-inoculated P. cucumerina coincides with microscopic cell death (Fig. 1B), we hypothesized that the exaggerated early immune response to high spore densities (Fig. 5A) leads to increased cell death that facilitates necrotrophic infection. Therefore, we monitored levels of cell death induction from 3 to 7 dai by quantifying electrolyte leakage. In comparison with spray-inoculated leaves, droplet-inoculated leaves showed consistently higher levels of cell death induction (Fig. 5C), which is consistent with a necrotrophic lifestyle. To confirm that these differences were determined by the density of germinating spores on the leaf surface, rather than the inoculation method itself, we increased the density of the spray inoculum from 106 to 108 spores mL−1. This 100-fold increase resulted in a 48-fold increase in the density of germinating spores at 3 dai (Fig. 5B), suggesting that a larger proportion of spores from the high-density spray inoculum had failed to anneal and had been washed off during the staining procedure. Nevertheless, this 48-fold increase in spore density on the leaf surface was sufficient to trigger a similarly rapid cell death response to leaves that had been droplet inoculated with 106 spores mL−1 (Fig. 5C). Together, these results indicate that the exaggerated immune response to high densities of droplet-inoculated P. cucumerina spores results in enhanced cell death, which in turn facilitates a necrotrophic lifestyle by the fungus (Govrin and Levine, 2000; Kabbage et al., 2013).
Spore Density Determines the Contrasting Effectiveness of JA- and SA-Dependent Defenses after Droplet and Spray Inoculation
To further examine the relationship between spore density and the effectiveness of JA, SA, and ROS-dependent defenses, we profiled basal resistance levels in the JA biosynthesis mutant 12-oxophytodienoate reductase3 (opr3; Schaller et al., 2000; Stintzi and Browse, 2000; Chehab et al., 2011), the JA-insensitive mutant jar1-1 (Staswick et al., 1992, 2002), the SA biosynthesis mutant sid2-1 (Wildermuth et al., 2001), and the rbohD mutant, which is affected in pathogen-associated molecular pattern-induced ROS production (Torres et al., 2002). At 7 d after droplet inoculation with P. cucumerina, the opr3 and jar1-1 mutants had developed significantly larger lesion diameters than wild-type Col-0 plants, whereas sid2-1 and rbohD displayed smaller lesion diameters compared with Col-0 plants (Fig. 6A). This profile of mutant phenotypes indicates effectiveness of JA-dependent defenses, which is consistent with a necrotrophic infection strategy. Conversely, when P. cucumerina was applied by spray inoculation, opr3 and jar1-1 developed wild-type levels of disease, whereas sid2-1 and rbohD showed statistically higher levels of disease in comparison with Col-0 plants (Fig. 6B). This mutant profile indicates effectiveness of SA- and ROS-dependent basal defenses, which is consistent with a biotrophic infection strategy (Torres et al., 2002; Glazebrook, 2005). To determine whether the biotrophic lifestyle of P. cucumerina is suppressed beyond a certain threshold of spores per leaf area, we increased the density of the spray inoculation from 106 to 108 spores mL−1. Strikingly, this change in spore density resulted in a necrotrophic profile of mutant disease phenotypes: the opr3 and jar1-1 mutants showed enhanced disease susceptibility in comparison with Col-0, while sid2-1 and rbohD showed similar or reduced levels of susceptibility in comparison with Col-0, respectively (Fig. 6C). To verify the role of SA signaling and to examine the role of glucosinolate-dependent defense in spray-inoculated P. cucumerina, we tested two additional Arabidopsis mutants: the pad4-1 mutant, which is impaired in SA-dependent signaling (Glazebrook et al., 1997; Jirage et al., 1999), and the pen2-1 mutant, which is affected in the hydrolysis of indole glucosinolates (Bednarek et al., 2009; Clay et al., 2009). Compared with the Col-0 wild type, both mutants showed increased resistance to P. cucumerina after droplet inoculation (Supplemental Fig. S9A), but increased susceptibility after spray inoculation (Supplemental Fig. S9B). Increasing the spray inoculum density from 106 to 108 spores mL−1 reverted the enhanced disease susceptibility to wild-type levels (Supplemental Fig. S9C). In the context of the experimental results presented above, these results not only confirm the spore density-dependent role of SA-dependent defense against the fungus, but they also indicate that PEN2-dependent glucosinolate defense only contributes to basal resistance against biotrophic P. cucumerina.

The contributions of SA, JA, and ROS to basal resistance against P. cucumerina depend on inoculation method and spore density. Basal resistance was determined at 7 dai in the wild-type Col-0, the SA induction mutant sid2-1, the JA-deficient mutant opr3, the JA-insensitive mutant jar1-1, and the ROS production mutant rbohD. A, Average lesion diameters ± sd (n = 6–12) in leaves of droplet-inoculated plants (106 spores mL−1). B, Average percentages of diseased leaves ± sd (n = 6–12) in spray-inoculated plants (106 spores mL−1). C, Average percentages of diseased leaves ± sd (n = 6–12) in spray-inoculated plants (108 spores mL−1). Different letters indicate statistically significant differences (multiple Student’s t test, α = 0.05) between conditions.
DISCUSSION
This study is based on the observation that P. cucumerina causes markedly different disease phenotypes in Arabidopsis after droplet and spray inoculation of the leaves (Fig. 1). These differences in virulence and disease phenotype prompted us to investigate whether P. cucumerina is capable of employing different infection strategies. Since Arabidopsis responds with different defense mechanisms to necrotrophic and biotrophic pathogens (Glazebrook, 2005; Pieterse et al., 2012), we characterized the nature and effectiveness of the Arabidopsis defense response to droplet- and spray-inoculated P. cucumerina. Our results have shown that droplet- and spray-inoculated P. cucumerina provoke profoundly different defense responses between 2 and 7 dai (Table I; Figs. 2, 3, and 5; Supplemental Table S1; Supplemental Fig. S7), which were not associated with noticeable differences in fungal colonization (Fig. 1B; Supplemental Fig. S8). To date, previous studies of the Arabidopsis-P. cucumerina interaction employed different inoculation methods, which might explain the controversy about the contribution of SA- and ABA-dependent defense against P. cucumerina (Ton and Mauch-Mani, 2004; Sánchez-Vallet et al., 2012; Gamir et al., 2014). Therefore, we urge extra caution when using the Arabidopsis-P. cucumerina pathosystem as a model for studying interactions between plants and necrotrophic fungi.
Untargeted metabolic profiling by MALDI-Q-TOF (Table I; Supplemental Fig. S6; Supplemental Table S1) followed by targeted hormone quantification using UPLC-Q-TOF-MS/MS (Fig. 3A) revealed that droplet inoculation of P. cucumerina spores enhances JA biosynthesis. This defense hormone is synthesized from the 13-lipoxygenase pathway, which involves the production of OPDA that is converted into JA by a series of oxidation steps (Howe and Schilmiller, 2002). JA itself requires conjugation to Ile before it can activate the downstream response pathway via COI1-dependent inactivation of transcriptional JAZ activators that repress JA response genes (Chini et al., 2007; Thines et al., 2007). The fact that our MALDI-Q-TOF profiling of droplet-inoculated leaves identified three different ions annotating to OPDA, JA and JA-Ile and that targeted UPLC-Q-TOF-MS/MS analysis confirmed increased JA levels at different time points after droplet inoculation (Fig. 3A), provides strong evidence that JA biosynthesis is induced by droplet-inoculated P. cucumerina. This conclusion is further supported by our finding that droplet inoculation induces the transcription of the JA-dependent VSP2 (Fig. 3B). The JA response is activated by damage-associated molecular patterns (Ballaré, 2011), which are typically formed during cell lysis by mycotoxins from necrotrophic fungi. To determine whether JA-dependent defenses are effective against droplet-inoculated P. cucumerina, we quantified induced resistance in JA-treated wild-type plants and basal resistance in JA signaling mutants. While exogenous application of JA enhanced resistance in wild-type plants (Fig. 4A), the opr3 and jar1-1 mutants showed reduced levels of basal resistance to droplet-inoculated P. cucumerina (Fig. 6A). Thus, droplet inoculation of P. cucumerina not only elicits JA production and JA-dependent gene induction; we also demonstrated that the expression of JA-dependent plant defense is effective against droplet-inoculated P. cucumerina. Since JA-dependent defenses are elicited by and effective against necrotrophic pathogens (Ton et al., 2002; Pieterse et al., 2012; Lai and Mengiste, 2013), we conclude that droplet-inoculated P. cucumerina behaves like a necrotrophic fungus on Arabidopsis (Fig. 7).
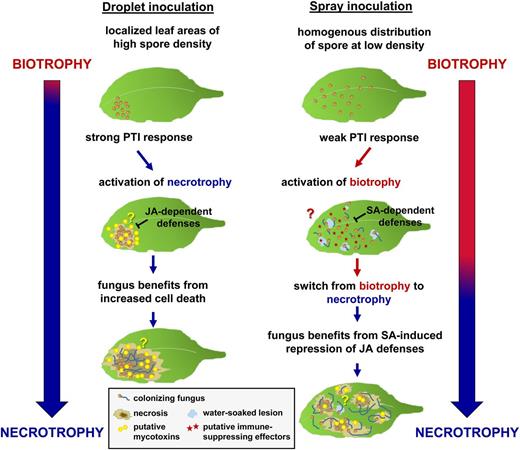
Model of the spore density-dependent infection strategy by P. cucumerina. High spore densities at localized leaf areas after droplet inoculation (left) trigger a strong pathogen-associated molecular pattern-triggered immunity (PTI) response in the host plant. In response, P. cucumerina activates a necrotrophic infection program that might be facilitated by the production of a mycotoxin(s). Furthermore, by employing a necrotrophic infection strategy, the fungus gains an advantage from immunity-related cell death. Under these conditions, the host plant activates JA-dependent defenses to mount resistance against the necrotrophic infection strategy of the fungus. Conversely, the homogenous distribution of spores at low density after spray inoculation (right) triggers a relatively weak PTI response in the host plant. As a consequence, P. cucumerina is capable of employing a biotrophic infection program that might depend on immune-suppressing effectors. Under these conditions, the host plant activates SA-dependent basal defenses to mount resistance against the biotrophic infection strategy by the fungus. To gain an advantage from the SA-induced suppression of JA-dependent defenses in the host plant under these conditions, the fungus switches to necrotrophy during the later stages of the infection.
Spray inoculation with P. cucumerina spores resulted in a different disease phenotype than droplet inoculation (Fig. 1; Supplemental Fig. S2), even though levels of fungal colonization appeared similar between both inoculation methods (Fig. 1B; Supplemental Fig. S8). The metabolic profile of spray-inoculated leaves was markedly different from that of droplet-inoculated leaves (Table I; Fig. 2; Supplemental Figs. S3–S6; Supplemental Table S1). Selection of candidate metabolites that were specifically induced by spray-inoculated P. cucumerina identified two SA derivatives and 10 intermediates or breakdown products of glucosinolates (Table I; Supplemental Table S1; Supplemental Fig. S6). Furthermore, targeted UPLC-Q-TOF-MS/MS analysis confirmed that spray-inoculated leaves increase endogenous SA levels at 2 and 5 dai (Fig. 3A). Hence, spray-inoculated P. cucumerina elicits an SA- and glucosinolate-related defense response in Arabidopsis. Glucosinolates can contribute to defense against (hemi)biotrophic pathogens (Bednarek and Osbourn, 2009; Schlaeppi et al., 2010). Indeed, pen2-1 plants, which are affected in glucosinolate-dependent defense (Bednarek et al., 2009; Clay et al., 2009), only showed enhanced disease susceptibility when spray inoculated with 106 spores mL−1, which was reverted to wild-type levels of susceptibility when spray inoculated with a 100-fold higher spore density (Supplemental Fig. S9). The combination of SA- and glucosinolate-dependent defenses was recently reported to act against the (hemi)biotrophic oomycete Phytophthora capsici (Wang et al., 2013). In addition, enhanced production of aliphatic glucosinolates upon spray inoculation of Arabidopsis with P. cucumerina has been reported previously (Kułak and Bednarek, 2014), illustrating the reproducibility of this response. Moreover, a recent study reported that endogenous JA levels remain unaltered at 2 d after spraying 5-week-old Arabidopsis (accession Col-0) with P. cucumerina spores, while levels of SA, glucosinolates, flavonoids, benzoic acid, and 3-indoleacetonitrile were induced (Pastor et al., 2014). Clearly, these results fully support our analysis of spray-inoculated plants (Table I; Fig. 3A; Supplemental Fig. S7) and challenge the general assumption that P. cucumerina acts like a necrotrophic pathogen.
Recent technical advances in the analysis of glucosinolates by MALDI-mass spectrometry imaging (Shroff et al., 2015) may provide further perspective on the spatial-temporal distribution of glucosinolates in P. cucumerina-infected Arabidopsis. We also showed that spray-inoculated P. cucumerina induces the transcription of SA-dependent PR1, PR5, WRKY70, and ICS1 at 2 dai (Fig. 3B; Supplemental Fig. S7), demonstrating that the observed induction of SA biosynthesis translates into enhanced gene response activity. Interestingly, however, the induction of PR1 and WRKY70 was no longer apparent at 5 d after spray inoculation (Fig. 3B), suggesting that spray-inoculated P. cucumerina represses the initial surge in SA signaling to advance infection. The suppression of SA-dependent defense signaling is characteristic of infection by (hemi)biotrophic pathogens such as P. syringae (Choi et al., 2012). Finally, we showed that spray-inoculated P. cucumerina is resisted by SA-dependent defenses: pretreatment with BTH induced resistance in wild-type plants (Fig. 5B), while the SA biosynthesis mutant sid2-1 and the signaling mutant pad4-1 exhibited enhanced susceptibility to the spray-inoculated fungus (Fig. 6B; Supplemental Fig. S9). Considering that (hemi)biotrophic pathogens are sensitive to SA-dependent plant defenses (Thomma et al., 1998; Ton et al., 2002), these results reinforce the notion that P. cucumerina employs a biotrophic infection strategy during the early stages of infection following spray inoculation (Fig. 7).
Apart from differences in the elicitation of JA-, SA-, and glucosinolate-dependent defenses, the characterization of callose deposition and cell death revealed further disparities in the plant response to droplet- and spray-inoculated P. cucumerina. Droplet-inoculated leaves deposited dramatically higher levels of callose at 3 dai than spray-inoculated leaves (Fig. 5A), which resulted in enhanced levels of cell death (Figs. 1B and 5C). Since callose and cell death are genuine markers for PTI (Glazebrook, 2005; Luna et al., 2011; Lai and Mengiste, 2013), we conclude that droplet-inoculated P. cucumerina triggers a relatively strong PTI response. Moreover, the transition from a relatively strong callose response to an extensive cell death response would benefit the necrotrophic infection strategy of the fungus. Previous studies about the control of cell death during infection by S. sclerotiorum have highlighted the significance of apoptosis for necrotrophic colonization by this fungus (Kabbage et al., 2013, 2015). By contrast, spray-inoculated P. cucumerina triggered relatively low levels of callose deposition and cell death (Figs. 1B and 5). These results indicate that spray-inoculated P. cucumerina is able to suppress PTI, which is characteristic of biotrophic pathogens (Glazebrook, 2005; Dou and Zhou, 2012).
A plausible explanation for the differences in P. cucumerina behavior after spray and droplet inoculation comes from our analysis of spore densities on the leaf surface. Although both inocula had equal spore densities, droplet inoculation resulted in 15-fold higher spore densities on the leaf area than spray inoculation (Fig. 5B; Supplemental Fig. S8). We attribute this difference to evaporation of the inoculation droplet, causing the congregation of spores to confined leaf areas (Supplemental Fig. S10). In support of this hypothesis, lowering the initial spore density in the droplet inoculum resulted in smaller areas of similar spore density on the leaf surface (data not shown). By contrast, spray inoculation with P. cucumerina spores resulted in an equal distribution of spores over the entire leaf area, resulting in overall lower spore densities per surface leaf area (Fig. 5B; Supplemental Fig. S8). Enhancing the spore density in the spray inoculum changed the basal resistance profile of Arabidopsis signaling mutants from a biotrophic signature to a necrotrophic signature (Fig. 6, B and C; Supplemental Fig. S9), indicating a shift from SA/ROS/glucosinolate-dependent resistance at 106 spores mL−1 to JA-dependent resistance at 108 spores mL−1. Hence, increased spore densities on the leaf surface favor a necrotrophic infection strategy by P. cucumerina. Considering the relatively strong PTI response to droplet inoculation (Fig. 5), we conclude that P. cucumerina changes from a default (hemi)biotrophic infection strategy to a necrotrophic infection strategy when challenged with a strong host immune response to localized areas of high spore density (Fig. 7). This situation can occur in nature when spores are scattered in rain drops and concentrated onto the leaf surface after water evaporation. The ability of P. cucumerina to switch from a hemibiotrophic to a necrotrophic lifestyle enables the fungus to take advantage of cell death from hyperstimulation of the plant immune system.
Apart from the hyperstimulation of PTI, necrotrophic fungi typically rely on the production of mycotoxins to induce host necrosis (Christensen and Kolomiets, 2011; Woloshuk and Shim, 2013; Ameye et al., 2015). Future research is required to verify whether the necrotrophic behavior of droplet-inoculated P. cucumerina depends on mycotoxin production and whether such mycotoxin production is stimulated by early immune responses of the host plant. Recently, Dobón et al. (2015) identified several P. cucumerina- and Botrytis cinerea-inducible transcription factors that contribute to disease susceptibility, indicating that P. cucumerina is indeed capable of the suppression of host immune responses. Whether such provirulence factors are induced by P. cucumerina effectors during biotrophic colonization to suppress SA-, ROS-, and glucosinolate-dependent defenses awaits further research. The outcome of our study has shown that the Arabidopsis-P. cucumerina pathosystem is more multifaceted and versatile than a mere necrotrophic plant-pathogen interaction. At the same time, our study has opened new opportunities to deepen our understanding of the signals and molecular mechanisms mediating the fungal switch from biotrophy to necrotrophy. Understanding these processes will allow for the development of new strategies to control fungal diseases, which continue to threaten food security and biodiversity in the 21st century (Fisher et al., 2012).
CONCLUSION
Our study has demonstrated that the plant-pathogenic fungus P. cucumerina can alter its infection strategy depending on the initial spore density on the leaf surface and the corresponding plant immune response. The fungus can switch from a hemibiotrophic to a necrotrophic lifestyle in response to a strong host immune response during the onset of infection. This adaptation enables the fungus to take full advantage of defense-related cell death (Fig. 7). Considering that the Arabidopsis-P. cucumerina interaction has emerged as a popular model system for studying plant interactions with necrotrophic fungi (Sánchez-Vallet et al., 2010, 2012; Gamir et al., 2012, 2014; Ramos et al., 2013; Pastor et al., 2014), our study urges extra caution when interpreting experimental results from this pathosystem.
MATERIALS AND METHODS
Chemicals and Reagents
All chemicals used in this study were purchased from Sigma-Aldrich, except JA and JA-Ile, which were obtained from OlChemim (http://www.olchemim.cz/), and BTH containing 50% benzo(1,2,3)thiadiazole-7-carbothioic acid-S-methyl ester, from Syngenta (http://www3.syngenta.com).
Statistical Analyses
Univariate analyses for the statistical significance of differences in disease resistance, callose deposition, spore density, hormone quantifications, gene expression, and conductivity were performed in Excel using multiple comparisons of Student’s t tests (α = 0.05). MeV software (version 4.9; Raychaudhuri et al., 2000; http://www.tm4.org/mev.html) was used for one- and two-way ANOVA (P < 0.01) of MALDI-Q-TOF data. A Student’s t test was also applied to selected putative markers from MALDI-Q-TOF analysis to compare with two-way ANOVA P values (Supplemental Table S1). Details for multivariate analyses (PCA and O2PLS-DA) of MALDI-Q-TOF data are described below.
Arabidopsis Genotypes and Growth Conditions
Experiments were performed with Arabidopsis (Arabidopsis thaliana) wild-type accession Col-0 and Col-0 mutant lines sid2-1, opr3, jar1-1, and rbohD (Stintzi and Browse, 2000; Wildermuth et al., 2001; Staswick et al., 2002; Torres et al., 2002). After 2 d of stratification (dark, 4°C, and 100% relative humidity [RH]), seeds were planted in a 1:1 soil:sand mixture and kept at 100% RH under a light/dark photoperiod of 8.5/15.5 h at 130 μmol m−2 s−1 and a day/night temperature of 20°C/18°C. Two weeks after germination, seedlings were transferred to individual 60-mL pots containing jiffy7 peat pellets (http://www.gardensupplydirect.co.uk; Ramírez et al., 2009) and cultivated at 70% RH in the same climate chamber. All experiments were performed with 5- to 6-week-old plants that were watered twice per week.
Plectosphaerella cucumerina Resistance Assays
P. cucumerina was grown on potato dextrose agar (PDA) as described (Ton and Mauch-Mani, 2004). Spores were collected and suspended in water. Droplet inoculation was performed by applying 6-µL droplets of spore suspension at the indicated concentrations (106 or 108 spores mL−1) to six to eight fully expanded leaves. The resistance of droplet-inoculated plants was quantified by average lesion diameters from 12 to 20 plants per treatment as described (Ton and Mauch-Mani, 2004). If no lesion could be detected on a droplet-inoculated leaf, it was given a score of zero. Spray inoculation of entire plants (12–20 plants per treatment) was performed at the indicated spore densities (106 or 108 spores mL−1) using a hand-held 30-mL bottle spraying device (Mestall). To ensure homogenous spore dispersion on the leaves, spray inoculum was supplemented with 0.01% (v/v) Silwet. The resistance of spray-inoculated plants was determined by the percentage of leaves with visible disease symptoms as described (Llorente et al., 2005; Sánchez-Vallet et al., 2010). Following inoculation, plants were kept in closed trays at 100% RH. Unless stated otherwise, disease was scored at 7 dai. Each experiment to determine basal resistance was performed at least three times with similar results. To assess induced resistance, 5-week-old plants (Col-0) were soil drenched with demineralized water, Bion (300 µm BTH), or JA (100 µm) as described (Ton and Mauch-Mani, 2004) and inoculated with P. cucumerina 2 d later. Induced resistance assays were repeated twice with similar results.
Sampling of Plant Material
All samples were collected from plants that had been grown in the same climate chamber and that had been inoculated when 5 weeks old. Samples for metabolic and transcriptomic analyses consisted of fully expanded leaves of similar developmental stage that were taken at 2 and 5 dai. Each biologically replicated sample consisted of four leaves that had been collected from different plants (n = 4). To quantify cell death by leaf conductivity measurements, leaf discs were taken at corresponding time points of infection from the inoculation sites showing macroscopic disease symptoms (middle top area on the half leaf). Each biologically replicated measurement was based on six leaf discs from leaves of different plants (n = 4). For all experiments, leaf samples were collected at 3 h after the start of the photoperiod to exclude bias from circadian clock- or light-dependent responses.
MALDI-Q-TOF Mass Spectrometry
Metabolites were obtained by methanol extraction (95% with 0.1% formic acid, v/v) as described (Pétriacq et al., 2012; Luna et al., 2014). High-resolution full-scan mass spectrometry was performed with a Synapt G2 HDMS Q-TOF mass spectrometer (Waters) interfaced with a MALDI ionization head (Luna et al., 2014). To increase the numbers of ionized analytes, two different matrices were used, depending on the polarity of the ionization. Samples were mixed with matrix solution at 50:50 (v/v). For positive ionization mode, the matrix consisted of 5 mg mL−1 α-cyano-4-hydroxycinnamic acid (Sigma-Aldrich) in a 99.9:0.1 (v/v) mixture of methanol and trifluoroacetic acid, and ions were collected at the following mass spectrometry settings: sample plate 2 V, extraction grid 3 V, hexapole 1 V, and aperture 5 V. For negative ionization mode, the matrix consisted of 10 mg mL−1 9-aminoacridine (Sigma-Aldrich) in methanol, and ions were collected at the following mass spectrometry parameters: sample plate 0 V, extraction 12 V, hexapole 9 V, and aperture 3 V. For each sample, six technical replicates were spotted on a 96-well MALDI plate. Red phosphorus in acetone was used to calibrate the time of flight detector. Sulfadimethoxine (Sigma-Aldrich) was used as the lockmass during each run (one in four spotted samples). MALDI was powered by a solid-state laser, emitting at 355 nm with a repetition rate of 2.5 kHz.
Analysis of MALDI-Q-TOF Data
MALDI-Q-TOF continuum data were combined, background subtracted, and centered using MassLynx version 4.1 software (Waters). Output data for all samples were binned using the MALDIquant R package (strict mode with a tolerance of 0.02 D; Gibb and Strimmer, 2012). The resulting peak lists were corrected for total ion current and dry weight of the sample. Six technical replicates of each biological sample were averaged for further analysis. Different multivariate analyses were conducted. Prior to PCA, corrected data for each ion were normalized to the average intensity from all samples using MeV version 4.9 (Raychaudhuri et al., 2000) and filtered using an ANOVA (P < 0.01). In order to get a wider exploratory approach, features were not corrected for false discovery rate. PCA on filtered data (Fig. 2) was performed using Multibase plugin software in Excel (http://www.numericaldynamics.com). In parallel, unfiltered raw MALDI-Q-TOF data were analyzed using PCA in MeV and a supervised O2PLS-DA. O2PLS-DA was performed using SIMCA version 13.0.3 (http://www.umetrics.com/products/simca) with Pareto scaling and log transformation. Goodness to fit, goodness of prediction, and cross-validation ANOVA were satisfactory for MALDI− (R2X = 0.65, Q2 = 0.94, cross-validation ANOVA P = 7.02 × 10⁻⁶) and MALDI+ (R2X = 0.68, Q2 = 0.92, cross-validation ANOVA P = 1.81 × 10⁻³). Variable importance for projection rankings were determined on O2PLS-DA with Pareto scaling and without log transformation in order to keep bigger differences between variables. MarVis Filter, Cluster, and Pathway allowed for adduct and isotope corrections, clustering of metabolites (m/z tolerance = 0.05 D), and screening metabolite identities using the KEGG, AraCyc, and MetaCyc databases (http://marvis.gobics.de/; Kaever et al., 2012). Mass spectra of putatively identified metabolites (benzoic acid, JA, JA-Ile, and SA) were verified by comparing against corresponding standards, using UPLC-Q-TOF-MS/MS with electrospray ionization interface, as described previously (Gamir et al., 2014). Fold changes of selected metabolites were determined using MetaboAnalyst (http://www.metaboanalyst.ca).
SA and JA Quantification by UPLC-Q-TOF-MS/MS Analysis
Phytohormones were double extracted from frozen leaf material (10 mg dry weight) in a total volume of 1.5 mL of ethyl acetate that was spiked with isotopically labeled standards, as described previously (Glauser et al., 2014). UPLC-Q-TOF-MS/MS was used to quantify absolute amounts of hormones based on the following fragmentation: SA, 137→93; and JA, 209→59 (Glauser et al., 2014). Each biologically replicated sample consisted of four pooled leaves of similar size and age from different plants.
Gene Expression Analyses
Col-0 plants were either droplet or spray inoculated with P. cucumerina (106 spores mL−1) or treated with the corresponding control (water for droplet and water + 0.01% [v/v] Silwet for spray). Four leaves from different plants were pooled (n = 4), flash frozen in liquid nitrogen at 2 and 5 dai, then stored at −80°C until RNA extraction, reverse transcriptase conversion, and quantitative PCR analyses, as described previously (Luna et al., 2014). PCR amplification of PR1 (At2g14610), PR5 (At1g75040), WKY70 (At3g56400), ICS1 (At1g74710), and VSP2 (At5g24770) was performed using previously described gene-specific primers (Gouhier-Darimont et al., 2013; Gruner et al., 2013; Li et al., 2013). Relative transcript quantities were calculated according to (1 + E)ƊCt, where Ct represents cycle threshold and ƊCt = Ct(sample) − Ct(calibrator sample), and normalized to (1 + E)ƊCt values of three reference genes, At1g13440, At2g28390, and At5g25760 (Czechowski et al., 2005).
Cell Death Measurements
Cell death was determined by conductivity measurements from electrolyte leakage as reported (Pike et al., 1998). Five-week-old Col-0 plants were droplet or spray inoculated with water (±0.01% [v/v] Silwet) or P. cucumerina (106 or 108 spores mL−1). At various time points after inoculation (0 to 7 dai), six discs (1.2 cm2) from similarly aged leaves were collected from different plants, using a cork borer (n = 4). Discs were agitated in 5 mL of double-deionized sterile water at room temperature for 2 h on an orbital shaker (200 rpm). Conductivity was measured in the balanced bathing solution using a CMD 500 WPA conductivity meter. To express levels of electrolyte leakage relative to maximum electrolyte leakage from lysed tissue (set at 100%), samples were boiled for 15 min and remeasured for total conductivity. Cell death was expressed as the percentage of electrolyte leakage between initial and total electrolyte leakage. Three independent experiments were conducted with comparable results.
Trypan Blue Staining
Leaves (n = 8–12) were collected at 4 and 7 dai and cleared in 70% (v/v) ethanol prior to lactophenol-Trypan Blue staining, as described previously (Ton and Mauch-Mani, 2004). Fungal colonization and associated cell death were examined using an Olympus BX51 microscope at different magnifications (40×, 100×, and 400×). Photographs of representative colonization patterns were taken at 400× magnification. The presented images were compiled from photographs at five different focal planes that were merged at 70% transparency using Photoshop CS4 (Adobe).
Aniline Blue and Calcofluor Staining
Callose deposition relative to germinating fungal spores was performed in leaves from 5-week-old Col-0 plants at 3 d of droplet or spray inoculation with water or P. cucumerina (106 spores mL−1). Aniline Blue-Calcofluor double staining of spores were performed as described previously (Ton and Mauch-Mani, 2004; Luna et al., 2011). Leaves were analyzed by epifluorescence microscopy (Olympus BX51). For each treatment, four similarly aged leaves of six plants per condition were considered (n = 24). Levels of callose deposition were quantified using Photoshop CS4 (Adobe) and expressed relative to total leaf area as described (Luna et al., 2011).
Supplemental Data
The following supplemental materials are available.
Supplemental Figure S1. Droplet and spray inoculation result in similar amounts of inoculum on the leaf.
Supplemental Figure S2. Differential disease phenotypes after droplet and spray inoculation.
Supplemental Figure S3. Supervised multivariate analysis of metabolic profiles.
Supplemental Figure S4. Unsupervised principal component analysis of metabolic profiles.
Supplemental Figure S5. Hierarchical cluster analysis of metabolic profiles.
Supplemental Figure S6. Differential regulation of JA, SA, and glucosinolate metabolites.
Supplemental Figure S7. Gene expression analysis of PR5 and ICS1.
Supplemental Figure S8. Epi-fluorescence microscopy of callose deposition and spore distribution.
Supplemental Figure S9. Basal resistance of pad4-1 and pen2 after droplet and spray inoculation.
Supplemental Figure S10. Model explaining the link between inoculation method and spore density.
Supplemental Table S1. Statistical analysis of differentially responding m/z values.
ACKNOWLEDGMENTS
We thank Dr. Heather Walker (biOMICS Facility, University of Sheffield) and Dr. Gaétan Glauser (University of Neuchâtel) for useful advice regarding mass spectrometry experiments.
Glossary
- SA
salicylic acid
- JA
jasmonic acid
- ABA
abscisic acid
- ROS
reactive oxygen species
- NO
nitric oxide
- BTH
benzothiadiazole
- MALDI-Q-TOF
matrix-assisted laser-desorption ionization-quadrupole-time of flight
- MALDI
matrix-assisted laser-desorption ionization
- m/z
mass-to-charge ratio
- PCA
Principal component analysis
- O2PLS-DA
bidirectional orthogonal partial least square discriminant analysis
- OPDA
12-oxo-phytodienoic acid
- JA-Ile
jasmonyl-isoleucine
- UPLC-Q-TOF-MS/MS
ultra-performance liquid chromatography-quadrupole time of flight-tandem mass spectrometry
- dai
days after inoculation
- Col-0
Columbia-0
- PTI
pathogen-associated molecular pattern-triggered immunity
- RH
relative humidity
LITERATURE CITED
Author notes
This work was supported by the European Research Council (grant no. 309944–Prime–A–Plant to J.T.) and the Leverhulme Trust (grant no. RL–2012–042 to J.T.).
Address correspondence to [email protected].
The author responsible for distribution of materials integral to the findings presented in this article in accordance with the policy described in the Instructions for Authors (www.plantphysiol.org) is: Jurriaan Ton ([email protected]).
J.T. and P.P. conceived the original research plans; J.T. supervised the experiments; P.P. performed most of the experiments; J.T. and J.H.M.S. provided technical assistance to P.P.; P.P., J.T., and J.H.M.S. designed the experiments and analyzed the data; P.P. and J.T. conceived the project and wrote the article with contributions of all the authors; J.T. supervised and complemented the writing.
Articles can be viewed without a subscription.
