


Abstract
After meiosis, tapetal cells in the innermost anther wall layer undergo program cell death (PCD)-triggered degradation. This step is essential for microspore development and pollen wall maturation. We identified a key gene, Defective Tapetum Cell Death 1 (DTC1), that controls this degeneration by modulating the dynamics of reactive oxygen species (ROS) during rice male reproduction. Mutants defective in DTC1 exhibit phenotypes of an enlarged tapetum and middle layer with delayed degeneration, causing male sterility. The gene is preferentially expressed in the tapetal cells during early anther development. In dtc1 anthers, expression of genes encoding secretory proteases or lipid transporters is significantly reduced, while transcripts of PCD regulatory genes, e.g. UDT1, TDR1, and EAT1/DTD, are not altered. Moreover, levels of DTC1 transcripts are diminished in udt1, tdr, and eat1 anthers. These results suggest that DTC1 functions downstream of those transcription factor genes and upstream of the genes encoding secretory proteins. DTC1 protein interacts with OsMT2b, a ROS scavenger. Whereas wild-type plants accumulate large amounts of ROS in their anthers at Stage 9 of development, those levels remain low during all stages of development in dtc1 anthers. These findings indicate that DTC1 is a key regulator for tapetum PCD by inhibiting ROS-scavenging activity.
The developing anther is composed of microsporocytes within a locule that is surrounded by four anther wall layers: tapetum, middle layer, endothecium, and epidermis. As the innermost sporophytic layer, the tapetum plays major roles in microspore formation. The tapetum originates from primary parietal cells through a series of divisions between Stage 3 (ST3) and ST5 (Zhang et al., 2011). After the sporogenous cells generate microspore mother cells and meiocytes in sequence at ST6 and ST7, they form dyads (ST8a) and tetrads (ST8b) of haploid microspores through meiosis. Beginning at ST9, free microspores are released from the tetrads and then vacuolated (ST10). Following two mitosis events, binuclear pollen (ST11) and trinuclear pollen (ST12) are produced. During microspore development and maturation, the tapetum provides nutrients for growth and enzymes for the release of microspores from their special callose wall at the tetrad stage (Bedinger, 1992). Functioning as polar secretory cells, the tapetum undergoes cellular degradation starting from ST8. That process of programmed cell death (PCD) involves cytoplasmic shrinkage, breakdown of the nuclear membrane, oligonucleosomal cleavage of DNA, vacuole rupture, and swelling of the ER (Papini et al., 1999).
Reactive oxygen species (ROS) induce PCD during tapetum degeneration, aleurone degradation, formation of aerenchyma tissue, and the development of tracheary elements (Fath et al., 2001; Obara et al., 2001; Li et al., 2006; Mühlenbock et al., 2007; Hu et al., 2011; Qu et al., 2014; Yoo et al., 2015). High levels of ROS indiscriminately attack cellular constituents, leading to membrane leakage and cell lysis (Van Breusegem and Dat, 2006). Such damage can be avoided through a critical balance between ROS production and scavenging that regulates subcellular levels of ROS. Superoxide radicals are converted to hydrogen peroxide (H2O2) by superoxide dismutase. This H2O2 is then converted to water and dioxygen by peroxidase and catalase (Gechev et al., 2006). All three enzymes are ROS scavengers (Apel and Hirt, 2004; Koffler et al., 2015).
Low-molecular-mass antioxidants, such as metallothioneins (MTs), ascorbate, glutathione, and carotenoids, remove hydroxyl radicals and singlet oxygen (Gechev et al., 2006). The MTs are Cys-rich proteins that bind to metals via thiol groups (SH) of Cys residues (Coyle et al., 2002). Because of their SH activity in molecules, MTs can interact with many substances, including other proteins. MTs have two domains, alpha and beta, that differ in their ability to bind metals. These proteins form dimers via their domains (Mackay et al., 1993) and are widely distributed in animals, plants, fungi, and cyanobacteria (Guo et al., 2003). For example, OsMT2b and OsMT-I-4b proteins in rice (Oryza sativa) scavenge superoxides and hydroxyl radicals (Wong et al., 2004; Hu et al., 2011). A reduction of OsMT2b expression causes epidermal cell death in rice roots due to ROS accumulations (Steffens and Sauter, 2009). Decreased MT-I-4b expression results in less pollen fertility (Hu et al., 2011).
Disturbances in tapetum development and degeneration are associated with male sterility; those two events occur sequentially during anther development (Wilson and Zhang, 2009; Wang et al., 2013; Zhang and Yang, 2014). In rice, tapetal cell identification begins after specification of the anther wall by the LRR RLK receptor kinase MULTIPLE SPOROCYTES 1 (MSP1) and TDR INTERACTING PROTEIN2 (TIP2), a helix-loop-helix (bHLH) transcription factor (Nonomura et al., 2003; Fu et al., 2014). TIP2 plays a crucial role in regulating the meristemoid transition and cell differentiation during early anther development. Mutations in TIP2 are associated with a lack of differentiation of the inner three anther wall layers as well as defective tapetal PCD. An ER-membrane protein, DEFECTIVE TAPETUM AND MEIOCYTES 1 (DTM1), controls early tapetum development (Yi et al., 2012). Undeveloped Tapetum 1 (UDT1) encodes a bHLH protein and regulates tapetum development (Jung et al., 2005). Defects in UDT1 generate an undifferentiated and vacuolated tapetum. TAPETUM DEGENERATION RETARDATION (TDR) enhances tapetal PCD. Located downstream of UDT1, the bHLH protein directly associates with the promoter regions of Oryza sativa Cys Proteases 1 (OsCP1) and OsC6 (Li et al., 2006). The former, encoding a putative Cys protease, is involved in the release of microspores from the tetrads (Lee et al., 2004). Belonging to a group of lipid transfer proteins, OsC6 shows lipid-binding activity (Zhang et al., 2010) and has a crucial role in the development of lipidic orbicules and pollen exine. A pollen exine-forming gene, CYP704B2, catalyzes the production of ω-hydroxylated fatty acids with 16- and 18-carbon chains, which are essential for production of the anther cuticle as well as the exine (Li et al., 2010; Li and Zhang, 2010). Expression levels of these genes are reduced in tdr mutants (Li et al., 2011). Mutants in ETERNAL TAPETUM 1 (EAT1), encoding a bHLH transcription factor, have reduced transcript levels of AP25 and AP37, which encode aspartic proteases. Overexpression of those genes induces cell death in both yeast and plants (Niu et al., 2013). Furthermore, PCD is delayed in the tapetum degeneration mutant eat1. This delayed PCD phenotype is also observed in delayed tapetum degeneration (dtd) mutants, alleric to eat1 (Ji et al., 2013).
RESULTS
Male-Sterile Rice Mutant Is Defective in Anther Development
A male-sterile rice mutant, isolated from our T-DNA mutant pool (An et al., 2003; Jeon et al., 2000; Jeong et al., 2002), was named defective tapetum cell death 1 (dtc1-1). Anthers from line 1A-12132 were pale green (Fig. 1, A and B) and smaller than those of the wild-type (WT). In that line, T-DNA was inserted in the third exon of Os07g35610 (Fig. 1C). When heterozygous progeny were selfed, normal and sterile plants were produced at a ratio of approximately 3:1 (54 fertile: 25 sterile; χ2 = 1.861; P < 0.05), thereby demonstrating that this sterile phenotype was caused by a single recessive mutation. Whereas all the sterile progeny were homozygous for the T-DNA insertion, approximately one-third of the fertile progeny were wild type that lacked T-DNA while the rest carried T-DNA in only one chromosome. This indicated that the phenotype was due to the T-DNA insertion. We identified another line, 1C-01160, where T-DNA was inserted at 349 bp upstream from the start codon of Os07g35610 (Fig. 1C). This dtc1-2 mutant also displayed a male-sterile phenotype (Fig. 1, A and B). The sterile plants from dtc1-2 heterozyous progeny accounted for approximately 28% of the total (48 fertile: 19 sterile; χ2 = 1.0.403; P < 0.05 for 3:1), suggesting that this sterile phenotype was also caused by a single recessive mutation. T-DNA was found in both chromosomes for all of the sterile plants, supporting our conclusion that the T-DNA insertion led to male sterility.
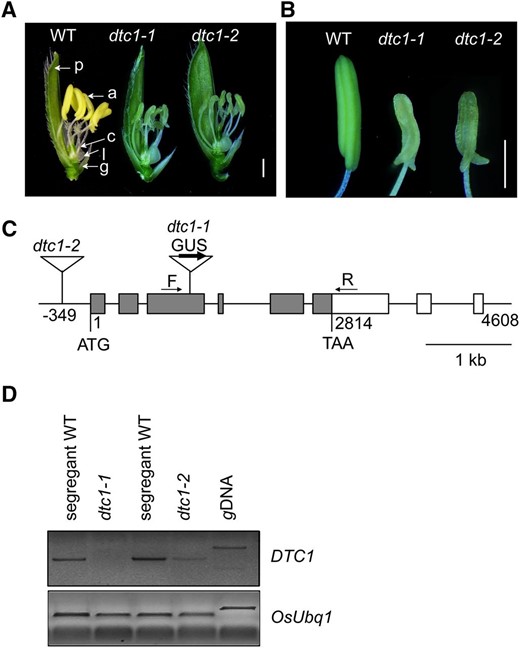
Characterization of T-DNA insertion mutants in DTC1. A, Comparisons among wild type (left), dtc1-1 (middle), and dtc1-2 (right) spikelets after removing lemma. Bar = 1 mm. B, Comparisons among wild type (left), dtc1-1 (middle), and dtc1-2 (right) anthers. Bar = 1 mm. C, Gene structure of DTC1. Gray boxes indicate exons; open boxes, UTRs; lines connecting boxes, introns. Triangles are T-DNA insertions of dtc1-1 (line 1A-12132) and dtc1-2 (line 1C-01160). Arrows F and R show primers used for RT-PCR analyses of DTC1 transcript levels. Bar = 1 kb. D, RT-PCR analyses of DTC1 transcript levels in dtc1-1 and dtc1-2 compared with segregating wild type. Rice Ubiquitin 1 (OsUbi1, Os03g0234200) served as control.
Defective Tapetum Cell Death 1 (DTC1) encodes a protein containing a development and cell death (DCD) domain and KELCH repeats (Supplemental Fig. S1; Adams et al., 2000). Among the 11 members in the rice genome that have this DCD domain, three proteins containing KELCH repeats are expressed in early stages of anther development (NCBI Gene Expression Omnibus: GSE13988; Fujita et al., 2010). One Arabidopsis (Arabdiopsis thaliana) member, AT5g01660, is also expressed in the flowers, sperm cells, and embryos (Schmid et al., 2005). This suggests that they may play a conserved role during the formation of male reproductive organs. Our RT-PCR analyses of developing anthers detected no DTC1 transcripts in dtc1-1, implying that it is a null mutant. By comparison, a small amount of the transcript remained in dtc1-2, suggesting that it is a knock-down allele (Fig. 1D).
We found that the promoterless GUS, located within the T-DNA, was oriented in the same direction as DTC1 in T-DNA-tagged line 1A-12132, thereby generating a translational fusion between the two gene products (Fig. 1C). Therefore, we were able to monitor its expression pattern by measuring GUS activity. Here, analyses of the GUS enzyme showed that DTC1 was not expressed in any of the vegetative cells but was specifically expressed in developing anthers between ST7 and ST10 (Fig. 2A). Expression in the anthers was diminished at ST11, but activity was prominent in the carpels at ST12 (Fig. 2A). Cross sections of anthers at ST8 and ST9 indicated that the signal was limited in the tapetal cell layer (Fig. 2, B and C). This anther-preferential pattern of expression during spikelet development helped to explain the male-sterile phenotype associated with the dtc1 mutants.
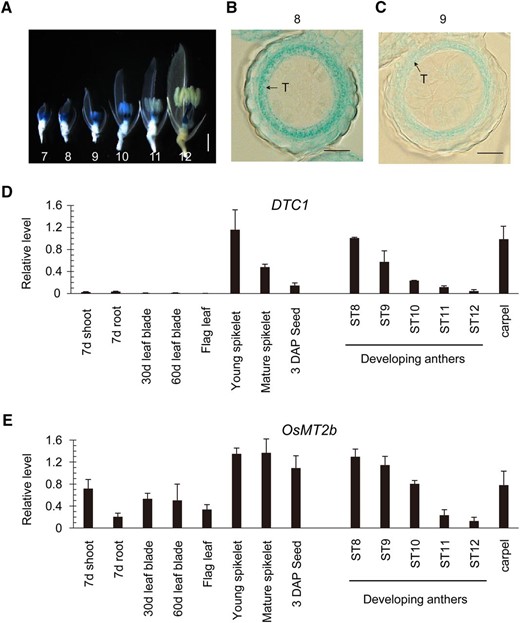
Expression profiles of DTC1 and OsMT2b. A, Expression patterns of DTC1–GUS fusion product. Photograph was taken after removal of lemma and half of palea. Numbers indicate anther development stages ST7 through ST12. Scale bar = 1 mm. B and C, Cross section of anthers from T-DNA-tagged line expressing DTC1–GUS at ST8 and ST9. T, tapetum. Bars = 20 μm. D and E, qRT-PCR analyses of DTC1 (D) and OsMT2b (E) expression in various organs. Transcript levels were normalized to OsUbi1.
Our quantitative real-time RT-PCR (qRT-PCR) analysis of DTC1 transcripts demonstrated that the gene was not expressed in vegetative organs but was strongly expressed in young spikelets, especially in developing anthers and mature carpels (Fig. 2D). This pattern is identical to what we observed in our GUS analysis of the T-DNA-tagged line, indicating that GUS expression patterns could be used to represent transcript levels for DTC1.
The dtc1 Anthers Are Defective at the Microspore Stage
To determine when these defects occur, we compared thin sections of anthers from dtc1-1 and wild-type samples. During meiosis, the meiocytes formed dyads and tetrads at ST8 in wild-type anthers. At this time, the tapetum was considerably changed due to development and differentiation. In particular, the cytoplasm became condensed toward the middle layer at ST8a (Fig. 3A). Afterward, the tapetum was vacuolated, as evidenced by the partial staining of its cells at ST8b (Fig. 3B). During that stage, the middle layer began to shrink, making it difficult to continue our examination. From ST9, condensing of the tapetum was accelerated and the cytoplasm was strongly stained (Fig. 3C). At that stage, young microspores were detached from the tetrads. At ST10, the tapetal cells started to degenerate and microspores were enlarged and vacuolated (Fig. 3D). By ST11, the tapetal cells had disappeared almost entirely and the vacuolated pollen became binucleus pollen grains (Fig. 3E). At ST12, the tapetal cell layer was completely absent and mature pollen grains were filled with starch granules (Fig. 3F).
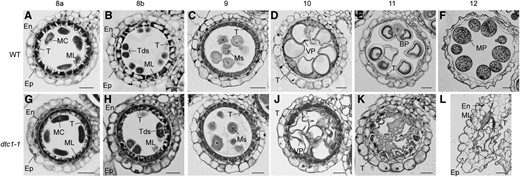
Transverse-sectional comparisons between wild-type and dtc1-1 anthers. Cross sections of wild type (A–F) and dtc1-1(G–L) anthers at ST8a (A and G), ST8b (B and H), ST9 (C and I), ST10 (D and J), ST11 (E and K), and ST12 (F and L). BP, Binuclear pollen; En, endothecial cell; Ep, epidermal cell; MC, meiocyte; ML, middle layer; MP, mature pollen; Ms, microspore; T, tapetal cell; Tds, tetrads; VP, vacuolated pollen. Bars = 20 μm.
The dtc1 mutant anthers did not differ from those of the wild-type through ST9, with development and vacuolation, as well as the formation of four-layer anther walls and progression from meiocytes to microspores, being normal (Fig. 3, G–I). However, phenotypic differences were obvious at ST10. Compared with the wild type, the tapetum layers in the mutant did not degenerate but maintained their original shape and became darker (Fig. 3J). At the mature stages, the tapetal cells and middle layers were not degraded, and remnants of the degenerated pollen were visible inside the locules (Fig. 3, K and L). This indicated that DTC1 functions in the degeneration of the tapetum and middle layer.
We performed analyses with a transmission electron microscope to observe any subcellular defects. At ST10, wild-type locules were filled with vacuolated pollen grains and the middle layer was greatly diminished (Fig. 4A). By contrast, most of the pollen grains in the mutant had ruptured. The middle layer was not degenerated and the mutant tapetum was thicker than that of the wild type (Fig. 4B). Although pollen development was severely hampered in the dtc1 anthers, vacuolated pollens with a globular shape were rarely observed (Supplemental Fig. S2A). In the wild-type tapetum, the cytoplasm was condensed and organelles were not easily identifiable (Fig. 4C). Vestige-like stacks in the wild-type were thought to be mitochondria and ER. In contrast, the dtc1-1 tapetum contained distinctive organelles, such as mitochondria, ER, and plastids (Fig. 4D). The tapetum surrounding the remaining pollen grains from the mutant also contained those organelles (Supplemental Fig. S2B). Ubisch bodies were evenly spread along the inner surface of the wild-type tapetum (Fig. 4E). The spheroid structure is a mediator that transports tapetum-produced lipidic sporopollenin precursors to the microspores (Wang et al., 2003). However, we rarely noted any normal Ubisch bodies within the dtc1 tapetum (Fig. 4F). Smaller Ubisch bodies were occasionally found in the region where vacuolated pollen grains remained (Supplemental Fig. S2C). While this lack of Ubisch bodies affected the formation of exine in the mutant, pollen grains from the wild type developed well-organized pollen walls that comprised two layers of tectum and nexine, as well as a rod-shaped bacula (Fig. 4G). In contrast, dtc1 pollen grains exhibited abnormal exine development (Fig. 4H; Supplemental Fig. S2, D and E); in severe cases, debris from the pollen walls was indistinguishable (Fig. 4H). Normal-appearing vacuolated pollen also exhibited an irregular arrangement of exine. Finally, the tectum in the outer layer was thinner than the nexine, and bacula development was uneven (Supplemental Fig. S2, D and E).
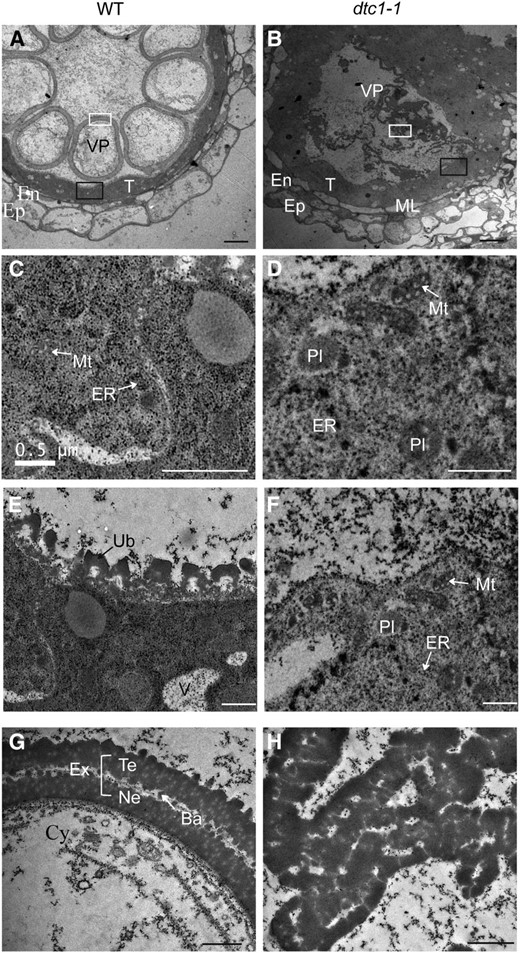
Transmission electron microscopy of wild type and dtc1-1 anthers. A and B, Anther wall layer of wild type (A) and dtc1-1 (B) at ST10. C and D, Magnified images of tapetal cytoplasm indicated by black solid boxes in A and B. E and F, Magnified images of inner surface of tapetum in A and B. G, Magnified images of vacuolated pollen wall from A. H, Magnified images inside locule from B. Ba, Bacula; Cy, cytosol of vacuolated pollen; En, endothecial cell; Ep, epidermal cell; ER, endoplasmic reticulum; Ex, exine; ML, middle layer; Mt, mitochondria; Ne, nexine; Pl, plastids; T, tapetal cell; Te, tectum; Ub, Ubisch bodies; V, vacuole; VP, vacuolated pollen. Bars = 10 μm (A and B) and 1 μm (C–H).
Mutation of DTC1 Causes a Defect in Tapetum Degeneration
Microscopic observations indicated that the mutant tapetal cells were apparently not degenerated. Because they contained numerous mitochondria and other organelles that appeared normal, we proposed that the process of cell death is delayed in the mutant. Tapetum degeneration is caused by PCD, for which the best feature is cleavage of nuclear DNA. We, therefore, compared DNA fragmentation with a terminal deoxynucleotidyl transferase-mediated dUTP nick-end labeling (TUNEL) assay. In the wild-type, yellow-colored TUNEL signals were first seen at meiosis stage ST8a (Fig. 5B) and were increased at microspore stages ST8b and S9 (Fig. 5, C and D). Those signals then weakened at ST10 (Fig. 5E). However, in dtc1-1anthers, no positive TUNEL signals were detected at any stage (Fig. 5, F–J). Furthermore, positive signals were absent in the weak allele dtc1-2 during ST8 and ST9 (Fig. 5, K–N), and were weak at ST10 (Fig. 5O). This indicated that the mutations of DTC1 caused a defect in tapetum degeneration, a step that is important for releasing nutrients and several compounds to growing pollen grains. In fact, ST8 to ST10 was the period during which PCD signals were intensive in the wild-type tapetum, coinciding with the time when primexine and exine were being formed.
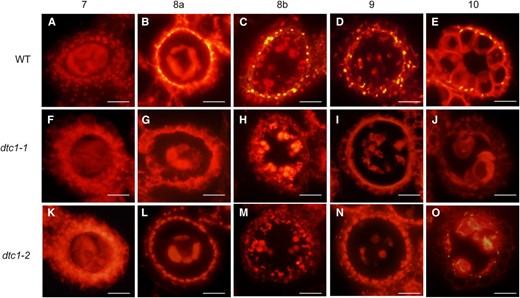
Detection of DNA fragmentation by TUNEL assays. Signals from anthers of WT (A- E), dtc1-1 (F- J), and dtc1-2 (K- O) at ST7 and ST10. Nuclei were stained with propidium iodide (PI) indicated by red fluorescence. Yellow fluorescence shows TUNEL-positive regions. Bars = 20 μm.
Expression of Genes Encoding Secretory Proteins Is Affected in dtc1 Anthers
To study the relationship between DTC1 and previously identified genes that function in anther development, we monitored their expression by qRT-PCR analyses. We observed no obvious change in expression levels of MSP1, DTM1, UDT1, TDR, and EAT1/DTD, suggesting that DTC1 may act downstream of these genes (Fig. 6, A–E). To verify this genetic hierarchy, we evaluated DTC1 transcripts in msp1, udt1, dtm1, and tdr mutants and found that their levels were lower than in the wild type (Fig. 7). This further supported our belief that DTC1 functions later than the regulatory genes.
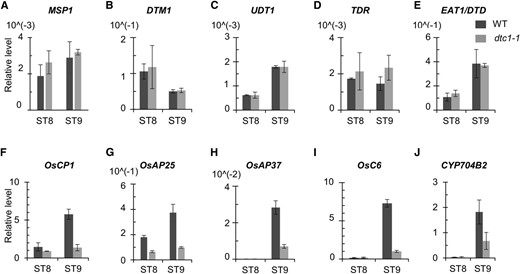
Expression analyses of marker genes during stages of anther development. Quantitative RT-PCR of MSP1 (A), DTM1 (B), UDT1 (C), TDR (D), EAT1/DTD (E), OsCP1 (F), OsAP25 (G), OsAP37 (H), OsC6 (I), and CYP704B2 (J). y axis, gene expression relative to rice OsUbi1 transcript level.
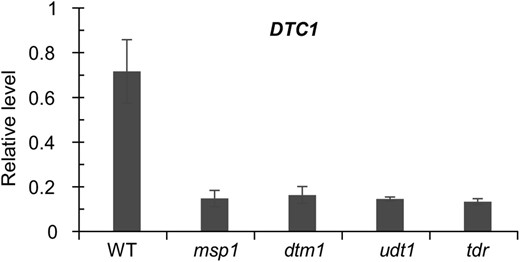
Expression analysis of DTC1 in other anther mutants. Anthers from msp1, udt1, dtm1, and tdr mutants were harvested at ST9, and expression of DTC1 was measured by qRT-PCR. y axis, gene expression relative to OsUbi1 transcript level. Results represent averages of 3 independent experiments.
We then investigated genes that encode PCD effector or secretory proteins. Our qRT-PCR assay showed a dramatic reduction in transcript levels of a Cys protease-encoding OsCP1 and two aspartic protease-encoding genes, AP25 and AP37, as well as OsC6, involved in lipid transport from the tapetum to the pollen exine through the orbicules and CYP704B2, encoding fatty acid hydroxylase (Fig. 6, FJ). In our wild type, those genes were expressed at higher levels at ST9 than at ST8, but expression was significantly reduced in the dtc1 anthers during those stages of development (Fig. 6, F–J). These findings indicated that DTC1 functions prior to the secretory pathway between tapetum and locule. Our analytical results also suggested that DTC1 functions later than TDR at ST8b and before the secretory genes that function at ST9 (Fig. 8). Because DTC1 is a cytosolic protein, it may not directly control the transcription of the later-expressed genes. Instead, a reduction in ROS accumulations in the defective dtc1 tapetum might indirectly affect their expression. These second-hand changes in transcript levels have also been observed in other male-sterile mutations in DTM1 and MTR1, which are not transcription factor genes (Tan et al., 2012; Yi et al., 2012).
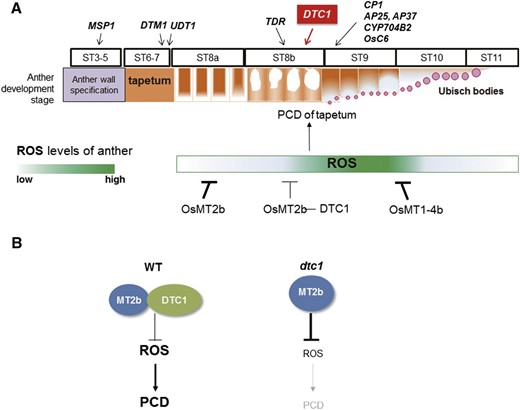
Role of DTC1 during anther development and tapetum degeneration. A, Schematic diagram of PCD in tapetum, and ROS levels regulated by MTs and DTC1. Genes involved in tapetum development are presented. Arrows indicate times when each marker gene functions. B, Differences in PCD induced by ROS in wild type and dtc1 mutant anthers.
DTC1 Binds to Metallothionein
To understand the biochemical mechanism by which DTC1 regulates tapetum development, we screened our cDNA library of rice inflorescences (<5 cm panicles) to identify interacting partners via yeast (Saccharomyces cerevisiae) two-hybrid analyses. Because DTC1 protein does not have transcriptional activation activity, the full-length DTC1 was used as a bait. Among the 33 positive colonies identified here, we selected OsMT2b (LOC_Os05g02070) for further evaluation because it occurred at the highest frequency (5 colonies out of 33).
Because OsMT2b is located in the cytoplasm (Wong et al., 2004), we tested whether DTC1 is also localized there by performing a transient subcellular localization experiment. The full-length cDNA of DTC1 was fused to sGFP, and the fusion was placed under the UBIQUITIN (Ubi) promoter from Zea mays. We also constructed an OsMT2b–mRFP fusion construct under that promoter. After both molecules were transferred to protoplasts prepared from rice Oc cells, their expression was monitored with a fluorescence microscope. This experiment showed that the GFP signal from our DTC1–sGFP fusion coincided with the RFP signal driven by OsMT2b–mRFP in the cytosol (Supplemental Fig. S3A). We also generated an OsMT-I-4b–mRFP fusion molecule under the Ubi promoter. OsMT-I-4b is expressed in anthers (Hu et al., 2011). In common with OsMT2b, OsMT-I-4b was also colocalized with DTC1 in the cytoplasm (Supplemental Fig. S3B).
To confirm their interaction, we conducted a bimolecular fluorescence complementation (Bi-FC) assay. A modified yellow fluorescence protein gene, YFP, encoding the N-terminal region (VenusN1–173, YFPN; Waadt et al., 2008), was fused to the full-length DTC1 cDNA, and the YFPN–DTC1 fusion was placed under the control of the Ubi promoter. Similarly, YFP encoding the C-terminal region (VenusC156–239, YFPC; Waadt et al., 2008) was fused to OsMT2b, and the YFPC–OsMT2b fusion molecule was also placed under the control of that promoter. We also generated a YEFC–OsMT-I-4b fusion molecule under the Ubi promoter. Coexpression of YFPN–DTC1 and YFPC–OsMT2b in the protoplasts revealed their interaction (Fig. 9A). Furthermore, we observed that YFPN–DTC1 binds to YFPC–OsMT-I-4b.
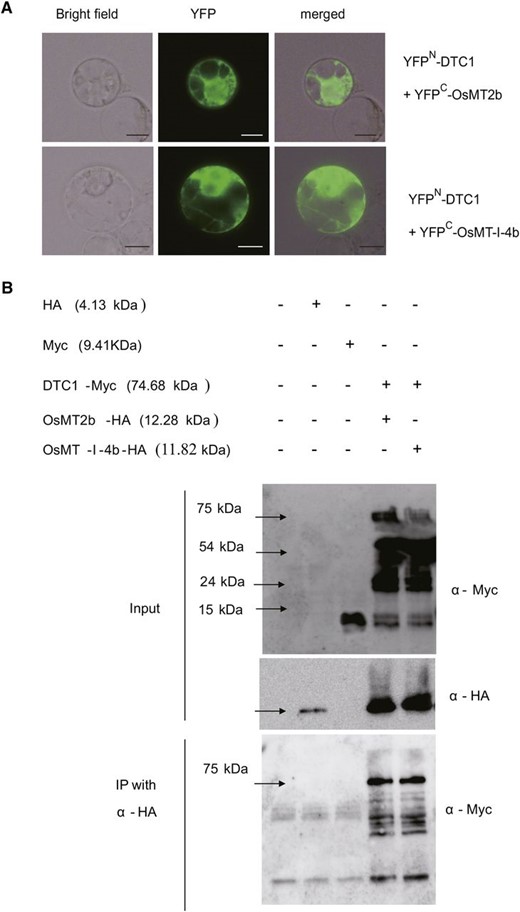
Interactions between DTC1 and MTs. A, Interaction of DTC1 with MT2b (upper panel) or OsMT-I-4b (lower panel) in rice Oc cells revealed by Bi-FC system. Each combination of constructs fused to YFPN and YFPC was transfected and transiently expressed. Images shown are bright field, YFP fluorescence by Bi-FC, and merged image. Bars = 10 μm. B, Coimmunoprecipitation analysis of interaction between DTC1 and MTs. Total proteins were extracted from rice Oc cell protoplasts that transiently expressed DTC1 and Myc together with OsMT2b-HA or OsMT-I-4b-HA. Plus and minus signs indicate constructs introduced into protoplasts. Extracts were detected using anti-Myc antibody or anti-HA antibody (upper panel). Immunoprecipitation was performed with anti-HA antibody, then detected using anti-Myc antibody (lower panel).
For additional verification, we performed coimmunoprecipitation (Co-IP) assays. The Myc-tagged DTC1 plasmid was introduced into Oc cell protoplasts together with either OsMT2b–HA or OsMT-I-4b–HA. Western blots using antibodies against c-Myc or HA showed that the constructs were expressed in the transient-expression system (Fig. 9B, upper). These Co-IP experiments indicated that DTC1 binds to the two MT proteins (Fig. 9B, lower). Therefore, we could again conclude that DTC1 interacts with either OsMT2b or OsMT-I-4b.
If OsMT2b and OsMT-I-4b are involved in tapetum degeneration, then one would expect that they are expressed during early anther development when the dtc1 mutants exhibit their phenotypes. Our qRT-PCR assays showed that OsMT2b was expressed in all examined tissues, i.e. shoots, roots, mature leaves, and reproductive organs (Fig. 2E). In the developing anthers, transcripts were maintained at higher levels during the early stages before being reduced to a low level. This expression pattern was in accord with that previously observed for GUS activity in a promoter-trap line (Yuan et al., 2008). Other researchers have also reported that OsMT-I-4b is expressed in roots and anthers at later stages, i.e. ST10 and ST11 (Hu et al., 2011). Therefore, all of these expression patterns would explain why we did not detect OsMT-I-4b in our yeast screening assay with the inflorescence cDNA library.
ROS Are Rarely Accumulated in dtc1 Anthers
Because MT proteins have ROS-scavenger activity (Wong et al., 2004; Hu et al., 2011), the interaction between DTC1 and MTs would suggest that DTC1 is involved in ROS homeostasis. Therefore, we analyzed levels of the superoxide anion in wild-type and dtc1-1 anthers with NBT, a widely used indicator that forms a dark-blue formazan precipitate when in contact with superoxide (Bielski et al., 1980). In wild-type anthers, staining was darkest during ST8 and ST9, but weak at ST10 and ST11 (Fig. 10A). In contrast, the degree of staining was much less in the mutant at ST8 and ST9, showing that ROS levels were lower there. We quantified superoxide levels using a water-soluble tetrazolium salt reagent (WST-1: Na,2-[4-iodophenyl]-3-[4-nitrophenyl]-5-[2,4-disulfophenyl]-2H-tetrazolium), which is reduced by superoxide to a stable water-soluble formazan with high molar absorptivity (Tan and Berridge, 2000). As observed from the NBT assays, levels of superoxide in the wild-type were highest at ST9 but reduced at ST10 and ST11 (Fig. 10B). Tapetal PCD was initiated early in anther development (ST8 and ST9) when the levels of superoxide were increased. These observations were consistent with other reports that ROS function as a signal for PCD (Fath et al., 2001; Obara et al., 2001; Li et al., 2006; Mühlenbock et al., 2007). In our dtc1 anthers, superoxide levels remained low during all stages of development (Fig. 10B). These results suggested that optimal levels of ROS are required for PCD and that low amounts in mutant anthers delay tapetum degeneration.
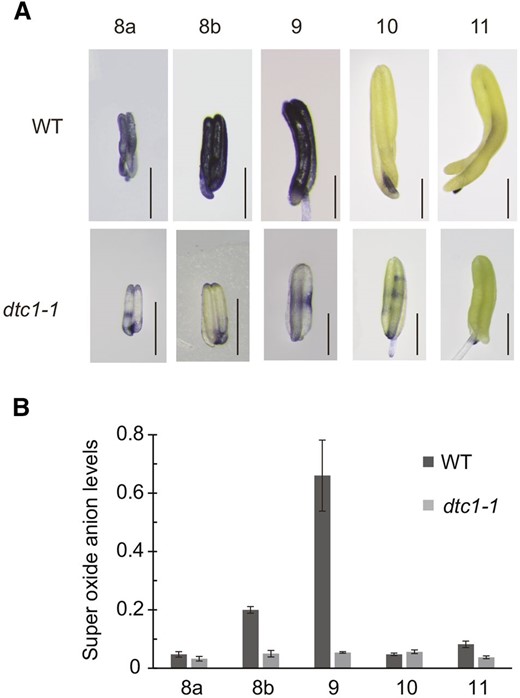
Analyses of superoxide anion levels. A, NBT staining of superoxide anion from wild type and dtc1-1 anthers from ST8a to ST11. Bars = 0.5 mm. B, Superoxide anion levels measured by WST-1.
DISCUSSION
DTC1 Is a Newly Discovered Regulator of Tapetal PCD
After meiosis, the rice tapetum undergoes PCD-triggered cellular degradation that is assumed to provide nutrients and signaling molecules to support pollen development (Li et al., 2006; Li et al., 2011). Tapetal PCD is characterized by sequential cytological processes, including cytoplasmic shrinkage, DNA fragmentation, vacuole rupture, and swelling of the ER (Papini et al., 1999). Tapetal cell specification, development, and subsequent degeneration coincide very well with postmeiotic events, and premature or delayed tapetal PCD frequently causes male sterility (Li et al., 2006, 2011; Niu et al., 2013).
Previous forward and reverse genetics studies have uncovered several key regulators of tapetal PCD in rice. These include GAMYB (Aya et al., 2009; Liu et al., 2010); the bHLH transcription factors UDT1 (Jung et al., 2005), TIP2 (Fu et al., 2014), TDR (Li et al., 2006; Zhang et al., 2008), and EAT1/DTD (Ji et al., 2013; Niu et al., 2013); a PHD finger protein, PERSISTENT TAPETAL CELL1 (PTC1) (Li et al., 2011); a homolog of animal antiapoptosis, APOPTOSIS INHIBITOR5 (API5; Li et al., 2011); and OsMADS3 (Hu et al., 2011). Here, we identified a new tapetal PCD regulator protein, DTC1, that contains a DCD domain and KELCH repeats. DTC1 is expressed in the early stages of anther development. The dtc1 mutants have delayed tapetal PCD, as evidenced by a lack of obvious DNA fragmentation and no degeneration of tapetal cells and middle layer.
DTC1 Inhibits ROS-Scavenging Activity by Interacting with OsMT2b
In plants, ROS are produced when O2 is employed as a terminal electron acceptor, generating molecules such as superoxide anion, hydroxyl radicals, and H2O2. Most of these ROS molecules are toxic by-products of aerobic metabolism in plants under abiotic stress (Miller and Mittler, 2006). Plants utilize various enzymes and nonenzymatic molecules to remove these toxins (Mittler et al., 2004). These include the Cys-rich MTs, which are nonenzymatic, low-molecular-mass antioxidants (Gechev et al., 2006; Hu et al., 2011). Recombinant MT2b and MT-1-4b proteins show superoxide- and hydroxyl radical-scavenging activities (Wong et al., 2004; Hu et al., 2011). A reduction in MT2b or MT-1-4b expression results in the accumulation of ROS molecules in rice roots (Steffens and Sauter, 2009) and anthers (Hu et al., 2011), respectively. Mutations in OsMADS3 cause decreased expression of MT-1-4b, leading to higher accumulations of ROS molecules. Consequently, the mutants display oxidative stress-associated defects such as brown-colored anthers with degenerated microspores that result from oxidative damage to the lipid, protein, and other metabolic pathways (Hu et al., 2011; Qu et al., 2014).
In addition to their toxic effects, ROS are important signaling molecules that affect various plant processes, e.g. root hair patterning and leaf development (Gechev et al., 2006; Miller et al., 2008). The superoxide anion radical and H2O2 modulate plant cell death, including tapetal PCD (Bouchez et al., 2007). Here, we showed that OsMT2b is highly expressed at the early stages of anther development and is likely a key player in reducing ROS levels. Consistent with its role in tapetal cells, laser microdissection transcriptome analyses have indicated that OsMT2b is a tapetum-preferential gene (Hobo et al., 2008). Similarly, MT1a in Arabidopsis and Mzm3-4 in maize (Zea mays) are specifically expressed in tapetal tissues (García-Hernández et al., 1998; Charbonnel-Campaa et al., 2000), suggesting that these tapetum-specific MTs may have a conserved function among plant species. We previously measured increased levels of ROS in rice anthers at ST9 but greatly reduced amounts at ST10, which is consistent with the initiation of tapetal PCD (Hu et al., 2011). The dtc1 anthers contained fewer ROS, which probably delayed tapetal PCD. Furthermore, we found that DTC1 physically interacts with OsMT2b. We hypothesize that this interaction may inhibit the ROS-scavenging activity of OsMT2b. Mammalian MTs interact with zinc-dependent enzymes that are capable of deactivating MTs (Atrian and Capdevila, 2013). However, suppression of ROS-scavenging activity of MTs by an inhibitory protein has not been previously reported in plants.
In the absence of DTC1 in the dtc1 mutants, OsMT2b continuously eliminates ROS, such that PCD is not induced in the tapetum. This indicates that temporal production of ROS is needed for tapetal PCD. Our result is similar to that reported for Arabidopsis mutants in RESPIRATORY-BURST OXIDASE HOMOLOG (RBOH) genes, which show delayed tapetal PCD and a reduced amount of ROS signals when compared with wild-type anthers where the ROS level peaks during ST8 and ST9 before decreasing at later stages (Xie et al., 2014). Timely production of ROS is essential for proper initiation of tapetal PCD. Pregeneration of ROS causes premature tapetal PCD and sporophytic male sterility (Luo et al., 2013). Mitochondrial gene WA352, originating from wild rice (Zizania palustris), confers cytoplasmic male sterility. The protein interacts with the nuclear-encoded mitochondrial protein COX11 to inhibit COX11 functioning in peroxide metabolism, leading to ROS burst. Release of cytochrome cf from the mitochondria is a key character in animal apoptosis, being required for the formation of the apoptosome, a molecular system activating caspases (Balk et al., 1999; Zou et al., 1999). Although evidence for apoptosome formation is lacking in plants, the release of cytochrome c is associated with premature induction of PCD in the tapetum of cytoplasmic male sterility mutants from Sunflower (Helianthus annuus; Balk and Leaver, 2001).
Regulatory Role of DTC1 during Anther Development
To understand the regulatory positioning of DTC1 among rice genes involved with anther development, we monitored UDT1, TDR, and EAT1/DTD in dtc1 anthers and observed no changes in their expression. This suggested that DTC1 acts downstream of those tapetal PCD regulators. Accordingly, levels of DTC1 transcript were reduced in tdr anthers. In addition, the dtc1 tapetum displayed a phenotype of delayed PCD that was similar to tdr even though the tapetal cells were not noticeably enlarged in the former (Li et al., 2006). Therefore, we could again conclude that DTC1 functions later than TDR. TDR is a key transcription factor that controls tapetal PCD by inducing OsCP1 and OsC6 (Li et al., 2006). In addition, EAT1/DTD promotes tapetal PCD by increasing aspartic proteases expression (Niu et al., 2013). Expression of EAT1/DTD is reduced in tdr and eat1 tdr double mutants that have expanded tapetal cells similar to those of tdr. Although it is possible that EAT1/DTD acts downstream of TDR in regulating tapetal PCD (Niu et al., 2013), those two proteins, EAT1/DTD and TDR, interact with each other (Ji et al., 2013; Niu et al., 2013). When compared with the dtc1 phenotype, eat1 anthers had thicker and darker-stained tapetal cells at ST9. Therefore, because EAT1/DTD transcript levels were similar between dtc1 and the wild type, it seems that DTC1 functions later than EAT1/DTD. The promoter region of DTC1 contains an E box (CATGTG at −456 bp from ATG), which is a putative target sequence of bHLH transcription factors (Bouchard et al., 1998; Chinnusamy et al., 2003). This sequence may be a binding site of the bHLH transcription factors UDT1, TDR, and EAT1.
Transcripts of OsAP25, and OsAP37, encoding aspartic protease, were diminished in dtc1 anthers. Likewise, OsC6 and CYP704B2, involved in lipid allocation and metabolism, were affected. Those genes are down-regulated in tapetal PCD mutants such as tdr, eat1/dtd, and ptc1 (Li et al., 2006; Li et al., 2011; Niu et al., 2013). CP1, encoding Cys protease, is not as strongly expressed in dtc1 as observed from eat1 (Niu et al., 2013). However dtd, an allele of eat1, shows higher CP1 expression when compared with the wild type. This discrepancy may be due to the mutant position. Unlike eat1-1, the mutation in that dtd allele does not affect the bHLH domain, suggesting that the partial CP1 fragment in dtd may function negatively (Ji et al., 2013). Whereas their expression is maximized at later stages of anther development (Hobo et al., 2008), DTC1 is highly expressed during the early stages. Thus, DTC1 may function prior to these secretory proteins.
MATERIALS AND METHODS
Genotyping and Identification of dtc1 Mutants
Seeds from heterozygous rice lines 1A-12132 (dtc1-1) and 1C-01160 (dtc1-2) were germinated, and seedlings were grown for 10 d at 28°C on a half-strength Murashige and Skoog medium containing 3% Suc. Their DNA was isolated by the hexadecyltrimethylammoniumbromide method (Chen and Ronald, 1999). Genotypes were determined by PCR, using gene-specific primers and T-DNA primers (Supplemental Table S1; Yi and An, 2013).
Histochemical Analyses
Spikelets collected at different developmental stages were fixed with 3% (w/v) paraformaldehyde and dehydrated in an ethanol series. The samples were embedded in Technovit 8100 resin (Heraeus Dental International, http://heraeus-dental.com), then sectioned to a 5- to 10-μm thickness, stained with 0.1% toluidine blue, and observed with an Olympus BX61 microscope (Olympus, http://www.olympus.com). Histochemical GUS-staining using the gene-trap line 1A-12132 (DTC1/dtc1-1) was performed as described by Jefferson et al. (1987). Afterward, the tissues were embedded and sectioned as mentioned above. For staining of the superoxide anion, intact anthers were incubated in 10 mm potassium-citrate buffer (pH 6.0) containing 0.5 mm NBT (Frahry and Schopfer, 2001).
Ultrastructural Analyses by Transmission Electron Microscopy
Anthers were fixed in sodium phosphate buffer (pH 7.2) that contained 3% glutaraldehyde (Sigma-Aldrich, http://www.sigmaaldrich.com). They were then post-fixed using 2% osmium tetroxide (Pelco International, http://www.pelcoint.com). After dehydration, the specimens were placed in a Spurr’s low-viscosity embedding mixture (EMS, http://www.emsdiasum.com/). Ultrathin sections (40- to 60-nm thick) were stained with 2.5% uranyl acetate and 2.5% lead citrate aqueous solutions, and observed under a JEM-1230 transmission electron microscope (JEOL, JEOL Ltd, Tokyo, Japan) at 80 kV.
TUNEL Assays
Preparation of the anther sections and TUNEL assays with a Dead End Fluorometric TUNEL Kit (Promega, https://www.promega.com) were performed as described by Li et al. (2006). The green fluorescence of fluorescein (TUNEL signal) and red fluorescence of propidium iodide were analyzed at 488 nm (excitation) and 520 nm (detection), and 488 nm (excitation) and 610 nm (detection), respectively, under the Olympus BX61 microscope.
Subcellular Localization and Bi-FC
The coding regions of DTC1, OsMT2b, and OsMT-I-4b were amplified using primers shown in Supplemental Table S1. The fragments were inserted into pGA3452 and pGA3574 vectors for sGFP and mRFP tags, respectively (Kim et al., 2009). For Bi-FC, the coding regions of DTC1 and MTs OsMT2b and OsMT-I-4b were fused to N- and C-terminal YFP (Venus) fragments (Waadt et al., 2008) using primers listed in Supplemental Table S1. YFP fluorescence can be detected if the expressed bait and prey proteins interact in vivo (Walter et al., 2004). Protoplast preparation from rice Oc cells and transformation procedures were conducted as described by Moon et al. (2008). After 12 h of incubation at 25°C under darkness, the protoplast cells were examined under the Olympus BX61 microscope, which was equipped with filter sets for GFP, RFP, and YFP
Co-IP Assays
For generation of DTC1-Myc, OsMT2b-HA, and OsMT-I-4b-HA fusion proteins, the coding regions of their genes were amplified using the primer sets listed in Supplemental Table S1. We used pGA3697 and pGA3698 (Kim et al., 2009) for the Myc and HA tags, respectively. The constructs were transformed into protoplasts isolated from rice Oc cells. After incubation, the protoplasts were harvested and used for Co-IP assays as previously reported, but with minor modifications (Choi et al., 2014). The immunoprecipitation buffer contained 50 mm Tris- HCl (pH 7.5), 5 mm EDTA, 50 mm sodium chloride, 1% [v/v] Triton X-100, 1 mm DTT, and an adequate amount of protease inhibitor cocktail (Roche, https://lifescience.roche.com).
Determination of Superoxide Anion Levels
For quantifying the superoxide anion, anthers freshly detached from 70 florets were incubated in 1 mL of potassium phosphate buffer (20 mM; pH 6.0) that contained 0.5 mm WST-1 (Dojindo, www.dojindo.com), and were placed on a shaker for 8 h at 25°C in the dark. As the control, we used blanks without anthers. After incubation, the samples were measured at 440 nm with a spectrophotometer (Frahry and Schopfer, 2001).
RNA Extraction and Quantitative real-time RT PCR
Total RNA was isolated and cDNAs were synthesized as described previously (Lee and An, 2015). Gene expression was monitored by quantitative real-time RT PCR (see Lee and An, 2015). All experiments were conducted at least three times, using three or more independent samples per experiment. Primers for analyzing transcript levels are listed in Supplemental Table S1.
Sequence data from this article can be found in the GenBank/EMBL data libraries under accession numbers DTC1 (Os07g0540366), OsMT2b (Os05g0111300), OsMT-I-4b (Os12g0571100), MSP1 (Os01g0917500), UDT1 (Os07g0549600), DTM1 (LOC_Os07g43010 / Non-RAP-DB ID), TDR (Os02g0120500), EAT1 (Os04g0599300), OsC6 (Os11g0582500), OsCP1 (Os04g0670500), CYP704B2 (Os03g0168600), OsAP25 (Os03g0186900), OsAP37 (Os04g0448500).
Supplemental Data
The following supplemental materials are available.
Supplemental Figure S1. Alignments of proteins containing DCD domain and KELCH repeats.
Supplemental Figure S2. Transmission electron microscopy of dtc1-1 anthers at ST10.
Supplemental Figure S3. Subcellular localization experiment using rice Oc protoplasts.
Supplemental Table S1. Primer sequences used in this study.
ACKNOWLEDGMENTS
We thank Kyungsook An for generating the transgenic lines and handling the seed stock, and Priscilla Licht for editing the English composition of this article.
Glossary
- PCD
program cell death
- ROS
reactive oxygen species
- DCD
development and cell death
- Bi-FC
bimolecular fluorescence complementation
- Co-IP
coimmunoprecipitation
LITERATURE CITED
Author notes
This work was supported in part by grants from the Cooperative Research Program for Agriculture Science and Technology Development (Project No. PJ01108001), Rural Development Administration, Republic of Korea; the Republic of Korea Basic Research Promotion Fund (Grant No. NRF-2007-0093862); and Kyung Hee University (20130214) to G.A.
These authors contributed equally to the article.
Address correspondence to [email protected].
The author responsible for distribution of materials integral to the findings presented in this article in accordance with the policy described in the Instructions for Authors (www.plantphysiol.org) is: Gynheung An ([email protected]).
S.M. conceived the original research plan; J.Y. and S.M. designed the experiments and analyzed the data; J.Y. performed the transcriptomics experiments and TUNEL assay; S.M. performed histological analysis and crossing; Y.S.L. performed ROS level analysis; L.Z and W.L. performed the transmission electron microscope analyses; J.Y. wrote the article with contributions of D.Z, K.-H.J., and G.A; and G.A. supervised and complemented the writing.
Articles can be viewed without a subscription.
