


Abstract
In eukaryotic cells, histones are subject to a large number of posttranslational modifications whose sequential or combinatorial action affects chromatin structure and genome function. We identified acetylation at Lys-36 in histone H3 (H3K36ac) as a new chromatin modification in plants. The H3K36ac modification is evolutionary conserved in seed plants, including the gymnosperm Norway spruce (Picea abies) and the angiosperms rice (Oryza sativa), tobacco (Nicotiana tabacum), and Arabidopsis (Arabidopsis thaliana). In Arabidopsis, H3K36ac is highly enriched in euchromatin but not in heterochromatin. Genome-wide chromatin immunoprecipitation sequencing experiments revealed that H3K36ac peaks at the 5′ end of genes, mainly on the two nucleosomes immediately distal to the transcription start site, independently of gene length. H3K36ac overlaps with H3K4me3 and the H2A.Z histone variant. The histone acetyl transferase GCN5 and the histone deacetylase HDA19 are required for H3K36ac homeostasis. H3K36ac and H3K36me3 show negative crosstalk, which is mediated by GCN5 and the histone methyl transferase SDG8. Although H3K36ac is associated with gene activity, we did not find a linear relationship between H3K36ac and transcript levels, suggesting that H3K36ac is a binary indicator of transcription.
Nuclear DNA of eukaryotes is packed in chromatin, the basic unit of which is the nucleosome, consisting of 147 bp of DNA wrapped around a protein octamer formed by two copies each of four histones (H2A, H2B, H3, and H4). Chromatin structure and composition are dynamically regulated both temporally and spatially within the nucleus. Covalent modifications of histones play an important role in the regulation of gene expression by changing chromatin structure (Strahl and Allis, 2000; Jenuwein and Allis, 2001). Many histone modifications have been identified, including acetylation, methylation, phosphorylation, and ubiquitinylation (Cannon, 1955; Zhang et al., 2007). It has been proposed that histone modifications act in a combinatorial manner to establish specific chromatin states that regulate gene expression (Strahl and Allis, 2000; Jenuwein and Allis, 2001). It has been argued, however, that chromatin-dependent gene activity is only a consequence of the cumulative effect of histone modifications rather than the interpretation of an alphabet (Henikoff, 2005). Using high-throughput methods with improved sensitivity, specificity, and resolution such as mass spectrometry and chromatin immunoprecipitation (ChIP) coupled to sequencing (ChIP-seq), the genomic localization, combinatorial patterns, and enrichment of histone modifications can be resolved at the level of individual nucleosomes (Liu et al., 2005; Kharchenko et al., 2011).
Histone acetylation is a dynamic and reversible modification, in which an acetyl group is transferred from acetyl-CoA to histone Lys residues. Lys acetylation neutralizes positive charges of the histone tails, thus decreasing their affinity for negatively charged DNA (Hong et al., 1993). Acetylated lysines can be recognized by histone code readers such as Bromo domain proteins (Sanchez et al., 2014), which then may promote the recruitment of additional chromatin remodeler or modifier complexes to relax chromatin and facilitate the binding or activation of RNA polymerases (Bannister and Kouzarides, 2011). Histone Lys acetylation is often associated with transcription and has important roles in numerous developmental and biological processes, including the regulation of cell cycle, flowering time, response to environmental conditions, and hormone signals (Chen and Tian, 2007; Luo et al., 2012).
Several N-terminal Lys residues of histone H3 (K9, K14, K18, K23, and K27) and H4 (K5, K8, K12, K16, and K20) are known to be acetylated in Arabidopsis (Arabidopsis thaliana; Berr et al., 2011). Histone acetylation is dynamically regulated with a usual half-life of 2 to 3 min in human cell lines that rarely exceeds 30 to 40 min (for review, see Iwamoto et al., 2015). This rapid turnover strongly suggests that instead of influencing long-term epigenetic memory, acetylation participates in short-term alterations of chromatin states (Barth and Imhof, 2010). Homeostasis of histone acetylation is maintained by histone acetyl transferases (HATs), which catalyze the histone acetylation, and histone deacetylases (HDACs), which remove the acetyl group (Pandey et al., 2002).
Histone Lys methylation is another well-studied epigenetic modification with both activating and repressing roles in gene expression. Histone Lys residues can be mono-, di-, or trimethylated. Each distinct methylation state confers different functional outcomes depending on the methylated histone residue, the degree of methylation, and the chromatin context (Liu et al., 2010). Methylated lysines constitute landmarks for binding of chromo, MBT, Tudor, W40 domain, or PHD fingers containing proteins, which subsequently recruit additional protein complexes resulting in the compaction or relaxation of chromatin structure (Greer and Shi, 2012).
Compared to yeast and animals, much less is known about the repertoire of histone modification sites in plants. Pioneering work in Arabidopsis includes genome-wide chromatin indexing by ChIP (Roudier et al., 2011; Sequeira-Mendes et al., 2014) and characterization of histone modifications by mass spectrometry (Johnson et al., 2004; Bergmüller et al., 2007; Zhang et al., 2007). In order to expand this knowledge, we implemented HPLC histone separation in combination with mass spectrometry to identify uncharacterized modifications on the N-terminal tail of histone H3 in Arabidopsis and its close relative cauliflower (Brassica oleracea). We found H3K36 acetylation (H3K36ac) as a novel histone modification in plants. GCN5, a HAT, and HDA19, an HDAC, contribute to H3K36ac homeostasis. H3K36ac is enriched in euchromatic regions and excluded from heterochromatin. In addition, H3K36ac is generally found at the 5′ end of transcriptionally active genes where it overlaps with H3K4me3 and the H2A.Z histone variant. As H3K36 can also be mono-, di-, or trimethylated, we tested if the mechanisms of trimethylation or acetylation of H3K36 are interdependent. H3K36ac was increased in a mutant with reduced H3K36me3, and H3K36me3 was increased in gcn5 mutants with reduced H3K36ac. Thus, acetylation and methylation at H3K36 are in a competitive equilibrium that defines two alternative states.
RESULTS
The Histone H3 Modification Profile Is Conserved in Brassicaceae
A histone extract from cauliflower heads was subjected to reverse-phase HPLC, and fractions corresponding to H3 based on immunoblot detection were collected and analyzed by liquid chromatography-tandem mass spectrometry (LC-MS/MS) using an LTQ-Orbitrap XL instrument. For the analysis of long peptides both collision-induced dissociation (CID) and electron transfer dissociation (ETD) fragmentation were performed (Supplemental Fig. S1). The high accuracy achieved in the MS measurements allowed to distinguish between trimethylated and acetylated peptides (Ɗm = 0.0364 D). Data were submitted to the Mascot search engine for identification of proteins and posttranslational modifications, with a focus on acetylation and methylation. This produced a map of H3 acetylation and methylation in cauliflower inflorescences (Supplemental Table S1). Most of the identified H3 modifications and their combinations are consistent with those in Arabidopsis (Johnson et al., 2004; Zhang et al., 2007), suggesting a high conservation of the histone modifications.
H3K36ac Is a New Modification in Arabidopsis
We identified H3K36ac as a novel H3 modification in plants (Supplemental Table S1). H3K36ac was found in two independent experiments using different enzymes (Chymotrypsin and ArgC). The confidence for the localization of the modification site was higher than 90%. The tandem mass spectrometry (MS/MS) spectrum of the ArgC-digested histone H3 shown in Figure 1A details the c and z fragmentation ions for the parent peptide with an observed mass of m/z 1504.8468. The accurate mass of the recorded parent ion was consistent with peptide acetylation (ƊM = 42.0106 D) and not trimethylation (ƊM = 42.0470 D). Importantly, we detected H3K36 mono-, di-, and trimethylation on other H3 peptides, confirming that this amino acid can be either methylated or acetylated (Fig. 1A; Supplemental Figs. S2 and S3).
![Identification of H3K36ac in cauliflower. MS/MS fragmentation spectrum of the [M+2H]2+ parent ion at m/z 1504.8474. This peptide was identified as the H3 peptide (histone H3, amino acids 27–40) derived from ArgC-digested RP-HPLC-purified cauliflower H3. The position of acetylation at Lys-36 is displayed; the scale for the y axis represents the relative abundance of the parent ion. Above the spectrum is the peptide sequence in which predicted c-type ions, which contain the N terminus of the peptide, are immediately above the sequence. Predicted z-type ions, which contain the C terminus, are immediately below the sequence; ions observed in the spectrum, which represent masses associated with the fragmented peptides from the MS/MS analyses, are underlined.](https://oup.silverchair-cdn.com/oup/backfile/Content_public/Journal/plphys/170/3/10.1104_pp.15.01744/3/m_plphys_v170_3_1566_f1.jpeg?Expires=1750254663&Signature=dwTLp8uJPcsVGhZ0vjjMjH9isWZv~eo-eoqF7VFVLqLyipVnE-3RRj1~kiNcHDz7yyBgjZ7HzHpPGG3yKEAOsj6eaGeSZqVBcYKhMshU8osVzu~xiABErPum6DP10e0nv0i3ujWbK5uWLwjQ~a5dYfarVKkb3~vdrTl5u91FJoSRI6ifsTG84rEd5ovcjhUa7u0vE21HgEPI4zKKhBDgFf4e5ALhqpwnAuzkUBndSf6ehjTzh-2xNowNZbwmO2BIuaiot0q7WSScu7DIqIlUfLqITrIbiYqnLvE-7p3nLf3IqWrSXYNEGmm7X6fGFwUhqlW~WtHVY0qLlDrIkCCfPQ__&Key-Pair-Id=APKAIE5G5CRDK6RD3PGA)
Identification of H3K36ac in cauliflower. MS/MS fragmentation spectrum of the [M+2H]2+ parent ion at m/z 1504.8474. This peptide was identified as the H3 peptide (histone H3, amino acids 27–40) derived from ArgC-digested RP-HPLC-purified cauliflower H3. The position of acetylation at Lys-36 is displayed; the scale for the y axis represents the relative abundance of the parent ion. Above the spectrum is the peptide sequence in which predicted c-type ions, which contain the N terminus of the peptide, are immediately above the sequence. Predicted z-type ions, which contain the C terminus, are immediately below the sequence; ions observed in the spectrum, which represent masses associated with the fragmented peptides from the MS/MS analyses, are underlined.
To validate and extend the mass spectrometry results, a histone extract from Arabidopsis inflorescences was separated by PAGE and probed with an anti-H3K36ac antibody. The antibody was previously tested for specificity in dot blots and protein immunoblots using modified and unmodified peptides and validated for ChIP-seq (Morris et al., 2007; Egelhofer et al., 2011). The antibody showed no cross-reactivity with 11 different tested acetylated histone peptides (H2AK5ac, H3K14ac, H3K18ac, H3K27ac, H3K4ac, H3K9ac, H4K12ac, H4K16ac, H4K5/8/12/16ac, H4K5ac, and H4K8ac) and many unmodified or methylated histone peptides. The positive signals for Arabidopsis histone extracts (Fig. 2A) confirmed the mass spectrometric identification of the H3K36ac modification in plants. Together, proteomic and molecular methods support the identification of H3K36ac as a novel histone modification in Brassicacea.
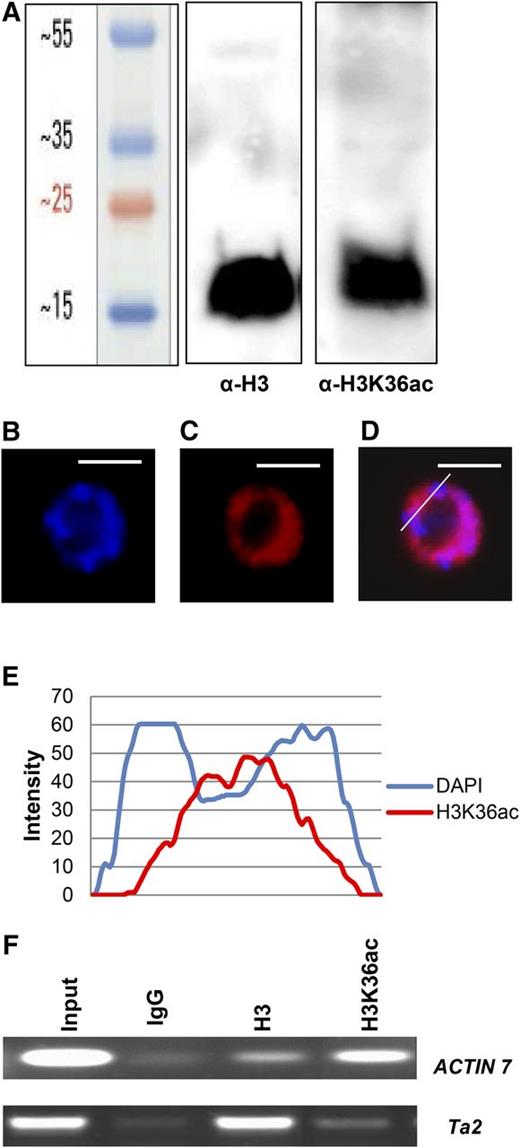
Detection of H3K36ac in Arabidopsis. A, Acid-extracted histones from Arabidopsis inflorescences were resolved on a 15% SDS-PAGE gel, followed by protein immunoblotting using anti-H3 and anti-H3K36ac antibodies. B and C, Localization of H3K36ac in root tip nuclei. Root tip interphase nuclei of Arabidopsis plants were stained with DAPI (B) and analyzed for immunofluorescence using an anti-H3K36ac antibody (C). D, The overlay of DAPI and H3K36ac signal. The line indicates a section through the nucleus that was analyzed using ImageJ software. E, Quantitative line profiles of DAPI (blue) and H3K36ac (red) florescence intensities. Bars = 5 μm. F, X-ChIP assays were performed using IgG, anti-H3, and anti-H3K36ac antibodies with primers against the active ACTIN7 gene and the silent Ta2 transposable element.
H3K36ac Is Present in Euchromatin
To establish the distribution of H3K36ac in the nucleus, paraformaldehyde-fixed Arabidopsis root tip nuclei were immunostained using the anti-H3K36ac antibody. H3K36ac fluorescence signals were absent from nucleoli and 4′,6-diamino-phenylindole (DAPI)-dense chromocenters, which mostly comprise centromeric and pericentromeric repeats. In contrast, H3K36ac staining was observed in euchromatic regions (Fig. 2, B–E), indicating that most H3K36ac is associated with less condensed, gene-rich regions and possibly active genes. To test this prediction, formaldehyde-cross-linked ChIP (X-ChIP) was performed using anti-H3K36ac and anti-H3 antibodies. Indeed, H3K36ac levels were high at the transcribed euchromatic ACTIN7 gene but low at the silent heterochromatic Ta2 transposon (Fig. 2F). The increased H3 signal at Ta2 is consistent with earlier reports and might be related to the more compact chromatin structure in heterochromatin (Rehrauer et al., 2010; Shu et al., 2012). Together, these results suggest that H3K36ac is present on active genes in euchromatin but not on heterochromatic loci.
H3K36ac Is Associated with the First Two Nucleosomes of Transcriptionally Active Genes
We performed a native ChIP-seq experiment to determine the genome-wide localization of H3K36ac at mononucleosome resolution (Supplemental Table S2). To control for nucleosome density, H3K36ac reads were normalized to the anti-H3 read counts. After mapping to the five Arabidopsis chromosomes, the highest enrichment was found along chromosome arms. In contrast, pericentromeric heterochromatic regions were considerably less enriched (Supplemental Fig. S4). Furthermore, the H3K36ac coverage profile was similar to the gene density distribution, consistent with an enrichment of H3K36ac at or near genes. These results support the H3K36ac immunolocalization data. To explore the distribution of H3K36ac along gene bodies in more detail, averaged coverage profiles were plotted around transcriptional start sites (TSSs) and transcriptional termination sites (TTSs) for all annotated gene models (Fig. 3A). The results show a strong enrichment of H3K36ac between 35 and 516 bp downstream of the TSS (positions with 50% of maximal peak height). In contrast, H3K36ac was not enriched in promoter regions, in gene bodies beyond the first 500 bp distal to the TSS, or around TTSs.
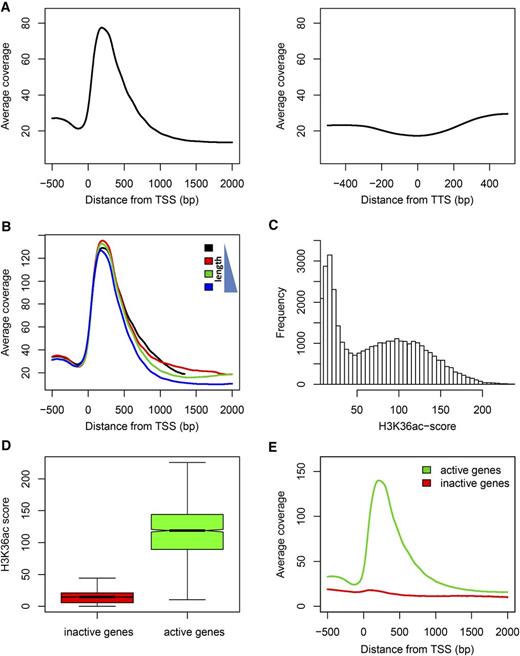
H3K36ac distribution across genes. A, Metagene plots of H3K36ac enrichment around the TSS (left panel) and TTS (right panel). The highest enrichment was detected within the first 500 bp distal to the TSS. B, H3K36ac enrichment is independent of gene length. Metagene plots are shown for the first (black), second (red), third (green), and forth (blue) length quartile where the black line represents the 25% shortest genes. C, Distribution of gene-specific H3K36ac scores defined as the mean H3K36ac signal within a window of 35 to 516 bp distal to the TSS. Note the two separate populations of genes with scores of less or more than 27, respectively. D, Relation between H3K36ac score and transcriptional state. H3K36ac scores are shown for the 10% genes with lowest (red) and highest (green) mRNA levels, respectively. E, H3K36ac metagene plot around the TSS for the 10% genes with lowest (red) and highest (green) mRNA levels, respectively. Only active genes have the characteristic H3K36ac peak within the first 500 bp. Expression data are from Shu et al. (2012).
Next, we tested whether the width of the H3K36ac peak depended on gene length by plotting averaged H3K36ac profiles separately for bins of increasing gene length (Fig. 3B). This analysis revealed that position, shape, and width of the H3K36ac enrichment peak are independent of gene length and that H3K36ac covered only about 480 bp downstream of the TSS. This invariant pattern of the H3K36ac modification allowed the calculation of a gene-specific H3K36ac score as the mean H3K36ac signal within a TSS-distal 35- to 516-bp window. The H3K36ac score has a bimodal distribution (Fig. 3C) that allowed to separate 16,431 genes with low H3K36ac (score ≤ 27) from 10,920 genes with high H3K36ac (score > 27). To avoid confounding effects of alternative transcripts, only genes with a single annotated transcript were included in this analysis. Since H3K36ac is found at genes and the differential enrichment of this modification allows the clear distinction of two gene classes, we asked if its presence is a binary signal for transcription. Globally, genes with higher H3K36ac scores had also higher mRNA levels (Fig. 3D). Only active but not inactive genes had the pronounced H3K36ac peak near the TSS (Fig. 3E). However, the relationship between H3K36ac and transcript levels is not linear but strongly sigmoidal (red trend line in Supplemental Fig. S5), indicating that H3K36ac levels are only weakly proportional to transcription rate and instead are a qualitative indicator of transcriptional activity. This interpretation is consistent with the bimodal distribution of H3K36ac scores (Fig. 3C).
Since H3K36ac is associated with gene activity, we analyzed its relationship to other chromatin marks associated with transcription, namely, H3K4me3, H3K36me2, H3K36me3, and the histone variant H2A.Z. Similar to H3K36ac, position, shape, and width of the H3K4me3 and H2A.Z enrichment peaks are independent of gene length (Supplemental Fig. S6). In contrast, H3K36me3 and H3K36me2 profiles depend strongly on gene length. Next, averaged H3K4me3, H3K36me2, H3K36me3, and H2A.Z profiles were plotted separately for five bins of increasing H3K36ac scores. All tested chromatin marks showed a positive correlation with H3K36ac, but the correlation with H3K4me3 and H3K36me3 was most pronounced (Supplemental Fig. S7). H3K4me3, H3K36me3, and H2A.Z are restricted to the 5′-end of genes, while H3K36me2 increases toward the 3′-end. To better compare peak positions, averaged profiles for the analyzed marks were plotted together (Fig. 4). This analysis revealed that H3K36ac and H2A.Z are localized closest to the TSS and likely associated with transcription initiation and the transition to transcription elongation (H3K36ac peaks at 199 bp and H2A.Z at 252 bp distal to the TSS). Downstream of the H2A.Z peak, H3K4me3 and H3K36me3 (peaks at 368 and 629 bp, respectively) become more dominating until H3K36me2, which is associated with elongating RNA Polymerase II (Oh et al., 2008), increases toward the 3′-end of genes.
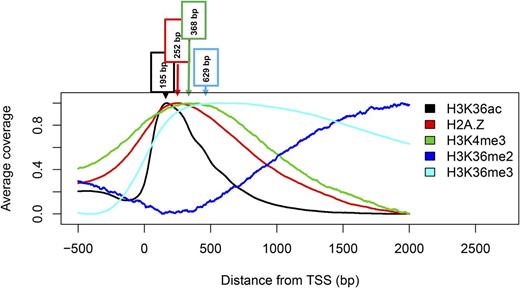
Metagene plots of active chromatin marks around the TSS. Phased enrichment of H3 modifications and the histone variant H2A.Z around the TSS. The peak of enrichment is indicated for each profile. Data are from Reed et al. (1996), Zilberman et al. (2008), and this study.
Profiling of H3K36ac specifically along active genes showed the highest enrichment around the TSS irrespective of feature length (Fig. 5, A and B), consistent with the distribution obtained when all genes were used (Fig. 3A). Enrichment of H3K36me3, on the other hand, also reaches a peak right after the TSS but then extends further toward the 3′-end (Fig. 5, C and D). Interestingly, we observed that the enrichment of H3K36me3 along the whole gene body increased with gene length (Fig. 5D). This is consistent with the model that H3K36me3 is associated with Polymerase II processivity (Oh et al., 2008).
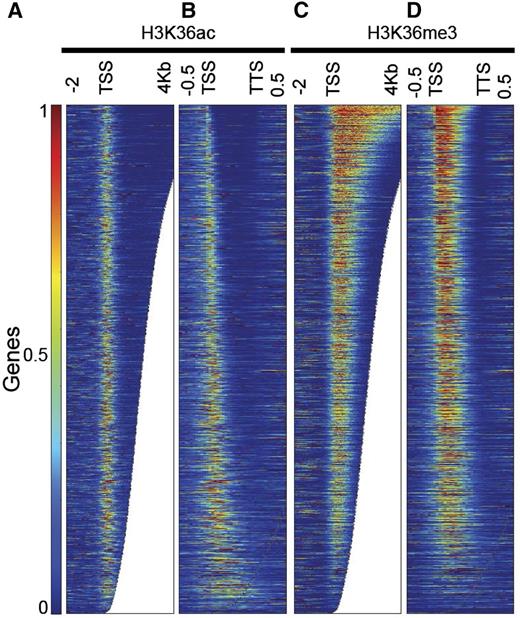
H3K36ac and H3K36me3 distribution across transcribed genes. A and B, H3K36ac enrichment along transcribed genes is shown on an absolute scale from 2 kb upstream to 4 kb downstream of the TSS (A) and on a relative scale from TSS to TTS (B). H3K36ac was mainly found in the first 500 bp of the gene body. The enrichments are similar in level and breadth irrespective of the length and the fraction of the gene being covered. C and D, H3K36me3 enrichment along transcribed genes is shown on an absolute scale from 2 kb upstream to 4 kb downstream of the TSS (C) and on a relative scale from TSS to TTS (D). H3K36me3 localizes close to the TSS and expands further toward the 3′-end. Longer genes have higher and wider levels of H3K36me3. Genes were ordered by length.
Together, H3K36ac is most enriched on +1 and +2 nucleosomes of the TSS of transcriptionally active genes and correlates with H3K4me3, H3K36me2, H3K36me3, and the histone variant H2A.Z.
H3K36ac Depends on GCN5 in Arabidopsis
Histone acetylation is established by HATs. Arabidopsis has 12 different HAT genes that are grouped into four classes (Pandey et al., 2002), of which GCN5 (GENERAL CONTROL NON DEREPRESSIBLE PROTEIN5) is highly expressed in most sporophytic tissues (Zimmermann et al., 2004). In yeast, GCN5 acetylates H3K14 (Roth et al., 2001). Because GCN5 is conserved in plants and because the H3 sequences around K14 and K36 are similar (STGGK14AP versus STGGVK36KP), we tested if Arabidopsis GCN5 acetylates H3K36 using the gcn5-1 mutant for X-ChIP assays. The TSS regions of two genes with high H3K36ac levels were analyzed using quantitative PCR. Their H3K36ac levels were reduced more than 5-fold in gcn5-1 (Fig. 6A), indicating that GCN5 is required for full H3K36 acetylation in vivo but that other HATs can also acetylate H3K36 explaining the residual H3K36ac in gcn5-1.
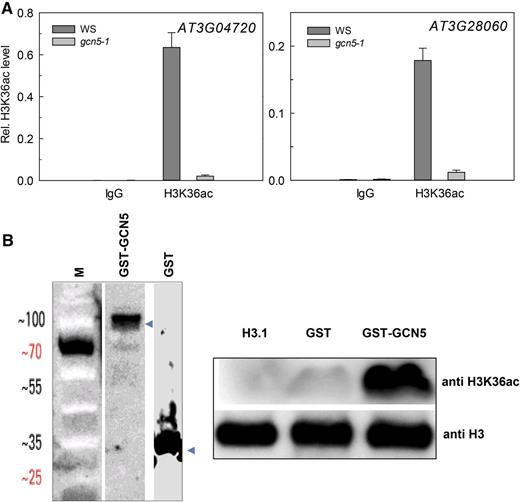
GCN5 is required for H3K36 acetylation. A, H3K36ac levels on AT3G04720 and AT3G28060 depend on GCN5. Ten-day-old seedlings were used for X-ChIP with anti-H3 and anti-H3K36ac antibodies. The enrichment of H3K36ac relative to H3 is shown as mean ± se. B, H3K36ac acetyltransferase activity of GCN5. Left: Recombinant GST and GST-GCN5 were purified with Glutathione Sepharose 4B resin, blotted, and probed with anti-GST antibodies; M, weight marker. Right: HAT assays were performed using recombinant His-H3 as substrate. The reaction products were resolved on a 15% SDS-PAGE gel, transferred to polyvinylidene difluoride membrane, and probed with anti-H3K36ac antibodies. Anti-H3 was used as control.
To test whether GCN5 can directly acetylate H3K36, in vitro HAT assays were performed using N-terminal H3 fragments and purified recombinant GST and GST-GCN5. Acetylated histone fragments were probed with anti-H3K36ac antibody. A strong signal was obtained when using GCN5 enzyme, while no signal was obtained with control GST or H3 alone (Fig. 6B). The in vivo and in vitro assays therefore establish Arabidopsis GCN5 as an H3K36 acetyl transferase and strongly suggest that it is the main enzyme depositing H3K36ac in vivo.
Competing Modifications Targeting H3K36
H3K36 can also be mono-, di-, or trimethylated at its ε-amino group. The Arabidopsis histone Lys methyltransferase SET DOMAIN GROUP8 (SDG8) deposits di- and trimethylation on H3K36 (Zhao et al., 2005; Xu et al., 2008). Considering that GNC5 and SDG8 both modify H3K36, we tested the mechanistic dependency of acetylation and methylation at H3K36. We performed X-ChIP-seq using the anti-H3K36ac antibody in sdg8-2 and an anti-H3K36me3 antibody in gcn5-1 because in our experience X-ChIP is more robust than N-ChIP when comparing genotypes. Crosstalk between GCN5 and SDG8 could result in reciprocal effects on H3K36ac and H3K36me3 enrichments, respectively. To avoid confounding effects from inactive genes, we restricted our analysis to active protein-coding genes (see Methods). Globally, H3K36ac levels in genes increased in sdg8-2, in particular close to the TSS (Fig. 7A). In addition, H3K36ac increased close to the TTS of genes in which its levels are normally low. Similarly, enrichment of H3K36me3 increased in gcn5-1 and was highest in the center of genes (Fig. 7B). This increase in enrichment of acetylation and methylation in sdg8-2 and gcn5-1, respectively, indicates that both modifications affect each other. Because the differences were found in distinct regions along gene bodies, this crosstalk probably does not reflect a direct competition for the H3K36 but an indirect functional repressive interaction between the acetylation and methylation enzymes.
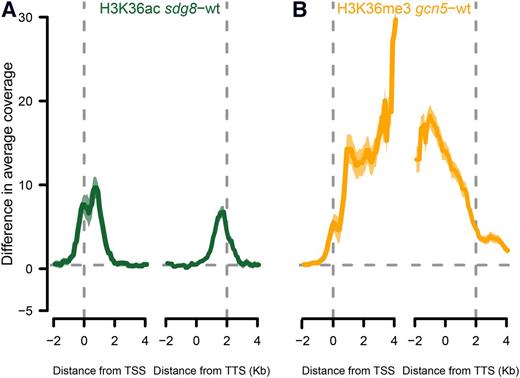
Competing modifications of H3K36 by GCN5 and SGD8. A, Gain of H3K36ac along genes in the sdg8-2 background. B, Gain of H3K36me3 along genes in the gcn5-1 background. Shaded areas represent 95% confidence intervals.
HDA19 but Not HDA6 Affects H3K36ac Levels
Eighteen different HDACs have been identified in Arabidopsis and grouped into three different classes (Pandey et al., 2002). To identify HDACs responsible for H3K36 deacetylation, we tested the possible involvement of HDA6 and HDA19, which are two major Arabidopsis HDACs. HDA6 removes acetyl groups from H3K9ac, H3K14ac, H3K18ac, H3K23ac, H3K27ac, H4K5ac, H4K8ac, and H4K12ac (for review, see Hollender and Liu, 2008). To test if HDA6 deacetylates H3K36ac, we performed X-ChIP assays with wild-type, hda6-1, and 35S::HDA6-FLAG plants using two genes with high H3K36ac levels in the wild type. No significant differences of H3K36ac levels were found in HDA6 loss-of-function or overexpressing plants (Supplemental Fig. S8), suggesting that HDA6 does not deacetylate H3K36 in vivo at least at these two loci. In contrast, a considerable increase of H3K36ac levels was found for the same genes in an HDA19 RNAi line (Fig. 8), indicating that HDA19 is one of the Arabidopsis HDACs that deacetylase H3K36ac.

HDA19 affects H3K36ac levels. H3K36ac levels on AT3G04720 and AT3G28060 are affected by HDA19 down-regulation. Ten-day-old seedlings were used for X-ChIP with anti-H3 and anti-H3K36ac antibodies. The enrichment of H3K36ac relative to H3 is shown as mean ± se.
H3K36ac Is a Conserved Histone Modification in Plants
Histones are among the most highly conserved eukaryotic proteins, and K36 is found in H3 of mouse, yeast, and plants such as Arabidopsis, tobacco (Nicotiana tabacum), wheat (Triticum aestivum), rice (Oryza sativa), and Norway spruce (Picea abies; Fig. 9A). To test if H3K36ac exists only in Brassicaceae or also in other plant species, histones were extracted from tobacco, rice, wheat, and spruce as representatives of monocotyledonous and dicotyledonous angiosperms as well as gymnosperms. The presence of H3K36ac was analyzed using protein immunoblotting with anti-H3K36ac antibody. A distinct H3K36ac band was visible in all histone preparations (Fig. 9B), indicating that H3K36ac is a highly conserved modification in seed plants and likely has a conserved biological function.
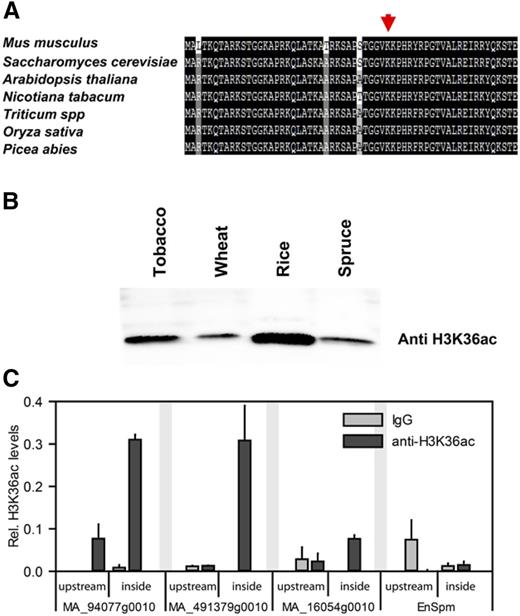
H3K36ac is conserved in seed plants. A, Amino acid alignment of the N-terminal tails of H3 from mouse, yeast, and several plants shows conservation of Lys-36. B, Acid-extracted histones prepared from tobacco, wheat, rice, and Norway spruce were resolved on 15% SDS-PAGE gels followed by immunoblotting using anti-H3K36ac antibodies. C, H3K36ac X-ChIP in Norway spruce. Shown are mean ± se (n = 3). H3K36ac is found downstream (downstr.) of the TSS on transcribed genes.
To test whether the H3K36ac enrichment on active genes is conserved in other plant species, X-ChIP was performed using Norway spruce cell culture. Two loci with low expression (MA_16054g0010 and the EnSpm transposon-like locus MA_10270349) and two loci with high expression (MA_491379g0010 and MA_94077g0010) were selected for ChIP analysis (Supplemental Fig. S9) using two primer sets for each gene: one set probing a region upstream of the transcriptional unit and the other set probing a region downstream of the TSS in the gene body near the start codon. Similar to the results in Arabidopsis, strong H3K36ac ChIP signals were present at the active genes MA_491379g0010 and MA_94077g0010, but no or only weak signals were present at the silent or lowly expressed genes (Fig. 9C). In addition, H3K36ac was much higher enriched distal of the TSS than in the promoter region. Together, these results suggest that H3K36ac is present in the 5′-region of active genes in the angiosperm Arabidopsis and the gymnosperm Norway spruce revealing a wide conservation of this modification among seed plants.
DISCUSSION
Applying the sensitive and specific CID/ETD LC-MS/MS method (Syka et al., 2004) to histone extracts from cauliflower inflorescences, we identified a novel H3 acetylation on Lys-36 in plants. CID/ETD LC-MS/MS allows sequencing of long, highly charged peptides (>20 amino acids) and even of intact proteins and has been successfully used already to determine histone PTMs (Taverna et al., 2007; Xiong et al., 2010; Jufvas et al., 2011). Our analysis confirmed most of the known Arabidopsis Lys acetylation and methylation modifications. We did not detect phosphorylated H3 peptides, which require phospho-peptide enrichment during histone extraction (Zhang et al., 2007). However, our approach identified previously unreported plant histone modifications, including H3K36ac that we analyzed in more detail. A complete list of the identified H3 posttranslational modification is reported in Supplemental Table S1.
H3K36ac was previously found in yeast, Tetrahymena, and mammals (Morris et al., 2007). Using a high specificity antibody, we confirmed the MS/MS identification of H3K36ac in plants. In addition to cauliflower, H3K36ac was also found in several other seed plants. The presence of H3K36ac in yeast, ciliates, animals, and plants suggests an evolutionary conserved function.
In Arabidopsis, H3K36ac is associated with euchromatin and excluded from heterochromatic chromocenters. It is enriched within the first 500 bp and particularly at +1 and +2 nucleosomes distal to the TSS of transcriptionally active genes, irrespective of their lengths. This presence of H3K36ac distal to the TSS of Arabidopsis genes is in contrast to yeast, in which H3K36ac is highest at promoters but mostly absent from transcribed regions (Morris et al., 2007). The restriction of H3K36ac to the 5′-end of genes and the positive correlation with gene expression suggests that it is associated with the early phase of transcription but not with elongation. Although H3K36ac marks active genes, its levels are not significantly correlated with transcription rates. H3K36ac rather marks transcribed genes in a qualitative manner with full acetylation reached even at moderate transcription rates.
The peak of H3K36ac enrichment in Arabidopsis coincided well with the H2A.Z peak at the 5′-end of gene bodies. It is not clear whether the different width of the H2A.Z and H3K36ac peaks is genuine or the result of the different ChIP methods in our study and the report for H2A.Z (Zilberman et al., 2008). The coincidence of H2A.Z and H3K36ac suggests that nucleosomes in which H3K36 is acetylated often contain the histone variant H2A.Z. It remains to be established, however, whether incorporation or presence of H2A.Z favors acetylation of H3K36 and/or H3K36ac favors H2A.Z incorporation. Similar to H3K36ac and H2A.Z, H3K4me3 and H3K36me3 peak at 5′-ends of transcriptionally active genes. In the case of H3K4me3, the peak width is independent of gene length but the peak summit is shifted to the TTS. The H3K36me3 peak is shifted even further toward the 3′-end than the H3K4me3 peak. The extension of the H3K36me3 peak strongly depends on gene length. H3K36me2 increases downstream of the H3K36me3 peak and reaches its maximum only at the 3′-end. The gradient of H3K36ac, H2A.Z, H3K4me3, H3K36me2, and H3K36me3 along transcribed genes provides a spatial map of histone modifications along transcription units.
Histone acetylation is regulated by antagonistic HAT and HDAC activities. The Arabidopsis HAT GCN5 acetylates H3K36 in vitro and is necessary to achieve full H3K36ac levels in vivo. These results are consistent with the reported activity of GCN5 in yeast (Morris et al., 2007), supporting a conserved mechanism for H3K36 acetylation in eukaryotes, although as described above, the H3K36ac patterns differ between yeast and plants (Morris et al., 2007).
The Arabidopsis genome encodes 18 HDAC proteins that are grouped into three main subfamilies (RPD3, HD2, and SIR2 family) (Pandey et al., 2002). We found that H3K36ac was increased in HDA19 RNAi lines, suggesting that HDA19 is required for H3K36ac homeostasis on target genes in vivo. It remains to be established whether other HDACs also modulate H3K36ac levels.
Despite the evolutionary conservation of H3K36 modifications, animals and yeast seem to use them in functionally different mechanisms than plants. In animals and yeast, H3K36me3 is associated with transcriptional elongation peaking toward the 3′-end, and H3K36ac in yeast is restricted to promoters. In plants, H3K36me3 peaks in the 5′-half of the gene, and H3K36ac is restricted to an approximately 480 bp distal to the TSS. In Arabidopsis, H3K36ac and H3K36me3 are found in overlapping regions downstream of the TSS. Our genome-wide analysis revealed a negative crosstalk between the HAT GCN5 and the HKMT SDG8. This resulted in increased H3K36ac levels when H3K36me3 is reduced and vice versa; however, the distinct spatial patterns of H3K36ac and H3K36me3 were not affected. Further work will be required to understand the mechanistic basis for this crosstalk. It is tempting to speculate that acetylation and methylation at H3K36 form a molecular switch, in which one of the two dominates. However, since nucleosomes have two H3 molecules, concomitant acetylation and methylation at H3K36 in the same nucleosome are possible. It remains to be shown whether such nucleosomes with asymmetrical K36 modifications do indeed exist.
MATERIALS AND METHODS
Plant Material
The following Arabidopsis (Arabidopsis thaliana) lines were previously described: HDA19-RNAi1 (Zhou et al., 2005), gcn5-1 (Vlachonasios et al., 2003), 35S:Flag-HDA6 (Earley et al., 2006), hda6-1 (Aufsatz et al., 2002), and sdg8-2 (Xu et al., 2008). The HDA19-RNAi1 was shown to have no off-target effects on the close HDA19 homolog HDA6 (Zhou et al., 2005; Mehdi et al., 2016). Seeds were sown on 0.5× basal salts Murashige and Skoog medium (Duchefa), stratified at 4°C for 1 d, and then transferred to growth chambers for germination at 20°C under long-day (16 h light) photoperiods for 10 d. The seedlings were transferred to pots containing soil and cultivated in growth chambers under long-day conditions. Tobacco (Nicotiana tabacum), wheat (Triticum aestivum), and rice (Oryza sativa) were grown in a greenhouse at 22°C in long days. Cauliflower (Brassica oleracea) was obtained from a local supermarket; Norway spruce (Picea abies) needles were collected from an approximately 15-year-old wild-grown tree in a forest close to Uppsala (Sweden) located at 59.81° N, 17.66° E. For ChIP and quantitative RT-PCR in Norway spruce, embryogenic calli (line 11:18:1:1) derived from a zygotic embryo were used (von Arnold and Clapham, 2008).
Histone Extraction and Purification from Plants
To extract histones from inflorescences of cauliflower and Arabidopsis or from fully developed leaves of tobacco, wheat, rice, and spruce, approximately 3 g of material were ground to a fine powder and homogenized for 15 min in histone extraction buffer (0.25 m Suc, 1 mm CaCl2, 15 mm NaCl, 60 mm KCl, 5 mm MgCl2, 15 mm PIPES, pH 7.0, 0.5% Triton X-100 including protease inhibitors cocktail [Roche], and 10 mm sodium butyrate). After centrifugation for 20 min at 4°C and 4,500g, pellets were dissolved in 0.1 m H2SO4. After further centrifugation for 10 min at 17,000g, total histones were precipitated from the supernatant with concentrated trichloroacetic acid to a final concentration of 33%. The histone pellet was washed twice with acetone-0.1% HCl, air dried, dissolved either in 1× Laemmli buffer and subjected to SDS-PAGE, followed by protein immunoblotting using anti-H3 (07-690; Upstate/Millipore) and anti-H3K36ac (39379; ActiveMotif) antibodies, or fractionated by reverse-phase HPLC.
Histone Fractionation by Reverse-Phase HPLC and PTM Identification by MS/MS
Bulk histones from cauliflower were prepared as described above. The pellet was dissolved in 100 μL of water, sonicated for 1 min, and centrifuged for 1 min at 10,000g. The supernatant was gently aspirated by pipetting and loaded on an ECLIPS XDB-C8 (4.6 × 150 mm; Agilent) connected to an Agilent HP1100 binary HPLC system. Histone variants were separated and eluted according to Tweedie-Cullen et al. (2009). The fractions containing H3 were combined, dried, and dissolved in 50 mm ammonium bicarbonate, pH 8.0. After reduction with DTT (10 mM) and alkylation with iodoacetamide (40 mM), histones H3 were digested for 2 h at 37°C with Chymotrypsin (enzyme:substrate ratio 1:50 [w/w]; Promega) or with Arg_C (1:50 [w/w]; Roche). Samples were desalted with C18 ZipTips (Millipore) following the manufacturer’s recommendations and dried. Peptides were resolubilized in 10 μL of 5% acetonitrile and 0.1% trifluoracetic acid and were analyzed by LC-MS/MS on an LTQ-Orbitrap XL-ETD mass spectrometer (Thermo Fischer Scientific) coupled to an Eksigent-Nano-HPLC system (Eksigent Technologies). Solvent composition at the two channels was 0.2% formic acid and 1% acetonitrile for channel A, and 0.2% formic acid and 80% acetonitrile for channel B. Peptides were resolubilized in 10 μL of 5% acetonitrile and 0.1% formic acid and loaded on a self-made tip column (75 µm × 70 mm) packed with reverse-phase C18 material (AQ, 3 μm 200 Å; Bischoff). Elution was performed with a flow rate of 200 nL/min by a gradient from 3 to 10% of B in 6 min, 35% B in 38 min, and 97% B in 45 min. One scan cycle comprised of a full-scan MS survey spectrum followed by up to six sequential CID and ETD MS/MS scans on the three most intense signals above a threshold of 500. Full-scan MS spectra (300−2000 m/z) were acquired in the FT-Orbitrap with a resolution of 60000 at 400 m/z after accumulation to a target value of 200,000, while CID and ETD MS/MS spectra were recorded in the linear ion trap (target value of 1e4 for ion trap MSn scans). The ETD anion target value was set at 3e5 and activation time at 50 ms. Supplementary activation was employed to enhance the fragmentation efficiency for 2+ precursors and charge state-dependent ETD time enabled. The ETD reaction time was 120 ms and isolation width was 3 m/z. Charge state screening was enabled and singly charge states were rejected. Precursor masses selected twice for MS/MS were excluded for further selection for 120 s. Samples were acquired using internal lock mass calibration set on m/z 429.0887 and 445.1200.
Mass spectrometry raw files were converted into Mascot generic files (mgf) with Mascot Distiller software 2.4.2.0 (Matrix Science). Peak lists were searched using Mascot Server 2.3 against the Arabidopsis TAIR10 protein database. Search parameters were as follows: requirement for chymotryptic or ArgC ends, one missed cleavage allowed, peptide tolerance ± 6 ppm, and MS/MS tolerance ± 0.5 D. Carbamidomethylation of Cys was set as fixed modification, while oxidation (Met), acetylation (N-term protein, Lys), and mono-, di-, and trimethylation (Arg and Lys) were set as variable. To assess the location of the posttranslational modification sites, we used the site localization analysis provided by Mascot. The presence of modification sites was further validated by manual inspection of spectra.
ChIP and ChIP-Seq
Native ChIP and X-ChIP assays were performed as described (Bernatavichute et al., 2008; Exner et al., 2009) using gene-specific primers (Supplemental Table S3). See supplemental information for details. For ChIP-seq, leaf number six of plants grown for 35 d under short-day conditions (8 h light) was harvested at Zeitgeber time = 7 and used for nuclei isolation. Supplemental Table S2 gives a summary of the ChIP-seq experiments.
Bioinformatics and ChIP-Seq Data Analysis
Illumina reads were mapped to the Arabidopsis reference TAIR10 genome using bowtie2 (version 2.1; Langmead and Salzberg, 2012). SAM file output from bowtie was converted to BAM format using SAMtools (version 1.4; Li et al., 2009) and imported into R (version 2.15.2; http://www.R-project.org/) using functions from the Rsamtools package. All subsequent analysis was performed in R. Identical reads present more than 25 times were considered as PCR artifacts and filtered out using the filterDuplReads function from package HtSeqTools. Replicates were pooled, and sample normalization to identical sequencing depth and H3K36ac signals was normalized to histone signals to control for variable nucleosome density using functions from package nucleR (Flores and Orozco, 2011). H3K4me3, H3K36me2, H3K36me3, and H2A.Z data were taken from the literature (Oh et al., 2008; Zilberman et al., 2008). Gene expression data are from Shu et al. (2012) and match cultivation conditions, plant age, harvest time, and tissue used here for ChIP-seq. The expression cutoff to consider a gene as active was a value of 6 in the microarray data from Shu et al. (2012), resulting in a set of 12,102 active protein coding genes. Heat maps were generated using the open source tool deepTools (Ramírez et al., 2014).
Constructs and Recombinant Protein Expression and Purification
The coding region for the N-terminal tail of H3 (amino acids 1–50) was amplified by PCR from Arabidopsis cDNA using primers LH1625 (CTATTCTCTTAAAGCAACAGTTCC, forward) and LH1626 (CACCATGGCTCGTACCAA, reverse). The PCR product was cloned into vector pET100-D-TOPO according to the manufacturer’s recommendations (Invitrogen). pGEX4T1 was obtained from Amersham Life Science; pQE30-GCN5 was previously described (Benhamed et al., 2006). Recombinant N-terminal 6xHis tagged H31-50 was expressed in Escherichia coli BL21pLys Rosetta cells and purified on Talon metal affinity resin (Clontech) according to the manufacturer’s recommendations. Recombinant GST and GST-GCN5 were expressed in BL21pLys Rosetta and purified with Glutathione Sepharose 4B resin according to the manufacturer’s recommendations (Amersham Life Science). Purified proteins were stored at −20°C until use in HAT activity assays.
HAT Activity Assays
HAT assays using recombinant GST-GCN5 expressed in E. coli were performed as follows: 1 µg of purified His-tagged histone H31-50 was mixed with purified recombinant GST-GCN5 or with GST alone in HAT buffer (0.25 μg/μL acetyl-CoA [Sigma-Aldrich], 50 mM Tris-HCl, pH 8.0, 10% [v/v] glycerol, 1 mM DTT, complete EDTA‐free protease inhibitor [Roche], and 10 mm sodium butyrate). Acetylation reactions were incubated for 60 min at 30°C with gentle shaking and terminated by addition of 2× SDS Laemmli sample buffer followed by heating for 5 min to 100°C. The reaction products were electrophoretically resolved on 15% SDS-PAGE gels and subjected to protein immunoblotting using anti-H3K36ac (Active Motif) and anti-H3 (Upstate/Millipore) antibodies.
RNA Isolation and Quantitative RT-PCR
RNA extraction and reverse transcription were performed as described previously (Alexandre et al., 2009) using gene-specific primers (Supplemental Table S3). See supplemental information for details.
Immunostaining
Immunostaining was performed as described previously (Jasencakova et al., 2000) with some modifications. See supplemental information for details.
Accession Numbers
Sequencing reads are deposited in Gene Expression Omnibus (GSE74841).
Supplemental Data
The following supplemental materials are available.
Supplemental Figure S1. Histone separation by RP-HPLC.
Supplemental Figure S2. Identification of H3K36me2.
Supplemental Figure S3. Identification of H3K36me2.
Supplemental Figure S4. Genome-wide distribution of H3K36ac on the Arabidopsis genome.
Supplemental Figure S5. H3K36ac is a qualitative mark for transcriptional activity.
Supplemental Figure S6. Dependency of histone marks on gene length.
Supplemental Figure S7. H3K36ac positively correlates with H3K4me3, H3K36me3, and H2A.Z.
Supplemental Figure S8. HDA6 does not affect H3K36ac steady state levels on AT3G04720 or AT3G28060.
Supplemental Figure S9. Expression levels of Norway spruce genes used for ChIP.
Supplemental Table S1. List of histone H3 modifications that were identified in B. oleracea.
Supplemental Table S2. Summary of ChIP-seq experiments.
Supplemental Table S3. Lists of primers used.
ACKNOWLEDGMENTS
We thank Cecilia Wärdig for technical help. We thank Keqiang Wu, Craig Pikaard, and Dao-Xiu Zhou for kindly providing seeds of HDA19-RNAi1, 35S::Flag-HDA6, gcn5-1, and the pQE30-GCN5 construct. We thank the FGCZ for Illumina sequencing.
Glossary
- ChIP
chromatin immunoprecipitation
- ChIP-seq
chromatin immunoprecipitation coupled to sequencing
- HAT
histone acetyl transferase
- HDAC
histone deacetylase
- LC-MS/MS
liquid chromatography-tandem mass spectrometry
- CID
collision-induced dissociation
- ETD
electron transfer dissociation
- MS/MS
tandem mass spectrometry
- DAPI
4′,6-diamino-phenylindole
- X-ChIP
cross-linked ChIP
- TTS
transcriptional termination site
- TSS
transcriptional start site
LITERATURE CITED
Author notes
This work was supported by grants from the Swiss National Science Foundation, the Swedish Science Foundation VR, and the Knut-and-Alice-Wallenberg Foundation.
Address correspondence to [email protected].
The author responsible for distribution of materials integral to the findings presented in this article in accordance with the policy described in the Instructions for Authors (www.plantphysiol.org) is: Lars Hennig ([email protected]).
W.M., J.M.-R., M.N., and H.S. performed the experiments; W.M., M.S.T.A., H.S., P.N., and L.H., analyzed data; W.M., C.K., and L.H. planned the experiments; W.M., M.S.T.A., C.K., W.G., and L.H. wrote the manuscript.
Articles can be viewed without a subscription.
