


Abstract
C4 photosynthesis represents an excellent example of convergent evolution that results in the optimization of both carbon and water usage by plants. In C4 plants, a carbon-concentrating mechanism divided between bundle sheath and mesophyll cells increases photosynthetic efficiency. Compared with C3 leaves, the carbon-concentrating mechanism of C4 plants allows photosynthetic operation at lower stomatal conductance, and as a consequence, transpiration is reduced. Here, we characterize transcriptomes from guard cells in C3 Tareneya hassleriana and C4 Gynandropsis gynandra belonging to the Cleomaceae. While approximately 60% of Gene Ontology terms previously associated with guard cells from the C3 model Arabidopsis (Arabidopsis thaliana) are conserved, there is much less overlap between patterns of individual gene expression. Most ion and CO2 signaling modules appear unchanged at the transcript level in guard cells from C3 and C4 species, but major variations in transcripts associated with carbon-related pathways known to influence stomatal behavior were detected. Genes associated with C4 photosynthesis were more highly expressed in guard cells of C4 compared with C3 leaves. Furthermore, we detected two major patterns of cell-specific C4 gene expression within the C4 leaf. In the first, genes previously associated with preferential expression in the bundle sheath showed continually decreasing expression from bundle sheath to mesophyll to guard cells. In the second, expression was maximal in the mesophyll compared with both guard cells and bundle sheath. These data imply that at least two gene regulatory networks act to coordinate gene expression across the bundle sheath, mesophyll, and guard cells in the C4 leaf.
C4 photosynthesis increases the efficiency of carbon gain and water use by plants and is most common in seasonally subtropical environments (Brown, 1999). Increased photosynthetic efficiency in C4 species is due to a carbon-concentrating mechanism that is initiated by carbonic anhydrase (CA) and phosphoenolpyruvate carboxylase (PPC) generating C4 acids in mesophyll (M) cells. Subsequent transfer of these C4 acids from M cells to the bundle sheath (BS), followed by decarboxylation, concentrates CO2 around Rubisco. The result of this pathway is a reduction in the futile oxygenation reaction of Rubisco that leads to photorespiration and consequent loss of carbon (Sage et al., 2012).
The evolution of C4 photosynthesis is thought to have been favored by low CO2 and high temperatures causing increased rates of photorespiration (Osborne and Sack, 2012). It is estimated that C4 photosynthesis has arisen in at least 62 lineages of land plants by a series of steps that gradually led to CO2 being concentrated around Rubisco (Sage, 2004; Heckmann et al., 2013; Williams et al., 2013). Evidence is increasing that the initial evolutionary events associated with the development of the complex C4 phenotype, such as enlargement of the BS cells, would have had a greater impact on water use efficiency (Christin et al., 2013; Griffiths et al., 2013; Williams et al., 2013). The water use efficiency of extant C4 leaves is also higher than that of C3 leaves, because the C4 carbon-concentrating mechanism allows lower stomatal conductance (gs; Taylor et al., 2010; Osborne and Sack, 2012). In C4 grasses, lower g s can be achieved either by decreasing the size of the stomatal pore or the stomatal density compared with C3 ancestors or congeneric species (Taylor et al., 2012). As a consequence of this variation in g s, stomata in C3 and C4 leaves operate at different intercellular CO2 concentrations (Ci), so the i-to-atmospheric CO2 concentration (Ca) ratio is markedly lower in C4 than in C3 leaves (Vogan and Sage, 2012).
Despite the fact that guard cells (GCs) are one of the best studied cell types in plants, our understanding of the stomatal response is fragmented (Araújo et al., 2011). It is known that GCs integrate both cell-autonomous and nonautonomous signaling networks to control the stomatal pore in response to water availability, light, and CO2. Stomatal behavior is tightly linked to CO2 concentration: opening when CO2 concentration is low and closing when CO2 is high (Kim et al., 2010). CO2-sensing mechanisms that regulate stomatal aperture involve a small cohort of genes (Hashimoto et al., 2006; Lee et al., 2008; Negi et al., 2008; Hu et al., 2010), including CA genes that are part of the core C4 pathway. However, the exact mechanism by which the CO2 signal is integrated remains unclear. Organic acids such as malate that are critical to the C4 carbon-concentrating mechanisms are also thought to be part of the CO2 signal-transducing machinery (Kim et al., 2010; Araújo et al., 2011), and variations in vacuolar, apoplastic, and cytosolic pools of malate as well as Suc are proposed to be important signals regulating stomatal behavior (Mott et al., 2008; Fernie and Martinoia, 2009; Lawson et al., 2014). Therefore, despite the fact that stomata from C3 species respond to C i, and that this parameter is typically lower in C4 leaves, it is not clear if the CO2 signaling components in C4 GCs are modified.
Although proteins such as CA play a critical role in both the C4 cycle and the GCs of C3 species (Hu et al., 2010), little is known about the expression of C4 cycle genes in GCs of C4 plants. For example, it is not known if GCs operate C3-like or C4-like photosynthesis in C4 species, nor how this connects to the homeostasis of organic acids in the M and whether GC signaling in particular of CO2 and malate is impacted by major changes in C4 anatomy and biochemistry. In this study, we first characterized stomatal behavior in C3 Tareneya hassleriana and C4 Gynandropsis gynandra (referred to previously as Cleome gynandra), which belong to the Cleomaceae, which is sister to the Brassicaceae. Using laser-capture microdissection of GCs, we then assessed transcriptomes from this cell type in both species. Therefore, we report characteristics of GC transcriptomes that are common to C3 T. hassleriana, C4 G. gynandra, as well as Arabidopsis (Arabidopsis thaliana) but also the extent to which the transcriptome of GCs from C4 leaves differs from the ancestral C3 GC. Lastly, we integrate these data into the context of the canonical C4 pathway that operates between M and BS cells of the C4 leaf and propose that this pattern of gene expression is mediated by a diffusible signal that moves between cell types.
RESULTS
C4 G. gynandra Has Lower Stomatal Conductance Than C3 T. hassleriana
The g s of mature leaves from G. gynandra and T. hassleriana was assessed using water vapor-exchange measurements (Fig. 1A; Supplemental Fig. S1). The g s of G. gynandra was markedly lower than that of T. hassleriana (Fig. 1A). Interestingly, the pattern of diurnal variation was unchanged between the two species (Supplemental Fig. S1B), suggesting that only the amplitude of g s is changed. This reduction in g s was underpinned by lower stomatal density on both leaf surfaces, although there was a larger effect on the abaxial side than on the adaxial side (Fig. 1B). A lower stomatal index was observed only for the abaxial surface (Fig. 1C). In G. gynandra, the overall density of stomata (calculated by combining the densities of both the adaxial and abaxial surfaces from Fig. 1B) was 65% lower than that of T. hassleriana. This reduction in total stomatal density was similar to the 58% reduction in g s in G. gynandra compared with T. hassleriana. This suggests that the alteration in g s in G. gynandra compared with T. hassleriana is associated primarily with changes in stomatal patterning. The rate of net CO2 assimilation was only slightly higher in G. gynandra compared with T. hassleriana, but the C i was considerably lower in G. gynandra (Fig. 1A, middle). Indeed, as reported commonly in C3/C4 comparisons, the C i-C a ratio was 0.44 ± 0.02 in G. gynandra compared with 0.79 ± 0.01 in T. hassleriana (Fig. 1A, right). These data imply that the stomatal response to intercellular CO2 occurs at different concentrations in the two species.
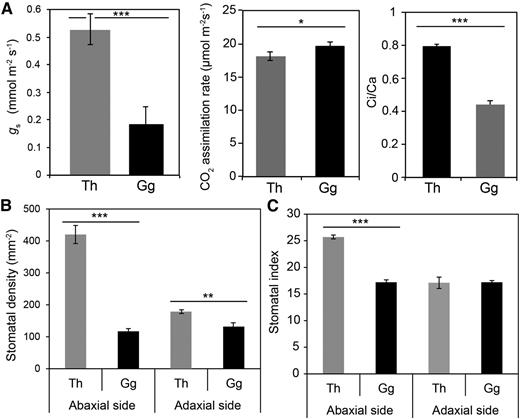
G. gynandra and T. hassleriana show variation in g s and stomatal density. A, Variation in g s (left), CO2 assimilation (middle), and C i-C a ratio (right) between T. hassleriana (Th; gray bars) and G. gynandra (Gg; black bars). B and C, Stomatal density (B) and stomatal index (C) for T. hassleriana (gray bars) and G. gynandra (black bars). Data are shown as means of at least 10 replicates. Asterisks represent statistically significant differences after Student’s t test: ***, P ≤ 0.001; **, P ≤ 0.004; and *, P ≤ 0.05.
GC Transcriptomes from C4 G. gynandra and C3 T. hassleriana
To assess the patterns of transcript abundance associated with these differences between stomata in C3 and C4 plants, using laser-capture microdissection we isolated and then compared transcriptomes from GCs and M of both C3 T. hassleriana and C4 G. gynandra (Fig. 2, A–C). Using deep sequencing, we obtained at least 28 million paired-end reads from triplicate samples of GCs and M cells (Table I and Table S1). After mapping reads to each genome, 22,654 and 24,841 genes were detected in G. gynandra and T. hassleriana, respectively (Table I). After reciprocal best BLAST and conditional annotation that normalizes for differences in transcript length as well as sequence (Aubry et al., 2014), we identified 14,765 genes common to both species, of which 10,681 referred to a unique Arabidopsis gene (Table I). Spearman’s correlation coefficients showed that replicate mRNA profiles from GCs were more similar to themselves than to those from M cells but also that samples were more highly correlated within each species (Supplemental Fig. S2).
![Isolation of GC and M transcriptomes A, Image of a paradermal section of G. gynandra. Bar = 1 mm. The inset shows a closeup of GCs. B and C, GCs (B) and M cells (C) of G. gynandra harvested on caps after laser-capture microdissection. At least 2,500 cells were harvested for each replicate. Samples from GCs (B) are visible as individual foci, as each has to be captured separately, whereas the M cells (C) are clumped, as multiple cells can be captured together. Bars = 1 mm. D and E, Venn diagrams showing the number of genes preferentially expressed in GCs and M cells in G. gynandra and T. hassleriana. F, Cross plot of all genes differentially expressed in either cell type of both species. The top right part represents genes preferentially expressed in GCs of both species; KAT1, SLAC1, and GORK are highlighted in black. G and H, Expression of GC marker genes in GCs (black bars) and M cells (white bars) of G. gynandra (G) and T. hassleriana (H). Values are expressed in normalized counts of transcripts per million (TPM). Asterisks represent statistically significant differences (posterior probability of being differentially expressed [PPDE] ≥ 0.95 [*] or ≥ 0.90 [**] from EBSeq).](https://oup.silverchair-cdn.com/oup/backfile/Content_public/Journal/plphys/170/3/10.1104_pp.15.01203/3/m_plphys_v170_3_1345_f2.jpeg?Expires=1749100439&Signature=DNoJMI9TzRvH5q~JUP0TpHzN1W10xN9JF1-r2EGO-xSj~yedJ-mrntFEu~2XoQqXxFCKtwCmMJQDiFyrjsz6Jq5CLh3QLJt58vz79340H7N6TBdtvcWMR3YNzJnc6-Bduq46T~8vW7Igzv-KOLqCiGcqRqeTqL8sZKHivnIFmrtFGI50fVxdCMBjNSBCFGFl8PaM05BWc~2r3oB5UtWzwpg7bvda9TAL2OM70z1NvTbIq04on2QwNzBPwBo4SgTl4FVPjb~gqS7SebCSwRB6V475tKFKwFnZifONVf~ZakSaAyMybbGC32AyianK4KMXAgkd0X~STgcNo5CoXHnSLQ__&Key-Pair-Id=APKAIE5G5CRDK6RD3PGA)
Isolation of GC and M transcriptomes A, Image of a paradermal section of G. gynandra. Bar = 1 mm. The inset shows a closeup of GCs. B and C, GCs (B) and M cells (C) of G. gynandra harvested on caps after laser-capture microdissection. At least 2,500 cells were harvested for each replicate. Samples from GCs (B) are visible as individual foci, as each has to be captured separately, whereas the M cells (C) are clumped, as multiple cells can be captured together. Bars = 1 mm. D and E, Venn diagrams showing the number of genes preferentially expressed in GCs and M cells in G. gynandra and T. hassleriana. F, Cross plot of all genes differentially expressed in either cell type of both species. The top right part represents genes preferentially expressed in GCs of both species; KAT1, SLAC1, and GORK are highlighted in black. G and H, Expression of GC marker genes in GCs (black bars) and M cells (white bars) of G. gynandra (G) and T. hassleriana (H). Values are expressed in normalized counts of transcripts per million (TPM). Asterisks represent statistically significant differences (posterior probability of being differentially expressed [PPDE] ≥ 0.95 [*] or ≥ 0.90 [**] from EBSeq).
Summary of RNA sequencing metrics used to produce the transcriptome profiles for GCs and M cells from G. gynandra and T. hassleriana
| Sequence Metric | Value | |||
|---|---|---|---|---|
| Read length | 100 bp | |||
| Read type | Single | |||
| Replicates | 3 | |||
| G. gynandra GC | G. gynandra M | T. hassleriana GC | T. hassleriana M | |
| No. of reads | 101,767,206 | 72,294,753 | 134,681,715 | 121,609,573 |
| Average reads per library | 28,276,006 | 42,715,214 | ||
| Detected genes (two or more normalized reads) | 22,654 | 24,841 | ||
| Genes common to both species | 14,765 | |||
| Common and with unique Arabidopsis Genome Initiative identifiers | 10,781 | |||
In G. gynandra, using a posterior probability of being differentially expressed of 0.95 or greater, 4,272 genes were differentially expressed between the GC transcriptome and that of the M (Fig. 2, D and E). A total of 2,271 transcripts were more abundant in the GCs of G. gynandra than in the G. gynandra M (Fig. 2, D and E). In T. hassleriana, 2,827 genes were differentially expressed between GCs and M cells, of which 1,136 were up-regulated in the GCs compared with the M (Fig. 2, D and E). To assess the purity of the GC samples, we analyzed the expression of genes that were reported previously to accumulate preferentially in GCs of Arabidopsis (Leonhardt et al., 2004; Galbiati et al., 2008; Yang et al., 2008; Bates et al., 2012). Several markers, such as the potassium transporter KAT1 (K+ POTASSIUM CHANNEL IN ARABIDOPSIS THALIANA1), GORK (GATED OUTWARD-RECTIFYING K+ CHANNEL), SLAC1 (SLOW ANION CHANNEL-ASSOCIATED1), ALMT12/QUAC1/GCAC1 (ALUMINUM-ACTIVATED MALATE TRANSPORTER/QUICK-ACTIVATING ANION CHANNEL/GUARD CELL ANION CHANNEL1), MYB60 (MYELOBLASTOSIS DOMAIN60), and CYP86a (CYTOCHROME P450 MONOOXYGENASE86a), were enriched in the GC preparations from both species (Fig. 2, F–H). A homolog of the Arabidopsis GUARD CELL1, a known GC marker (Yang et al., 2008), was not detected in G. gynandra (GC or M) but was expressed preferentially in T. hassleriana GC: 258 and 28 TPM in T. hassleriana GC and T. hassleriana mesophyll, respectively. A total of 462 genes were expressed preferentially in GCs in both species (Fig. 2D), while 358 genes were expressed preferentially in the M of both C3 and C4 species (Fig. 2E). Overall, these data provide, to our knowledge, the first quantification of convergence in transcript abundance in GCs from C3 and C4 species.
In each of the two species, the 50 genes that were most differentially expressed in GCs compared with their respective M cells contained known GC markers, such as SLAC1, KAT1, and FAMA for G. gynandra GCs and ALMT12/QUAC1 for T. hassleriana GCs. Genes reported previously to be markers of the epidermis, such as ECERIFERUM3 (CER3), CER6, CER8, and FIDDLEHEAD, were also expressed preferentially in GCs (Supplemental Table S2). Interestingly, there was greater overlap within the 50 most differentially expressed genes between the GCs of the two species (12 genes in common, most of which were involved in lipid metabolism; Supplemental Table S2) than when M profiles were compared (only one gene in common, CELLULOSE SYNTHASE-LIKE GENE3; Supplemental Table S2). This suggests that there is greater divergence in gene expression between M cells of C3 and C4 leaves than between the GCs.
C4 species are commonly associated with high-light conditions in the tropics and semitropics. To investigate the extent to which the expression of GC marker genes changes depending on light conditions in C4 G. gynandra and C3 T. hassleriana, we grew them both in 350 and 700 µmol photons m−2 s−1. Quantitative PCR did not reveal any consistent alteration of transcript abundance in either species depending on the light conditions (Supplemental Fig. S3).
Shared Patterns of Expression in GCs and M Cells of C3 and C4 Species
An analysis of genes commonly expressed in GCs or M cells from both species using Gene Ontology (GO) terms revealed that photosynthesis-related terms (photosystems, chloroplast, and thylakoid) as well as carbohydrate and chlorophyll synthesis categories were overrepresented in the M (Table II; Supplemental Table S3). This is consistent with GCs containing fewer chloroplasts than the M (Vavasseur and Raghavendra, 2005) and thus possessing a relatively lower photosynthetic capacity. Terms involved in channel activities (cations, voltage-gated, and potassium), fatty acid metabolism, response to drought stress, and various hormones, such as jasmonic acid, abscisic acid (ABA), and GA, were overrepresented in GCs (Table II; Supplemental Table S3). The preferential expression of cell wall and fatty acid synthesis in GCs is likely associated with their modified cell walls and requirement for wax deposition on the epidermal cell layer. Of the 10 most enriched GO terms known to be associated with GCs of Arabidopsis, four were also detected in C3 T. hassleriana and C4 G. gynandra. These GO terms consisted of stomatal movement, response to cadmium ions, response to UV-B light, and potassium ion transport (Supplemental Table S3).
Enrichment of GO terms in GCs and M cells of G. gynandra and T. hassleriana
Within each category, the number of genes showing preferential expression in each cell type, as well as the P value and the enrichment factor calculated by AtCOECIS, are presented (Vandepoele et al., 2009).
| GO Category | Enrichment | Adjusted P | No. of Genes |
|---|---|---|---|
| fold | |||
| GC in both species | |||
| Cyclic nucleotide binding | 10.51 | 5.34E-04 | 4 |
| Cation channel activity | 9.83 | 6.94E-04 | 4 |
| Response to UV light | 9.14 | 4.78E-05 | 6 |
| Pectate lyase activity | 8.79 | 4.66E-03 | 3 |
| Carbon-oxygen lyase | 8.79 | 4.66E-03 | 3 |
| Response to UV-B light | 8.79 | 4.66E-03 | 3 |
| Response to cadmium ion | 8.28 | 3.34E-04 | 5 |
| Voltage-gated ion channel activity | 7.62 | 7.00E-03 | 3 |
| Stomatal movement | 7.14 | 8.39E-03 | 3 |
| Response to metal ion | 7.02 | 6.36E-05 | 7 |
| Potassium ion transport | 6.63 | 3.08E-03 | 4 |
| ABA-mediated signaling | 6.57 | 9.81E-04 | 5 |
| M in both species | |||
| Light-harvesting complex | 19.44 | 5.01E-05 | 4 |
| Photosystem | 19.05 | 1.04E-09 | 9 |
| PSII | 18.31 | 8.77E-07 | 6 |
| Sulfur amino acid biosynthesis | 15.75 | 8.86E-04 | 3 |
| Porphyrin biosynthesis | 14.58 | 2.33E-05 | 5 |
| Chlorophyll metabolism | 14.58 | 1.59E-04 | 4 |
| Starch metabolism | 14.58 | 1.11E-03 | 3 |
| Thylakoid lumen | 13.13 | 1.08E-06 | 7 |
Expression of Genes Related to GC Signaling in Leaves of C4 G. gynandra
We next focused our study on signal transduction and metabolic pathways known to be involved in the regulation of stomatal behavior in response to stimuli such as light, CO2, malate, and ABA. Genes encoding photoreceptors known to regulate stomata opening, such as CRYPTOCHROME1/2 and PHOTOTROPIN1/2, were enriched in the M of both species compared with GCs, and there was little difference between the two (Table III). Genes involved in stomatal response to CO2 were investigated in the context of a recent model proposed for CO2 sensing in the GC (Tian et al., 2015). Within this framework, β-CARBONIC ANHYDRASE1 (βCA1) and βCA4 facilitate inorganic carbon supply to RESISTANT TO HIGH CO2 (RHC1), a MULTIANTIMICROBIAL EXTRUSION PROTEIN (MATE)-type transporter that is responsive to bicarbonate and interacts with the protein kinase HIGH LEAF TEMPERATURE1 (HT1; Hashimoto et al., 2006; Hu et al., 2010; Tian et al., 2015). HT1 negatively regulates CO2-induced stomatal closing via the phosphorylation and inactivation of OPEN STOMATA1 (OST1) kinase, which promotes the activation of the SLAC1 anion channel (Negi et al., 2014). βCA1, which likely includes βCA2 (AT5G14740) transcripts that could not be resolved in the Cleome transcriptome, was expressed preferentially in M cells but was still highly expressed in GCs of both T. hassleriana and G. gynandra. Remarkably, βCA4 expression was markedly lower in the C4 species compared with the C3 species (Table III), which is in contrast to data reported previously from an analysis of whole leaves (Bräutigam et al., 2011; Külahoglu et al., 2014). While βCA4 expression was almost equal in GCs and M of T. hassleriana, in G. gynandra it was strongly preferential to the GCs. RHC1 transcripts were more abundant in M cells than GCs of both C3 and C4 plants. HT1 was expressed preferentially in GCs of G. gynandra, whereas in T. hassleriana it showed similar abundance in the two cell types. Both OST1 and SLAC1 were enriched significantly in GCs from both species (Table III). It is important to note here that ALMT12/QUAC1, which is proposed to encode a malate channel contributing to the stomatal response to CO2 (Meyer et al., 2010), also was enriched in GCs from both species.
Expression of genes involved in stomatal aperture signaling in response to light, CO2, malate, and ABA synthesis and signaling
Data are presented as normalized counts, corrected log2 fold change, and the PPDE from EBSeq in G. gynandra (Gg) and T. hassleriana (Th).
| Gene | Arabidopsis Genome Initiative Identifier | Expression (Normalized Counts) | Real Log2 (GC/M) | PPDE | |||||
|---|---|---|---|---|---|---|---|---|---|
| Gg GC | Gg M | Th GC | Th M | Gg | Th | Gg | Th | ||
| Light | |||||||||
| PHOT1 | AT3G45780 | 644 | 922 | 1,060 | 1,487 | −0.52 | −0.49 | 0.59 | 0.01 |
| PHOT2 | AT5G58140 | 1,083 | 1,169 | 1,210 | 1,800 | −0.11 | −0.57 | 0.06 | 0.87 |
| CRY1 | AT4G08920 | 412 | 941 | 506 | 1,135 | −1.18 | −1.16 | 0.99 | 1.00 |
| CRY2 | AT1G04400 | 80 | 92 | 22 | 43 | −0.19 | −0.84 | 0.20 | 0.29 |
| CO2, malate | |||||||||
| CA1 | AT3G01500 | 3,162 | 9,350 | 15,334 | 32,775 | −1.56 | −1.1 | 1.00 | 1.00 |
| CA4 | AT1G70410 | 161 | 8 | 550 | 451 | 3.71 | 0.28 | 1.00 | 0.03 |
| RHC1 | AT4G22790 | 136 | 206 | 27 | 77 | −1.38 | 3.77 | 0.49 | 0.99 |
| HT1 | AT1G62400 | 345 | 3 | 92 | 74 | 5.66 | 0.31 | 1.00 | 0.02 |
| OST1 | AT4G33950 | 193 | 3 | 220 | 33 | 4.78 | 2.57 | 1.00 | 0.89 |
| SLAC1 | AT1G12480 | 1,281 | 4 | 624 | 148 | 7.24 | 2.05 | 1.00 | 0.98 |
| ALMT12 | AT4G17970 | 341 | 5 | 322 | 2 | 5.28 | 5.63 | 1.00 | 1.00 |
| ABA signaling | |||||||||
| CHLH | AT5G13630 | 8,573 | 26,088 | 3,883 | 6,986 | −1.61 | −0.85 | 1.00 | 0.97 |
| MPK9 | AT3G18040 | 107 | 18 | 58 | 26 | 2.31 | 1.04 | 0.90 | 1.00 |
| MPK12 | AT2G46070 | 2,399 | 1,282 | 1,282 | 8 | 0.90 | 4.07 | 0.49 | 1.00 |
| PYL1 | AT5G46790 | 5 | 6 | 32 | 23 | −0.11 | 0.44 | 0.38 | 0.16 |
| PYL2 | AT2G26040 | 65 | 2 | 6 | 2 | 3.46 | 0.76 | 1.00 | 0.15 |
| PYL4 | AT2G38310 | 55 | 9 | 54 | 42 | 2.13 | 0.33 | 1.00 | 0.09 |
| PYL8 | AT5G53160 | 77 | 35 | 55 | 104 | 1.06 | −0.87 | 0.98 | 0.16 |
| PYL9 | AT1G01360 | 41 | 84 | 71 | 47 | −0.98 | 0.53 | 0.35 | 0.56 |
| PYR1 | AT4G17870 | 68 | 40 | 20 | 5 | 0.72 | 1.33 | 0.35 | 0.52 |
| ABI1 | AT4G26080 | 429 | 5 | 298 | 31 | 5.54 | 3.09 | 1.00 | 0.92 |
| Other transporters | |||||||||
| GORK | AT5G37500 | 820 | 297 | 49 | 4 | 1.45 | 2.61 | 0.92 | 0.99 |
| KAT1 | AT5G46240 | 1,460 | 7 | 377 | 85 | 7.09 | 2.10 | 0.96 | 1.00 |
| AHA1 | AT2G18960 | 1,068 | 1,755 | 386 | 653 | −0.71 | −0.75 | 0.82 | 0.09 |
| AHA5 | AT2G24520 | 272 | 11 | 95 | 152 | 4.16 | −0.66 | 0.09 | 1.00 |
| MATE | AT1G33110 | 919 | 324 | 164 | 58 | 1.49 | 1.43 | 0.99 | 0.45 |
| ABCB2 | AT4G25960 | 1,191 | 23 | 61 | 2 | 5.45 | 3.30 | 0.92 | 1.00 |
Transcripts encoding key ABA signaling proteins, such as the 2C protein phosphatase ABSCISIC ACID INSENSITIVE1 (ABI1) that negatively regulates OST1 and represses ABA-induced stomatal closure, were expressed preferentially in GCs of both species (Table III). Other families of genes involved in ABA signaling, such as mitogen-activated protein kinases (MPK9 and MPK12) that positively regulate the interplay between reactive oxygen species and ABA signaling (Jammes et al., 2009), were expressed preferentially in GCs of both species (Table III). Transcripts encoding the ABA receptors PYROBACTIN RESISTANCE LIKE2/4/8, which are known to be up-regulated by ABA, were enriched significantly in G. gynandra GCs compared with M cells (Table III). Transcripts encoding other transporters, such as H+-ATPASE (AHA5), in contrast to AHA1, MATE, and ATP-BINDING CASSETTE B2 (ABCB2), which are commonly enriched in GCs of Arabidopsis, also were enriched significantly in GCs of both C3 T. hassleriana and C4 G gynandra (Table III). It is also notable that transcripts encoding many proteins associated with transport and ABA signaling, such as KAT1, GORK, AHA1, SLAC1, and ABI1, were more abundant in GCs from the C4 leaf compared with C3 GCs.
C4 Cycle Gene Expression in GCs
The C4 pathway is classically associated with the compartmentation of gene expression between M and BS cells, and although a number of enzymes used in C4 photosynthesis are known to accumulate in GCs of C3 species (see the GC transcriptome reported by Wang et al. [2011]), we have limited knowledge of the extent to which C4-related gene expression occurs in GCs from both C3 and C4 leaves. Our data indicate that, in G. gynandra, while most of the core C4 genes were expressed in GCs, their transcripts were more abundant in M cells. This was the case for genes encoding PPC2, PYRUVATE,ORTHOPHOSPHATE DIKINASE (PPDK), ASPARTATE AMINOTRANSFERASE1 (ASP1), BILE ACID:SODIUM SYMPORTER2 (BASS2), and ALANINE AMINOTRANSFERASE1 (ALAAT1; Table IV; Fig. 3, A and B). In addition, the majority of genes encoding enzymes of the Calvin-Benson cycle also were expressed preferentially in M cells (Table IV; Fig. 3C). However, it was also notable that, when absolute levels of expression in GCs were compared between G. gynandra and T. hassleriana, transcripts encoding C4-related enzymes and transporters were up to several hundred times more abundant (and up to 3,000 times for PPDK) in GCs of G. gynandra compared with those cells in T. hassleriana (Fig. 3, D and E).
Expression of genes involved in C4 photosynthesis and the Calvin-Benson cycle in GCs and M cells
| Gene | Arabidopsis Genome Initiative Identifier | Expression (Normalized Counts) | Real Log2 (GC/M) | PPDE | |||||
|---|---|---|---|---|---|---|---|---|---|
| Gg GC | Gg M | Th GC | Th M | Gg | Th | Gg | Th | ||
| C4 cycle | |||||||||
| CA1 | AT3G01500 | 3,162 | 9,350 | 15,334 | 32,775 | −1.56 | −1.1 | 1.00 | 1.00 |
| CA4 | AT1G70410 | 161 | 8 | 550 | 451 | 3.71 | 0.28 | 1.00 | 0.03 |
| PPC2 | AT2G42600 | 4,750 | 22,625 | 1,347 | 1,907 | −2.25 | −0.5 | 1.00 | 0.18 |
| chlpMDH | AT5G56720 | 2 | 2 | 19 | 9 | 0.11 | 0.87 | 0.10 | 0.16 |
| mitoMDH | AT1G53240 | 1,017 | 2,574 | 519 | 570 | −1.34 | −0.13 | 1.00 | 0.06 |
| NADME1 | AT2G13560 | 5,062 | 15,948 | 145 | 29 | −1.65 | 2.17 | 1.00 | 0.51 |
| NADME2 | AT4G00570 | 2,714 | 6,383 | 201 | 179 | −1.23 | 0.17 | 1.00 | 0.04 |
| PEPCKin | AT1G08650 | 24 | 42 | 40 | 35 | −2.02 | 0 | 0.95 | 0.03 |
| BASS2 | AT2G26900 | 3,645 | 15,187 | 199 | 303 | −2.06 | −0.59 | 1.00 | 0.15 |
| ASP1 | AT2G30970 | 3,836 | 20,743 | 76 | 76 | −2.43 | 0 | 1.00 | 0.08 |
| ASP5 | AT4G31990 | 162 | 536 | 76 | 173 | −1.7 | −1.13 | 1.00 | 1.00 |
| ALAAT1 | AT1G17290 | 3,339 | 12,677 | 238 | 324 | −1.92 | −0.44 | 1.00 | 0.79 |
| PPDK | AT4G15530 | 14,837 | 71,729 | 33 | 22 | −2.27 | 0.52 | 1.00 | 0.17 |
| RP1 | AT4G21210 | 2 | 68 | 12 | 32 | −3.48 | −1.19 | 1.00 | 0.17 |
| PPA | AT5G09650 | 1,714 | 4,600 | 217 | 515 | −1.42 | −1.23 | 1.00 | 0.86 |
| UCP5 | AT2G22500 | 681 | 1,542 | 1 | 2 | −1.17 | −0.21 | 1.00 | 0.00 |
| AMK2 | AT5G47840 | 164 | 978 | 88 | 173 | −2.55 | −0.95 | 1.00 | 0.97 |
| ADK | AT5G35170 | 754 | 3,172 | 644 | 775 | −2.07 | −0.27 | 1.00 | 0.02 |
| Calvin-Benson cycle | |||||||||
| GAPA2 | AT1G12900 | 4,602 | 19,102 | 24,479 | 40,757 | −2.05 | −0.74 | 1.00 | 0.98 |
| TPI | AT2G21170 | 736 | 1,807 | 336 | 413 | −1.29 | −0.29 | 1.00 | 0.03 |
| GAPB | AT1G42970 | 5,314 | 23,668 | 6,449 | 9,920 | −2.15 | −0.62 | 1.00 | 0.02 |
| FBA2 | AT4G38970 | 5,469 | 16,023 | 10,679 | 16,998 | −1.55 | −0.67 | 1.00 | 0.01 |
| FBPP | AT3G54050 | 960 | 3,395 | 1,709 | 2,233 | −1.82 | −0.39 | 1.00 | 0.91 |
| RPI | AT3G04790 | 195 | 390 | 229 | 325 | −0.98 | −0.5 | 0.65 | 0.03 |
| PRK | AT1G32060 | 3,348 | 8,126 | 5,947 | 5,124 | −1.28 | 0.21 | 1.00 | 0.96 |
| RPE | AT5G61410 | 1,251 | 2,600 | 1,213 | 2,019 | −1.05 | −0.73 | 0.98 | 0.94 |
| TKS1 | AT3G60750 | 2,966 | 6,399 | 5,767 | 7,769 | −1.11 | −0.43 | 0.34 | 0.01 |
| ALD | AT4G26530 | 327 | 579 | 341 | 397 | −0.81 | −0.22 | 0.57 | 0.02 |
| RCA | AT2G39730 | 7,118 | 18,213 | 56,076 | 70,101 | −1.35 | −0.32 | 1.00 | 0.00 |
| RBCS1b | AT5g38430 | 32 | 43 | 118,165 | 162,707 | −0.36 | −0.46 | 0.28 | 0.00 |
| RBCS1a | AT1G67090 | 10,277 | 26,388 | 155,911 | 154,583 | −1.36 | 0.01 | 1.00 | 0.00 |
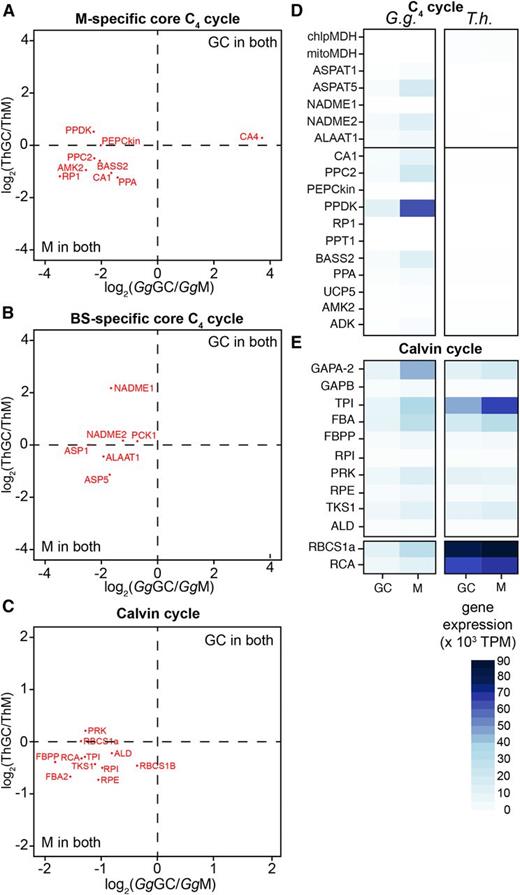
Cell specificity of transcripts encoding proteins involved in the core C4 cycle. A to C, Log2 fold changes are plotted and show the distribution of gene expression in GCs and M cells of G. gynandra (Gg) and T. hassleriana (Th). D and E, Heat maps of the gene expression in GCs and M cells of both species expressed in TPM. chlpMDH, CHLOROPLASTIC MALATE DEHYDROGENASE; mitoMDH, MITOCHONDRIAL MALATE DEHYDROGENASE; NAD-ME, NAD-DEPENDENT MALIC ENZYME; PEPCKin, PHOSPHOENOLPYRUVATE CARBOXYLASE KINASE; RP1, PPDK REGULATORY PROTEIN1; PPT1, PHOSPHOENOLPYRUVATE/PHOSPHATE TRANSLOCATOR1; PPA, PYROPHOSPHORYLASE6; AMK2, AMP KINASE; ADK, ADENYLATE KINASE; GAPA/B, GLYCERALDEHYDE 3-PHOSPHATE DEHYDROGENASE A/B SUBUNIT; TPI, TRIOSE PHOSPHATE ISOMERASE; FBA, FRUCTOSE-BISPHOSPHATE ALDOLASE; FBPP, FRUCTOSE 1,6-BISPHOSPHATE PHOSPHATASE; RPI, RIBOSE PHOSPHATE ISOMERASE; PRK, PHOSPHORIBULOKINASE; RPE, RIBULOSE-5-PHOSPHATE-3-EPIMERASE; TKS1, TRANSKETOLASE; ALD, ALDOLASE; RBCS1A, RIBULOSE BISPHOSPHATE CARBOXYLASE SMALL CHAIN1A; RCA, RUBISCO ACTIVASE.
In contrast, transcripts encoding proteins of the Calvin-Benson cycle and most photosynthesis-related genes showed lower abundance in GCs of C4 G. gynandra compared with C3 T. hassleriana (Fig. 3C; Supplemental Fig. S4). For example, transcripts of RBCS1a, which encodes the small subunit of Rubisco, were detectable in both GCs and M cells of C4 G. gynandra but at much lower levels than in those cells of C3 T. hassleriana (Table IV; Fig. 3C).
Patterns of Transcript Abundance across Photosynthetic Cells of G. gynandra Leaves
We combined the data collected in this study with publicly available data sets (Aubry et al., 2014) generated from plants grown under the same conditions to assess the abundance of transcripts in GCs and M cells but also the BS of the C4 G. gynandra leaf. Genes of the C4 core cycle fell into two categories. One group (module A) associated previously with preferential expression in the BS showed decreasing expression from BS to M to GC (Fig. 4). The second group (module B) showed maximal expression in M cells compared with both GCs and the BS (Fig. 4). Except for TPI, RCA, and GAPA/B, components of the Calvin-Benson cycle were expressed maximally in the BS (Fig. 4). Genes encoding photosystem proteins were consistently higher in M cells of both species but were expressed slightly more in the C3 M (mean of 251 TPM for all photosystem transcripts) than the C4 M (mean of 194 TPM; Supplemental Fig. S5). Furthermore, these genes encoding photosystem components and associated cofactors also populated either module A or B. These data imply at least two distinct mechanisms regulating the cell specificity of gene expression in green cells of a C4 leaf. We propose that module A drives a vein-to-stomata expression pattern while module B drives maximal expression in M cells (Fig. 4, red triangles). Most of the genes expressed preferentially in GCs are associated with module B; therefore, the C4 GC transcriptome is more similar to the C4 M blueprint.
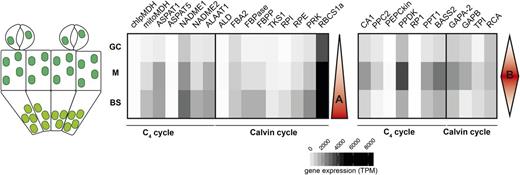
Two patterns of cell-specific expression for genes involved in the C4 and Calvin-Benson cycles in leaves of G. gynandra. Heat maps represent gene expression in each cell type in TPM. The false color code indicates increased expression with darker colors. BS data were obtained from Aubry et al. (2014). Red triangles indicate the two major patterns of expression across the leaf.
DISCUSSION
A Conserved GC Signature from C3 and C4 Plants
The vast majority of molecular work on GCs has been performed with the C3 model Arabidopsis (Leonhardt et al., 2004; Mustroph et al., 2009; Pandey et al., 2010; Wang et al., 2011; Bates et al., 2012). For example, using DNA microarrays, 1,200 transcripts were shown to be expressed preferentially in GCs of Arabidopsis (Bates et al., 2012). However, it is not clear to what extent this current dogma based on Arabidopsis is extendable to other species. Therefore, the data we collected on GC transcriptomes from C3 T. hassleriana and C4 G. gynandra, which both belong to the Cleomaceae, start to provide insight into patterns of gene expression associated with GCs beyond the Brassicaceae. The Cleomaceae family has garnered interest both because it is sister to the Brassicaceae (Cheng et al., 2013) and also because it contains the phylogenetically closest C4 species to Arabidopsis (Brown et al., 2005; Marshall et al., 2007).
Here, we report a microdissection of GCs and M cells to perform comparative analyses of gene expression by deep sequencing. Laser-capture microdissection provides high-quality RNA, and because it is independent of protoplasting, which commonly has been used to isolate GCs, it reduces stress signatures in gene expression. Despite the differences in these techniques used to define transcriptomes of GCs from Arabidopsis and the species studied here, we identified a core, conserved signature of gene expression in all three species. For example, of the 1,200 transcripts that were detected as being preferentially expressed in GCs of Arabidopsis (Bates et al., 2012), 28% were also differentially expressed in GCs of both members of the Cleomaceae. This compares with overlaps of between 16% and 45% in previous studies of Arabidopsis (Yang et al., 2008; Wang et al., 2011; Bates et al., 2012). Overall, these data suggest that the vast majority of genes reported to be associated with GCs in Arabidopsis are not necessarily restricted to expression in this cell type. It is possible, of course, that the variation between species is related to the methods used to isolate RNA from GCs as well as to species-specific effects themselves.
Comparison of the GC transcriptomes from C3 T. hassleriana, C4 G. gynandra, and C3 Arabidopsis revealed 86 out of 145 GO terms that were enriched in all species. This suggests that the GC cellular activities reported previously from Arabidopsis are more predictive than the patterns of expression of individual genes (Supplemental Fig. S4). In particular, we note that gene families involved in ion transport processes and the signaling pathway were enriched in the differentially expressed gene sets in GCs from all species, indicating that processes related to stomata control are conserved.
Under ambient conditions, GCs from C4 leaves maintain lower conductance but also operate at and respond to much lower concentrations of CO2 within the leaf, so understanding patterns of gene expression in GCs from closely related leaves may help us understand the molecular basis of these responses. In this context, it is notable that, compared with M cells, genes encoding organic acid transporters such as SLAC1, ALMT12/QUAC1, and the CO2-sensing signaling cascade βCA-RCH1-HT1-OST1, which controls SLAC1 in GCs (Tian et al., 2015), were up-regulated in GCs from C3 and C4 leaves. It is also notable that, whereas the expression of OST1, which acts as a crossroad between CO2 and ABA signaling, was stable between the GC of C3 and C4 species, transcripts derived from RHC1, HT1, and SLAC1 were at least 2-fold more abundant in GCs of the C4 leaf (Table III). Furthermore, transcripts encoding some proteins associated with transport and ABA signaling also were more abundant in GCs from the C4 leaf. Together, these alterations in transcript abundance may allow tighter control of the GC response to the CO2 signal in C4 compared with C3 leaves. In addition, as CAs have been proposed to act as positive regulators of the CO2 response in GCs (Hu et al., 2010), it is possible that up-regulation of βCA4 in GCs from C4 G. gynandra (compared with the M) contributes to the more efficient C4 stomatal response to CO2. Further work will be needed to clarify the involvement of the various isoforms of CA that are located in different subcellular compartments (Fabre et al., 2007; Kajala et al., 2012).
Expression of C4 Cycle Genes in GCs from C3 and C4 Species
Although a number of studies have assessed global patterns of gene expression in whole leaves from closely related C3 and C4 species (Bräutigam et al., 2011; Gowik et al., 2011; Aubry et al., 2014; Külahoglu et al., 2014) and transcriptomes from BS and M cells of C4 leaves have been reported (Li et al., 2010b; Chang et al., 2012; Aubry et al., 2014), to our knowledge, little is known about the patterns of gene expression in GCs from C4 leaves. This is despite the fact that genes up-regulated in C4 leaves (Hibberd and Covshoff, 2010; Aubry et al., 2011) are known to carry out important functions in GCs from C3 species.
Through a comparison of GC transcriptomes from C3 T. hassleriana and C4 G. gynandra, we show that, while genes from the C3 species T. hassleriana that are orthologous to those used in C4 photosynthesis are expressed in GCs of this species, the absolute levels of transcript abundance were low, and in fact, almost all of these transcripts were more abundant in M cells than in GCs. An exception to this was βCA4. Therefore, these data do not support the notion that components of the C4 pathway are generally up-regulated in GCs of C3 species (Cockburn 1983; Vavasseur and Raghavendra, 2005; Lawson et al., 2014).
Consistent with previous studies, our data indicate that transcripts derived from genes associated with the core C4 pathway are more abundant in M cells of C4 G. gynandra than those of C3 T. hassleriana. However, strikingly, these genes were also up-regulated in GCs of C4 G. gynandra compared with C3 T. hassleriana. The increased expression of core C4 cycle genes in GCs may be associated with the regulation of stomatal aperture. Organic acids are proposed to regulate stomatal opening (Araújo et al., 2011). Additional work will need to be performed to investigate this, as differences in transcript abundance do not necessarily impact the activity of the proteins, and many of these proteins are known to be regulated by posttranslational modifications (Chollet et al., 1996; Chastain et al., 2002). Notably, the abundance of RBCS1a and RBCS1b transcripts, encoding the small subunit of Rubisco, as well as those of RCA1, encoding Rubisco activase, were lower in GCs as well as M cells of C4 G. gynandra compared with C3 T. hassleriana (Fig. 3E). These data, combined with the up-regulation of core C4 cycle genes in the GC of G. gynandra, imply that a limited single-cell-based C4 pathway operates in this cell type. It also appears that, for pathways related to carbon metabolism, the transcriptome of the C4 GC is closer to that of the C4 M than GCs from C3 species. Irrespective of the exact role of C4 cycle components in GCs, the up-regulation of genes encoding these proteins in both M and GCs from C4 compared with C3 leaves argues for a non-cell-autonomous mechanism for the up-regulation of these genes across the leaf.
Two Patterns of C4 Gene Expression within C4 Leaves
The compartmentation of gene expression between M and BS cells of C4 plants has long been considered a hallmark of the efficient C4 pathway (Hibberd and Covshoff, 2010). Through comparison of the GC and M transcriptomes compiled in this study with those from publicly available data sets from the BS of G. gynandra, however, it is clear that the situation is more complicated. We observed two basic patterns of gene expression associated with these three cell types in C4 leaves. One was characterized by highest transcript abundance in M cells, and we named it pattern B (Fig. 4). In contrast, pattern A was defined by increasing transcript abundance from GC to M and then to BS (Fig. 4). Pattern A included most of the Gly decarboxylase subunits, considered early markers of C4 evolution (Heckmann et al., 2013; Williams et al., 2013). The mechanisms underlying these contrasting patterns of expression are not known. Photosynthesis gene expression and chloroplast development are known to be controlled by GOLDEN-LIKE (GLK) transcription factors in both C3 and C4 species (Rossini et al., 2001; Waters et al., 2008, 2009; Wang et al., 2013), although they are thought to act in a cell-autonomous manner. One attractive hypothesis to explain these various findings is that pattern B is initiated by a signal that diffuses out of M cells, while pattern A is initiated by a diffusible signal from veins. In both cases, the patterns of gene expression could then be maintained by cell-autonomous mechanisms such as those mediated by GLK. Pattern A is rather similar to the model predicted to generate Kranz anatomy of C4 leaves (Langdale et al., 1991; Wang et al., 2013; Fouracre et al., 2014).
CONCLUSION
Our data provide new insight into the extent to which transcripts of genes identified previously with GCs from Arabidopsis are also associated with GCs from species outside of the Brassicaceae. There was very little difference between GO terms associated with GC in the C3 and C4 leaves. We also report that the majority of genes highly expressed in M cells of C4 species were also up-regulated in GCs. Whether this leads to a single-cell-type C4 cycle in GCs of C4 species remains to be discovered. Lastly, it appears that C4 genes are subject to two broad regulatory systems, one in which expression is maximal in M cells and the other in which expression decreases gradually as cells are farther from the vein. These broad behaviors may facilitate the identification of the gene regulatory networks underlying C4 photosynthesis and, therefore, long-term research programs that aim to engineer C4 traits into C3 crops to increase yield (Hibberd et al., 2008; Sage and Zhu, 2011).
MATERIALS AND METHODS
Plant Material
Plants for gas-exchange experiments and stomatal density estimation were grown on a 1:1 soil and vermiculite mixture in a naturally illuminated greenhouse. Measurements were performed on the youngest fully mature leaves of 4-week-old C3 Tareneya hassleriana and C4 Gynandropsis gynandra plants. For laser-capture microdissection, plants were grown on a 1:1 soil and vermiculite mixture in a controlled environment room set to provide 350 µmol photons m−2 s−1 over a 16-h photoperiod, with a temperature of 22°C and 65% relative humidity. Leaf tissue from mature leaves was harvested 4 h after dawn (maximum stomatal opening) and immediately infiltrated into cold ethanol:acetic acid (3:1, v/v) for laser-capture microdissection sample preparation. To compare the transcript abundance of marker genes from plants growth at 350 and 750 µmol photons m−2 s−1, plants were grown on a 1:1 soil and vermiculite mixture in a controlled environment room with a 16-h photoperiod, temperature of 22°C, and 65% relative humidity.
Leaf Gas-Exchange Measurements and Stomatal Measurements
The g s for water vapor, net CO2 assimilation rate, and C i (μmol mol–1) were monitored using a LI-COR 6400 gas analyzer system (LI-COR) equipped with a clamp-on leaf cuvette (6400-40 Leaf Chamber Fluorometer; LI-COR). Measurements were performed on individual leaves attached to the plants after at least 30 min of acclimation in the leaf cuvette. A 10% blue and 90% red illumination was set to provide 500 μmol m−2 s−1 irradiance using the light-emitting diode array of the top-side cuvette. Leaf chamber temperature was controlled at 22.5°C, and leaf-to-air vapor pressure deficit was maintained between 0.45 and 0.75 kPa. The atmospheric CO2 mixing ratio in the cuvette was controlled around 360 μL L–1. Gas-exchange parameters were calculated according to von Caemmerer and Farquhar (1981). For water vapor porometry data shown in Supplemental Figure S1, g s was measured on the abaxial side of the leaf using an AP4 porometer (Delta-T Devices). Data are presented as means ± se, and P values were calculated using Student’s t test (two-tailed distribution and two-sample equal variance).
To calculate stomatal index and density, 10 leaves of each species were analyzed using a DM6000B microscope (Leica Microsystems). The epidermal cell layer from both sides of the leaf was prepared using Time Tape (Flinn Scientific) and transparent Scotch tape. Time Tape was used to fix one surface of the leaf, while Scotch tape was used to detach epidermis from the abaxial or adaxial side. Prepared peels were submerged in MES/KCl buffer, pH 6.15, for further analysis. Stomata were counted on two areas of 0.081 mm2 on each leaf for both sides in order to determine stomatal density. Stomatal index was defined as 100% multiplied by the number of stomata divided by the total number of cells in each area. Data are presented as means ± se, and P values were calculated using Student’s t test (two-tailed distribution and two-sample equal variance).
Laser-Capture Microdissection and RNA Sequencing
Cell-specific RNA isolation was achieved using laser-capture microdissection of each cell type from fixed paradermal sections (Aubry et al., 2014). The tissue was first processed through a dehydration series and then placed in Paraplast Xtra (Sigma). Eight-micrometer-thick paradermal sections were generated from the embedded leaves and floated on ice-cold ethanol on MembraneSlide 1.0 PEN (Zeiss) to dry. Prior to laser-capture microdissection, slides were deparaffinized using Histo-clear for 2 min and air dried. Laser-capture microdissection was then performed using an Arcturus XT instrument (Life Technologies), and at least 2,500 M cells and GCs per replicate were captured using adhesive caps (Life Technologies) following the manufacturer’s instructions. Subsequently, RNA was purified using the Picopure RNA Extraction Kit (Life Technologies), subjected to on-column DNase treatment (Qiagen), and amplified using the Nugen RNA Ovation V2 kit. RNA quality and quantity were checked at every stage using a picoRNA chip on Bioanalyzer 2100 (Agilent). Amplified complementary DNA libraries were generated using the Illumina standard protocol and then multiplexed on a HiSeq machine to generate 4 Gb of 100-bp paired-end reads for each library. Triplicate libraries were generated for each cell type.
Quantification of Cell-Specific Transcriptomes and GO Analysis
All read data sets were subjected to the same quality-based trimming prior to quantification using RSEM. Using Trimmomatic version 0.32, reads were first subjected to adapter trimming and removal of low-quality bases in leading, trailing, and sliding window (4-bp) modes (Lohse et al., 2012). Reads shorter than 60 bp after trimming were discarded, and those remaining were aligned to the protein-coding transcripts from genome sequences of G. gynandra and T. hassleriana (Cheng et al., 2013) using Bowtie version 1.0.1 (Langmead et al., 2009). The expression of genes and transcripts was quantified using RSEM version 1.2.7 (Li and Dewey, 2011). All possible pairwise comparisons between replicated samples were performed using EBSeq (Leng et al., 2013), and differentially expressed genes were identified as those genes with a posterior probability of being differentially expressed of at least of 0.95. Reads originating from G. gynandra BS, GC, and M were merged from this study and publicly available data (Aubry et al., 2014) and subsequently subjected to the same pipeline for normalization (TPM; Li et al., 2010a). GO analysis was performed using the AtCOECIS tool (Vandepoele et al., 2009) and sorted by descending enrichment scores (Table II; Supplemental Table S3). To conduct quantitative PCR, RNA representing each biological replicate was extracted (Plant RNeasy Kit; Qiagen) from at least 100 mg of leaf material derived from at least three plants that had been grown at either 350 or 750 µmol photons m−2 s−1. First-strand complementary DNA synthesis from 0.5 µg of RNA was performed using SuperScript II (Invitrogen) prior to quantitative real-time PCR using SYBRgreen Jumpstart (Sigma) in a rotor-gene-Q system (Qiagen). Gene-specific primers were designed for five genes: GgACT7 (forward, 5′-CTCATCGGTGGAGAAGAACTATG-3′; reverse, 5′-CGGGTGCTTCCATTCCTATC-3′), GgKAT1 (forward, 5′-GCAATCGCTGGAGATGTATTTG-3′; reverse, 5′-GAGATGTTCTGCTCACCCTTAG-3′;), GgHT1 (forward, 5′-GCCGGAGATGATCAAAGAGAA-3′; reverse, 5′-GCCTTGGAATGGAAGCAAAG-3′), GgSLAC1 (forward, 5′-TCTATGGGCAGTCGGATTTG-3′; reverse, 5′-TATACAGGGTGAAGCTCCTTTG-3′), GgOST1 (forward, 5′-CCCGACTACGTTCACATATCTC-3′; reverse, 5′-CCACTCGTGGTTCCTTATCTC-3′), ThACT7 (forward, 5′-CGCAGACCGTATGAGTAAAGAG-3′; reverse, 5′-CACCGATCCAGACACTGTATTT-3′), ThKAT1(forward, 5′-ATGCCAACGGCCAAGATTACCAAC-3′; reverse, 5′-TGTTGATCCCATTCCTGGGAACCT-3′), ThHT1 (forward, 5′-GGCGTTAGCCCAACTGATAA-3′; reverse, 5′-TTCACGCACTCGTCGTATTT-3′), ThSLAC1(forward, 5′-CTTCACCGGGTTTAGGTTCTC-3′; reverse, 5′-CCAGGTACTTGCTCTGCATATT-3′), and ThOST1(forward, 5′-GGACTCAGTGTCTGAACCAATAC-3′; reverse, 5′-GCTGCTGTCGATGTCAAGAT-3′). Relative expression was normalized for each species to ACTIN7 (ACT7). For each gene, three technical and three biological replicates were carried out.
RNA sequencing data produced in this study were submitted to the ArrayExpress database under accession number E-MTAB-3379.
Supplemental Data
The following supplemental materials are available.
Supplemental Figure S1. Diurnal variation in gs in G. gynandra and T. hassleriana.
Supplemental Figure S2. Spearman's ranked correlation coefficients for sample comparisons of global mRNA abundance estimates.
Supplemental Figure S3. Transcript abundance of marker genes involved in guard-cell response.
Supplemental Figure S4. Heatmap representing transcript abundance from genes important for photorespiration and photosynthesis.
Supplemental Figure S5. Venn diagram summarising GO terms that were significantly enriched in guard cells.
Supplemental Table S1. List of genes expressed in G. gynandra and T. hassleriana GCs and M cells.
Supplemental Table S2. The 50 most abundant transcripts in GCs or M cells of G. gynandra and T. hassleriana leaves.
Supplemental Table S3. Gene Ontology terms for genes that were preferentially expressed in GCs or M cells.
ACKNOWLEDGMENTS
We thank Eric Schranz (Wageningen University), Andreas Weber (Heinrich Heine University), and Xinguang Zhu (PICB, Shanghai) for access to the G. gynandra genome sequence and the TGAC sequencing facility for performing the RNA sequencing.
Glossary
- M
mesophyll
- BS
bundle sheath
- gs
stomatal conductance
- Ci
intercellular CO2 concentration
- Ca
atmospheric CO2 concentration
- GC
guard cell
- TPM
transcripts per million
- GO
Gene Ontology
- ABA
abscisic acid
LITERATURE CITED
Author notes
This work was supported by the European Union FP7 3to4 project, the European Union FP7 Marie Curie ITN HARVEST project (fellowship to O.A.), a Marie Curie fellowship (grant no. PIEF–GA–2009–253189), and a European Union Plant Fellow fellowship (to S.A.).
These authors contributed equally to the article.
Present address: Institute for Plant Biology, University of Zürich, Zollikerstrasse 107, 8008 Zurich, Switzerland.
Address correspondence to [email protected] and [email protected].
The author responsible for distribution of materials integral to the findings presented in this article in accordance with the policy described in the Instructions for Authors (www.plantphysiol.org) is: Bernard Genty ([email protected]).
S.A., O.A., I.R.-L. performed the experiments. S.A., O.A., I.R.-L., R.S.-U. and B.G. carried out the data analysis. S.A., J.M.H. and B.G. designed the study and wrote the article.
Articles can be viewed without a subscription.
