


Abstract
DEFECTIVE KERNEL1 (DEK1) of higher plants plays an essential role in position-dependent signaling and consists of a large transmembrane domain (MEM) linked to a protease catalytic domain and a regulatory domain. Here, we show that the postulated sensory Loop of the MEM domain plays an important role in the developmental regulation of DEK1 activity in the moss Physcomitrella patens. Compared with P. patens lacking DEK1 (∆dek1), the dek1∆loop mutant correctly positions the division plane in the bud apical cell. In contrast with an early developmental arrest of ∆dek1 buds, dek1∆loop develops aberrant gametophores lacking expanded phyllids resulting from misregulation of mitotic activity. In contrast with the highly conserved sequence of the protease catalytic domain, the Loop is highly variable in land plants. Functionally, the sequence from Marchantia polymorpha fully complements the dek1∆loop phenotype, whereas sequences from maize (Zea mays) and Arabidopsis (Arabidopsis thaliana) give phenotypes with retarded growth and affected phyllid development. Bioinformatic analysis identifies MEM as a member of the Major Facilitator Superfamily, membrane transporters reacting to stimuli from the external environment. Transcriptome analysis comparing wild-type and ∆dek1 tissues identifies an effect on two groups of transcripts connected to dek1 mutant phenotypes: transcripts related to cell wall remodeling and regulation of the AINTEGUMENTA, PLETHORA, and BABY BOOM2 (APB2) and APB3 transcription factors known to regulate bud initiation. Finally, sequence data support the hypothesis that the advanced charophyte algae that evolved into ancestral land plants lost cytosolic calpains, retaining DEK1 as the sole calpain in the evolving land plant lineage.
A novel principle introduced in body patterning of early land plants, evolving from green algae related to charophytes 450 to 470 million years ago, was the ability to control growth in three dimensions (Graham et al., 2000; Pires and Dolan, 2012). The earliest multicellular forms of charophytes resembled Klebsormidiales, which form unbranched filaments with cells dividing by centripetal furrowing. Later, within Charales, Coleochaetales, and Zygnematales, cell plate expansion was facilitated by the phragmoplast (Leliaert et al., 2012). The ability to orient cell division in two cutting faces contributed to the formation of branched filaments and a more complex stem-like or discoid thallus. Finally, three-dimensional (3D) body patterning evolved within the early diverging land plants represented by bryophytes, displaying apical meristematic cells capable of dividing in three or more cutting faces (Graham et al., 2000). Subsequent evolution of multicellular apical meristems facilitated an increased morphological complexity in seed plants. Precise determination of the division plane became critical for asymmetric cell divisions that drive plant morphogenesis (De Smet and Beeckman, 2011). An asymmetric cell division is tightly linked to differential cell fate establishment and several molecular players have been identified that play a role in these processes in land plants. These include transcription factors (e.g. the WUSCHEL-RELATED HOMEOBOX protein family, Arabidopsis thaliana MERISTEM LAYER1, PROTODERMAL FACTOR2, and the GIBBERELLIC-ACID INSENSITIVE, REPRESSOR of GAI and SCARECROW (GRAS) family; for review, see Lau et al., 2012), microtubule-associated proteins (e.g. TANGLED1, CLIP-ASSOCIATED PROTEIN, and MICROTUBULE-ASSOCIATED PROTEIN65; for review, see Müller et al., 2009), protein phosphatases (e.g. the PROTEIN PHOSPHATASE 2A complex; Spinner et al., 2013), protein kinases (e.g. CLAVATA1 and CRINKLY4), proteins involved in vesicular trafficking and hormonal signaling (e.g. guanine nucleotide exchange factors and PIN-FORMED carriers), and others (for review, see De Smet et al., 2009; De Smet and Beeckman, 2011). In all current models for the regulation of plant body patterning facilitated by coordinated cell divisions, an upstream-acting mechanism that detects, interprets, and transmits positional information (external, mechanical, and intrinsic) triggering the downstream events remains unknown.
We previously proposed DEFECTIVE KERNEL1 (DEK1) as a candidate protein for sensing and signaling surface cell position in land plants based on its predicted structure as well as genetic and evolutionary data (Tian et al., 2007; Liang et al., 2013). DEK1 consists of a multi-spanning (21) transmembrane domain, DEK1 MEM, interrupted by a suggested sensor-DEK1 Loop (Loop) and a C-terminal calpain protease domain (CysPc) and a regulatory domain (C2L) connected to MEM by the DEK1 Arm (Arm) segment (Lid et al., 2002). Depending on the computer algorithms used, the Loop is predicted to be extracellular (Lid et al., 2002) or cytosolic (Kumar et al., 2010). Neither the 3D structure of DEK1, nor the specific function of MEM or Arm is known. The emerging model for DEK1 function holds that the CysPc-C2L domain, encoding a calpain-like Cys proteinase, is released from its inhibitory state by activation of MEM, resulting in autocatalytic cleavage of CysPc-C2L mediated by Arm (Tian et al., 2007; Johnson et al., 2008). Confirmation of CysPc-C2L as the effector molecule came from the observation that the dek1 mutant phenotypes of Arabidopsis (Arabidopsis thaliana) and Physcomitrella patens can be fully complemented by expression of the CysPc-C2L domain alone (Johnson et al., 2008; Perroud et al., 2014) if certain conditions are met. These conditions include expression under a promoter with sufficiently high activity during early embryogenesis and a ubiquitous pattern of expression throughout the development, as RIBOSOMAL PROTEIN S5A promoter (pRPS5A) (Johnson et al., 2008). In addition, when pRPS5A is used to express CysPc-C2L, there appears to be a narrow window of transgene expression for full complementation to occur (Johnson et al., 2008). Deviation from these conditions (e.g. expression under the control of the 35S promoter in Arabidopsis or overexpression of the CysPc-C2L under the control of pRPS5A) introduces a range of phenotypes affecting organ development globally (Lid et al., 2005; Johnson et al., 2008). In the P. patens Ɗdek1 mutant complemented with the CysPc-C2L driven by the native DEK1 promoter or with full-length DEK1 complementary DNA (cDNA) driven by the 2x35S promoter, phenotypes ranging from wild type-like to stunted plants develop (Perroud et al., 2014). These observations all point to an important role for MEM and Arm in the proper regulation of CysPc-C2L activity during plant development. This conclusion is further supported by the observation that overexpression of MEM in Arabidopsis causes a dominant negative phenotype, mimicking the phenotypes of 35S-DEK1 RNA interference lines (Tian et al., 2007).
Requirement of DEK1 for surface position-dependent aleurone cell fate specification and maintenance as well as normal embryogenesis was shown in maize (Zea mays; Lid et al., 2002). The involvement of DEK1 in the 3D body plan transition of early land plants is further supported by the phenotype of the DEK1 deletion mutant in P. patens (Perroud et al., 2014). In this mutant, the development of protonemata, filamentous cells growing by polar tip growth, is not affected, whereas the transition to the 3D growth of the gametophore is severely affected in its ability to reorient the division plane in the bud apical cell perpendicularly to the first asymmetric division of the bud initial (Perroud et al., 2014). This phenotype is highly reminiscent of the dek1 embryo phenotype of Arabidopsis, in which the first asymmetric division of the zygote, similarly to P. patens bud initial, gives rise to the cytoplasm-rich apical cell and a vacuolated basal cell. After the correct zygote division, subsequent cell divisions fail to occur in the oriented manner specified in wild-type embryos and the protoderm (the outermost cell layer of the globular embryo) consequently fails to develop (Johnson et al., 2005; Lid et al., 2005). We interpret these data to suggest that the basic function of DEK1 in cell division plane orientation is conserved between mosses, one of the earliest diverging lineages of land plants, and angiosperms.
DEK1 is a member of one of four ancestral calpain variants that were established in the early evolution of eukaryotes in which the CysPc-C2L domains are attached to multispanning transmembrane anchors (TML calpains; Zhao et al., 2012). The other ancient calpains consisted either of CysPc alone or CysPc attached to other domains (Zhao et al., 2012). Among modern calpains, the so-called classical calpains in humans are the most intensively studied, with the domain structure composed of N-terminal anchor helix, CysPc-C2L domains, and penta-EF-hand domain (Ono and Sorimachi, 2012). Our working hypothesis is that DEK1 assumed a unique role in positional signaling during land plant evolution, contributing to the ability of land plants to develop 3D organs. This hypothesis is supported by several lines of circumstantial evidence, including the highly conserved sequence and function of DEK1 in land plants, forming a separate clade among the land plants (Zhao et al., 2012; Liang et al., 2013). We recently showed that the CysPc-C2L calpain moiety of DEK1 from the moss P. patens is capable of complementing the Arabidopsis dek1-3 mutant (Liang et al., 2013), representing a functional conservation that spans about 450 million years of evolutionary time (Kenrick and Crane, 1997). By contrast, the CysPc-C2L domains of the unicellular alga Mesostigma viride, the earliest diverging lineage of charophyte algae, do not complement the Arabidopsis dek1 mutant (Liang et al., 2013). Importantly, the appearance of the DEK1-clade during land plant evolution coincides with the establishment of the 3D growth habit of land plants, whereas members of the chlorophytes that display unicellular or planar body plans lost TML calpains, but retained multiple cytosolic calpains (Zhao et al., 2012; Liang et al., 2013). The exact point in time during charophyte evolution when only DEK1-calpains were retained is unknown.
In this article, we continue to explore the separate DEK1 domains, focusing on the Loop region. First, using homologous recombination, we create a P. patens Loop deletion mutant, dek1Ɗloop. On the basis of phylogenetic analysis of Loop sequences from Charophyta and land plant species, we use Loop coding regions from Marchantia polymorpha, maize, and Arabidopsis to complement the dek1Ɗloop mutant in P. patens in order to study the functional conservation of Loop sequences from land plants. Bioinformatics analysis is used to re-examine the structure of DEK1 MEM in order to identify homologous proteins or protein domains that help elucidate the MEM function. Next, in order to develop a better understanding of the global role of DEK1, we use RNA sequencing (RNA-Seq) differential expression analysis to study the effect of DEK1 on the transcriptome of P. patens by comparing wild-type and Ɗdek1 protonemata before and after bud initiation. Finally, we use novel data to identify the last charophycean species of green algae that possessed multiple calpain forms before retention of DEK1 as the single calpain of land plants.
RESULTS
The DEK1 Loop of Land Plants Is Highly Divergent from Its Algae Counterparts
The transmembrane domain of PpDEK1 is interrupted by an approximately 300-amino acid residue Loop segment located between the ninth and tenth transmembrane segments (TMSs; Fig. 1A; Supplemental Fig. S1A). To analyze the degree of sequence conservation, we aligned the Loop sequence of 60 DEK1 proteins, including the sequences from three charophyte algae species (Supplemental Table S1). This analysis revealed that the algae Loop sequences are highly divergent from each other and from the corresponding land plant sequences, preventing meaningful alignments (data not shown). To further investigate whether any local similarity in the Loop exists, we carried out pairwise comparisons between the different algae and P. patens Loop sequences using the exact Smith-Waterman algorithm (EMBOSS Water). Only the N-terminal end of the charophyte algae Loop sequences align with significant expect (E) values to the P. patens Loop, but with low similarity scores (<20%; data not shown).
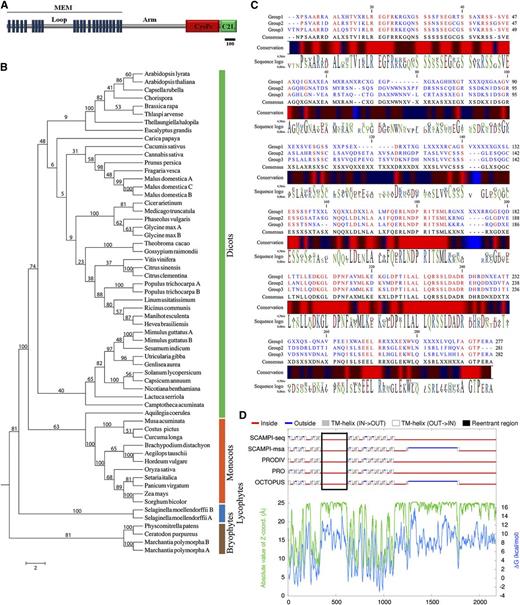
Land plant Loop phylogeny and structure. Bioinformatic analyses of land plant Loop sequences. A, Diagram of the predicted DEK1 structure. Bar represents the length of 100 amino acids. B, Phylogenetic analysis of land plant Loop sequences. The Loop sequences cluster in four major phylogenetic groups corresponding to bryophytes, lycophytes, monocots, and dicots. C, Alignments between the bryophyte and lycophyte (group 1), monocot (group 2), and dicot (group 3) Loop consensus sequences showing the absolutely conserved positions and the degree of sequence conservation (red = 100% conserved positions/regions) using CLC Genomic Workbench to visualize the result. D, Consensus prediction of P. patens DEK1 membrane protein topology suggests the Loop (black lined box) to be localized at the cytoplasmic side of the plasma membrane. The topologies are predicted by the individual TOPCONS methods (SCAMPI-seq, SCAMPI-msa, PRODIV, PRO, and OCTOPUS), predicted Z-coordinates, and predicted Gibbs free energy values across the sequence. TM, Transmembrane.
Next, we investigated the phylogenetic relationship among land plant Loop sequences. This analysis grouped the sequences into the major clusters corresponding to bryophytes, lycophytes, monocots, and dicots (Fig. 1B). A pairwise sequence comparison of the Loop sequences shows that the amino acid identity decreases with evolutionary distance, with the sequence identity between Arabidopsis and P. patens being 38% (Supplemental Fig. S1B). As portrayed by the sequence logo representation of the alignment (Supplemental Fig. S1C), the N- and C-terminal ends of the Loop are highly conserved with a more divergent middle part. In the conserved regions, blocks of conserved amino acids, single amino acid positions with conservative substitutions within the Loop, are identified. Using the consensus sequences from each group alignment, we performed an alignment identifying the fully conserved positions in the Loop sequences (Fig. 1C).
The DEK1 MEM Shows Homology to the Major Facilitator Superfamily of Membrane Transporters
Despite the fact that DEK1 was discovered more than a decade ago, similarity of the MEM domain to proteins in existing databases that could hint to a function has remained elusive. In addition, computer modeling of MEM has given inconsistent results both with respect to the number of TMSs (21 versus 23) and the position of the Loop (intracellular versus extracellular; Lid et al., 2002; Kumar et al., 2010). Here, we present a reanalysis of MEM from Arabidopsis, maize, and P. patens using TMHMM (Krogh et al., 2001), SPOCTOPUS (Viklund et al., 2008), TOPCONS (Bernsel et al., 2009), PHOBIUS (Käll et al., 2004), and HMMTOP (Tusnády and Simon, 1998). This analysis consistently locates the Loop intracellularly in all species (Fig. 1D) and predicts 23 TMSs located N terminally to the predicted Arm segment (Supplemental Fig. S1A). Furthermore, the MEM topography of charophyte algae, as represented by Klebsormidium flaccidum (Klebsormidiales), Nitella mirabilis (Charales), and Mougeotia scalaris (Zygnematales), is highly similar to land plants, showing overall structural conservation of MEM in Streptophyta, representing an evolutionary time of approximately 1000 million years (Zimmer et al., 2007; Pires and Dolan, 2012; Supplemental Fig. S1A). New homology searches in recent protein databases also detect similarity between the Major Facilitator Superfamily (MFS) domain of secondary transporters (cd:06174) and TMSs 16 to 22 of DEK1-MEM (Supplemental Fig. S2). MFS proteins includes uniporters, symporters, and antiporters and are a large and diverse group of proteins facilitating transport of various solutes across the membranes in response to chemiosmotic gradients, including ions, sugars, phosphates, drugs, neurotransmitters, nucleosides, amino acids, and peptides (for review, see Yan, 2013).
Deletion of the DEK1 Loop Severely Affects P. patens Gametophore Body Patterning
Our strategy for assessing the function of the Loop in P. patens is first to utilize homologous recombination to create a Loop deletion mutant (dek1Ɗloop) and then retarget Loop-coding sequences from representatives of the bryophytes, monocots, and dicots grouped in the phylogenetic studies above (Fig. 1B). To create the dek1Ɗloop mutant, we first transformed P. patens protoplasts using the pBluescript Hygromycin B phosphotransferase Resistance Forward vector (pBHRF)-DEK1-ƊLoop construct (Supplemental Fig. S3A). Of the 65 stable transformants, 47 displayed the ∆dek1 phenotype lacking gametophores as described in Perroud et al. (2014). The PCR genotyping of the dek1Ɗloop locus was performed in two steps. First, we assessed the loss of the Loop open reading frame by attempting to PCR amplify a sequence targeted for removal using the primer pair Ɗloop fra-fw and Ɗloop fra-rv (Supplemental Table S2 shows the primer sequence). Twenty-one transformants lacked wild-type bands and were further analyzed. Second, we PCR amplified the targeted locus using the primer pair Ɗloop diag fw and Ɗloop diag rv designed outside the genomic fragment used to build the pBHRF-DEK1-ƊLoop vector to select single insertion events. Four transformants showed a signal corresponding to a single replacement event. All of these events displayed the ∆dek1 phenotype lacking gametophores (Perroud et al., 2014; Supplemental Fig. S4, A and B)., An insertion of a resistance marker in an intron may potentially cause a null mutant phenotype by interfering with posttranscriptional modifications of the transcript, thus preventing expression of an active protein. To test this, we generated transformants showing loss of hygromycin resistance using the Cre recombinase approach (Trouiller et al., 2006). Interestingly, the resistance marker-free mutants we obtained displayed a distinct phenotype, different from the wild type or previously described ∆dek1, carrying gametophores with altered morphology (Supplemental Fig. S4C shows the line designated dek1Ɗloop selected for further description). The new locus was cloned and sequenced, confirming loss of the resistance marker and Southern-blot analysis confirmed that the Loop was eliminated from the genome (Supplemental Fig. S5, A and B). To confirm proper splicing of the DEK1 transcript in dek1Ɗloop line, the cDNA region overlapping the deleted Loop-coding sequence was amplified in reverse transcription (RT) reaction and sequenced using the forward (F) and reverse (R) primers RT -Loop-F and RT-Loop-R (Supplemental Fig. S3A). Sequencing confirmed in-frame removal of the Loop-coding sequence from exon 7 and proper splicing at the locus. Transcription of the truncated gene was also confirmed by RT-PCR using the primers from DEK1 CysPc-C2L coding regions, and judging from this semiquantitative RT-PCR, the level of dek1Ɗloop transcript is not changed (Supplemental Fig. S5D).
In contrast with emerging phyllids of wild-type plants (Fig. 2A), the most pronounced phenotype of the dek1Ɗloop mutant gametophores is retarded growth and lack of expanded phyllids (Fig. 2B). Instead, short filamentous protrusions form on the mutant gametophore stem (Fig. 2, B and E). Neither phyllids nor gametangia are formed on the mutant gametophore even after 2 months of cultivation under sporophyte-inducing conditions (Fig. 2E). Thus, we conclude that the dek1Ɗloop mutant is capable of forming gametophore apical stem cells giving rise to a phyllid-less stem, but that cell division and differentiation activities from the lateral domains that normally shape a leafy-shoot gametophore are blocked.
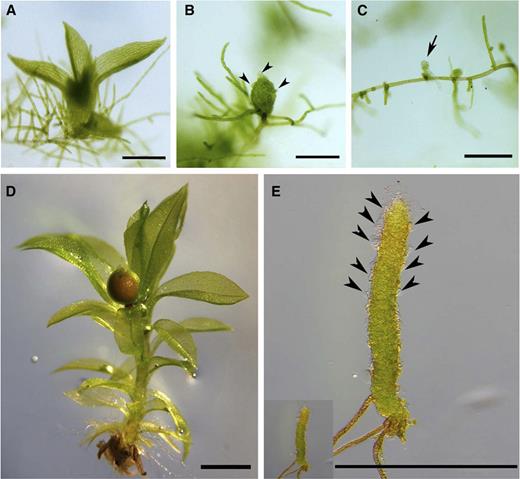
Gametophore development in the wild type, dek1Ɗloop, and Ɗdek1. A, Young wild-type gametophore grown on BCD medium. B, Young dek1Ɗloop gametophore grown on BCD medium. C, Arrested Ɗdek1 bud grown on BCD medium. D, Mature wild-type gametophore with differentiated sporophyte cultivated under the sporophyte-production conditions on soil block. E, Mature dek1Ɗloop gametophore cultivated under the sporophyte production conditions on soil block (the lower left sector shows the same mutant gametophore in the scale comparable to the wild-type gametophore in D). The arrow points to the Ɗdek1 bud, whereas arrowheads point to the filamentous protrusions formed on the dek1Ɗloop gametophore stem. Bar = 500 µm.
Gametophore pattern formation depends on asymmetric cell divisions coordinated by local cues within the developing body, as described in detail by Harrison et al. (2009). To characterize morphological changes in dek1Ɗloop gametophores, we studied the pattern of cell divisions in early buds and juvenile gametophores (Fig. 3). In the wild type, the bud initial cell divides first asymmetrically (Fig. 3A), giving rise to the bud apical and basal cells, respectively, which in a few hours undergo additional asymmetric divisions. The apical cell divides perpendicular to the first asymmetric division of the bud initial (Fig. 3A). As previously described by Perroud et al. (2014), positioning of the division plane in bud apical cells depends on DEK1 activity, and misorientation of cell divisions in Ɗdek1 mutants prevents establishment of the stem cell. Subsequently, the Ɗdek1 mutant fails to undergo transition to 3D growth and further development of the gametophore is arrested at the early bud stage (Fig. 2C; Perroud et al., 2014). As shown in Figure 3E, the apical cell of the two-cell stage bud in dek1Ɗloop mutant divides similar to the wild type, although with a slight bending of the cell wall. Unlike the Ɗdek1 mutant, the dek1Ɗloop mutant buds continue to grow. However, the pattern of cell division becomes irregular compared with the wild type (Fig. 3, G and H). In the wild type, phyllid initial cells emerge from the lateral domains early during juvenile gametophore development (Fig. 3D). Phyllid primordials then start to expand in mediolateral and proximodistal dimensions (Fig. 3I shows a two-cell file phyllid). The dek1Ɗloop mutant initiates formation of the phyllid progenitor cell-like structures (Fig. 3H); however, they fail to expand laterally and instead continue to proliferate as curved filamentous structures (Fig. 3J). Further proliferation of the filamentous protrusions from defective gametophores stops when they reach the three- to six-cell state (Supplemental Fig. S6). On the basis of the reduced growth and lack of expanded phyllids in the dek1Ɗloop mutant, we infer that an intact Loop is critical for DEK1 calpain activity required for locally coordinated asymmetric divisions, especially at the lateral domains that shape gametophore organs.
![Bud and early gametophore development in the wild type and the dek1Ɗloop mutant. A to D, Bud development in the wild type. E to H, Bud development in dek1Ɗloop. I, Juvenile wild-type gametophore with emerging phyllid. J, Juvenile dek1Ɗloop gametophore with filamentous protrusion formed from the phyllid progenitor cell. White arrows point to the first asymmetric division of the bud initial. Gray arrows point to the first division of the bud apical cell. Arrowheads point to the phyllid primordials. Bar = 50 µm. [See online article for color version of this figure.]](https://oup.silverchair-cdn.com/oup/backfile/Content_public/Journal/plphys/166/2/10.1104_pp.114.243758/2/m_plphys_v166_2_903_f3.jpeg?Expires=1750182304&Signature=jssbEWy~UEh3~~UdIBwAOItFpHFuhm~wyE1oUAYJ9-rWuA-HiwQNk2h8qC4yt-yJt9px0u7gu~kvNX9BoVaG1nCHd1nhoh6-MfRNKPLgAl2Ibx~MHsC~TBhbplazzxLaXnKD4x2FunGSc-mR~E2bLrY4XcEsUtXIVR2FpnlIZLdrCqKgjwcNOplr-CkUzD75zvkTl3Q~~ygXBhd632tNWL7EJ47HZe3OdT7U05RTRCviWNEA-OGhlJApYrjHvLoz6AuSyQE7Ly89YGKEigSGjcXh4OqJpK5Mtrox4dQdt69vR6FzNzYS~DmiSClXFtuqg2WWpX~uTkrw4UDKNFiBlg__&Key-Pair-Id=APKAIE5G5CRDK6RD3PGA)
Bud and early gametophore development in the wild type and the dek1Ɗloop mutant. A to D, Bud development in the wild type. E to H, Bud development in dek1Ɗloop. I, Juvenile wild-type gametophore with emerging phyllid. J, Juvenile dek1Ɗloop gametophore with filamentous protrusion formed from the phyllid progenitor cell. White arrows point to the first asymmetric division of the bud initial. Gray arrows point to the first division of the bud apical cell. Arrowheads point to the phyllid primordials. Bar = 50 µm. [See online article for color version of this figure.]
Deletion of the entire PpDEK1 coding sequence causes an overbudding phenotype in which the number of buds per 15 protonemal filaments (counted from the apical cell) is increased to approximately four compared with one bud in the wild type (Perroud et al., 2014). As shown in Figure 4, the bud induction in dek1Ɗloop mutant reaches an intermediate level between the wild type and Ɗdek1 mutant with an average number of buds close to two.

Bud initiation in the wild-type, Ɗdek1, dek1Ɗloop, MpLoop, AtLoop, and ZmLoop lines. The graph shows the average number of buds formed per 15 filament cells in the wild type, Ɗdek1, dek1Ɗloop, MpLoop, AtLoop, and ZmLoop lines. Values shown are means ± se. Different letters denote significant differences at P = 0.05 (ANOVA and lsd test). WT, Wild type.
The Loop from Liverworts, But Not Dicots or Monocots, Fully Complements the dek1Ɗloop Mutant of P. patens
To investigate whether Loops from the phylogenetically separate groups of Loop sequences from bryophytes, monocots, and angiosperms (Fig. 1A) are functionally conserved, we introduced the Loop coding sequences from the liverwort M. polymorpha, the monocot maize, and the dicot Arabidopsis into the original locus of the P. patens dek1Ɗloop mutant line. To verify the functionality of retargeted sequences, we first retargeted the wild-type Loop coding sequence to the dek1Ɗloop locus as described in the “Materials and Methods” (Supplemental Fig. S3B). Four independent lines were obtained in this experiment, all of which reverted to the wild-type phenotype (Fig. 5, A and C; Supplemental Figs. S3A and S7, A–C). The Loop coding sequences from M. polymorpha, maize, and Arabidopsis were then targeted to the dek1Ɗloop locus. The constructs used to transform the dek1Ɗloop line are depicted in Supplemental Figure S3C and lines carrying the heterologous Loop sequences were selected as described in the “Materials and Methods.”
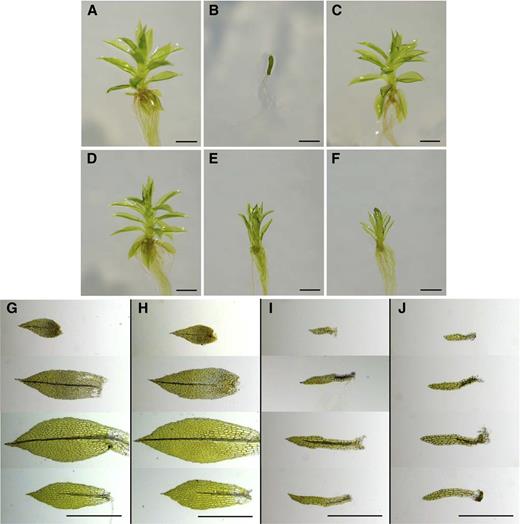
Gametophore development in the wild type and dek1Ɗloop complementation lines. A, Wild-type gametophore. B, dek1Ɗloop Gametophore. C, PpLoop-dek1Ɗloop complemented with the Loop coding sequence from P. patens showing the wild-type phenotype. D, MpLoop-dek1Ɗloop complemented with the Loop coding sequence from M. polymorpha. E, AtLoop-dek1Ɗloop complemented with the Loop coding sequence from Arabidopsis. F, ZmLoop-dek1Ɗloop complemented with the Loop coding sequence from maize. G to J, Isolated phyllids from the apical, subapical, middle, and basal part of the gametophores. G, Wild type. H, MpLoop. I, AtLoop. J, ZmLoop. Bar = 1 mm in A to F; 500 µm in G to J.
In the experiment in which the Loop coding sequence from M. polymorpha was introduced (Supplemental Fig. S3C), 15 transformants with no PCR signal for the original dek1Ɗloop locus out of the 31 analyzed lines displayed the Ɗdek1 phenotype. In a PCR screen for single insertion events, three lines with a positive signal were detected. One of these lines (MpLoop29; Supplemental Fig. S5, B and C, Southern-blot analysis) was subjected to the Cre recombinase-mediated elimination of the resistance cassette. Three lines with no resistance to the G418 were obtained, and all fully reverted to the wild-type phenotype as shown in more detail for one of the lines designed (MpLoop; Fig. 5). In-frame insertion of the MpLoop coding sequence and removal of the resistance cassette was confirmed by sequencing the Loop-overlapping genomic DNA region. Sequencing of the Loop overlapping cDNA regions confirmed proper splicing of the PpDEK1 transcript containing the heterologous MpLoop sequence (data not shown). Semiquantitative RT-PCR using the primers from the CysPc coding region showed that the transcript abundance in the MpLoop line is the same as in the wild type (Supplemental Fig. S5D). The fully developed gametophore of the MpLoop line is shown in Figure 5D. The size and overall morphology of the MpLoop gametophore is indistinguishable from the wild type with fully expanded phyllids and differentiated marginal serrated cells and midrib (Fig. 5H). The bud onset on protonemata in the MpLoop line shows the same rate as in the wild type (Fig. 4). After cultivation of this line under sporophyte-production conditions, we observed fully developed sporophytes indistinguishable from the wild type (Supplemental Fig. S7, A and D). These results show that the heterologous DEK1-Loop segment from the liverwort, sharing approximately 43% amino acid identity with PpLoop, is fully functional in moss demonstrating functional conservation of the DEK1-Loop within the groups of early diverging land plants (Fig. 1A).
Next, we investigated whether the monocot and dicot Loops that form separate clusters in the phylogenetic tree (Fig. 1B) are functional in P. patens. For the Arabidopsis Loop sequence, six P. patens lines were identified that contained the AtLoop out of the 95 transformants obtained. All of these lines showed proper targeting of the construct from both the 5′ and the 3′ ends and they all contained multiple copies of the targeted sequence at the locus. The line AtLoop14 was next subjected to the Cre recombinase-mediated elimination of the resistance cassette. Three AtLoop lines were obtained with no resistance to G418, all showing the same phenotype as described in more detail for one of the lines below (Supplemental Figs. S3C and S5, B and C, show the construct design and Southern blots, respectively). Correct in-frame insertion of the AtLoop was confirmed by sequencing of the Loop overlapping genomic region. Semiquantitative RT-PCR using the primers from the DEK1 CysPc-coding region showed that the transcript abundance in the AtLoop line is the same as in the wild type (Supplemental Fig. S5D). Replacement of the PpLoop coding sequence with its Arabidopsis counterpart causes reduced growth of gametophores and morphogenetic changes affecting phyllid development (Fig. 5E). AtLoop phyllids are narrow, with blades composed of three to five files of cells with variable size (Fig. 5I). No marginal serrated cells are differentiated. The midrib is formed in phyllids composed of more than three blade cell files, but does not differentiate through the entire phyllid axis (Fig. 5I). Onset of buds on protonemata in the AtLoop line shows the same rate as in the wild type (Fig. 4). After prolonged cultivation of the AtLoop line under the sporophyte development-promoting conditions, gametangia were formed; however, we were not able to detect any sporophytes (Supplemental Fig. S7E).
A similar result as for Arabidopsis was achieved when the Loop coding sequence from the monocot maize was used to replace the PpLoop (for construct design, see Supplemental Fig. S3). Of the 86 genotyped transformants, nine lines showed targeting of the ZmLoop to the dek1Ɗloop locus, all showing the Ɗdek1 mutant phenotype. On the basis of PCR genotyping, all of these lines showed proper targeting of the construct from both 5′ and 3′ ends and they all contained multiple copies of the targeted sequence at the locus. The line ZmLoop5 (Supplemental Fig. S5, B and C, Southern blot) was then subjected to the Cre recombinase-mediated elimination of the resistance cassette. Fifteen lines were selected with no resistance to the G418, all showing a phenotype similar to that of the ZmLoop line described below (Fig. 5F). In-frame insertion of the ZmLoop coding sequence and removal of the resistance cassette was confirmed by sequencing of the Loop overlapping genomic region. Semiquantitative RT-PCR using the primers from the DEK1 CysPc-C2L coding region showed that transcript abundance in the ZmLoop line is the same as in the wild type (Supplemental Fig. S5D). Similar to the AtLoop line, replacement of the PpLoop with its maize homolog caused reduced gametophore growth and aberrant phyllid development with narrow phyllids and blades composed of three to seven cell files (Fig. 5J). The size and morphology of the phyllid blade cells are variable, effecting phyllid morphology. All phyllids lack differentiated marginal serrated cells. The midrib-like structures are formed only in phyllids with more than three blade cell files, but do not reach the phyllid tip (Fig. 5J). Morphology of such midribs in the ZmLoop line appears more affected compared with the AtLoop line as depicted in representative examples of isolated phyllids in Figure 5, I and J. After cultivation of the ZmLoop line under sporophyte development-promoting conditions, gametangia were formed. However, no sporophytes were detected (Supplemental Fig. S7F). Despite the morphological abnormalities in ZmLoop gametophores, the number of buds formed per 15 filament cells is the same as in the wild type (Fig. 4).
PpDEK1 Deletion Alters Gene Expression Prior to Bud Formation
In order to detect genes and pathways regulated by DEK1, we performed a transcriptome analysis of wild-type and Ɗdek1 tissues at 6 and 14 d after culture initiation. At the first time point, the samples consisted of protonemata cells in both strains (Supplemental Fig. S8, A and B). During the next 8 d, budding occurred in both the wild type and in Ɗdek1, but gametophores developed only in the wild type (Supplemental Fig. S8, C and D). Three independent culture sets were used, giving a total of 12 data points. cDNA library building and Illumina RNA-Seq were performed at the Beijing Genomics Institute (http://www.genomics.cn/en/index) as described in the “Materials and Methods.” RNA-Seq data from this article can be found in the ArrayExpress database (http://www.ebi.ac.uk/arrayexpress/; accession no. E-MTAB-2588). After sequence read mapping against the P. patens genome, transcript abundance (fragments per kilobase of exon per million fragments mapped [FPKM]) and differential expression were calculated using uniquely mapped reads only as described in the “Materials and Methods” (Supplemental Table S3 includes the full data set; Supplemental Protocol S1 and Supplemental Figs. S9–S14 provide data set validation details).
As expected, the majority of genes are expressed (FPKM > 1) under all four conditions. However, there is also a substantial number of genes that are only expressed under certain conditions (Fig. 6A). Of the total number of transcripts assembled, 17,506 (85.2%) were present under all conditions, which is an unsurprising result because both strains are viable and they do not show morphological difference at the early time point. The gene ontology (GO) term annotation shows that the percentage of transcript annotation for the common pool (57% of annotated transcript) is slightly increased compared with the total published P. patens gene model annotation (41%). At the other end of the scale, Ɗdek1 and wild-type specific transcript pools for each time point show a significant drop in the frequency of gene annotations, with values between 8% and 30%. This drop may reflect an understudy of multicellular gametophytic development because this stage occurs in mosses and ferns to an extent not present in the more well studied angiosperms. Next we focused the analysis on transcript variation associated with both the dek1 mutation as well as developmental stages by looking at the interaction between the two factors using DESeq2 (Supplemental Table S4). In this analysis, we found 380 genes for which the different between the wild type and the Ɗdek1 mutant (false discovery rate adjusted P < 0.05, absolute log2 fold change > 1). In this set of 380 genes, there are 179 genes with a positive log2 fold change in the interaction contrast and 201 with a negative log2 fold change. A GOSlim term analysis performed on this gene subset (Supplemental Fig. S15) showed a clear enrichment in term function associated with the cell wall and cell periphery term. For example, the absence of gametophores in Ɗdek1 at 14 d reflects the reduction of transcript coding for P. patens ATP binding cassette subfamily G (ABCG) transporter PpABCG28 (Pp1s198_152V6), a protein associated with cuticle transport present only in gametophores (Buda et al., 2013). Similarly, NO APICAL MERISTEM, ARABIDOPSIS TRANSCRIPTION ACTIVATION FACTOR and CUP-SHAPED COTYLEDON transcription factor PpVNS1 and PpVNS5 (Pp1s182_37V6.1 and Pp1s223_12V6.1, respectively; Supplemental Fig. S16), recently shown to control part of phyllid midrib development (Xu et al., 2014), remains at a protonemal accumulation level in Ɗdek1. In addition, the PpDEK1 deletion also affects the transcriptome before onset of budding. More specifically, we identified a gene set that can be directly linked to the Ɗdek1 phenotype, namely overbudding that also occurs at a lower level in dek1Ɗloop (Fig. 4). Two APETALA2 (AP2) containing transcription factors, Pp1s131_139V6.1 and Pp1s131_131V6.1 named AINTEGUMENTA, PLETHORA, and BABY BOOM2 (APB2) and APB3, respectively, by Aoyama et al. (2012), are significantly up regulated in Ɗdek1 at both time points (Fig. 6B). These two genes belong to a small homologous gene set analyzed by Aoyama et al. (2012), which are necessary for the budding process because the quadruple knockout led to bud-less protonemal tissue. Conditional overexpression of one of these genes, APB4, in a knockout background not only restored the budding phenotype but also led to overbudding, a similar phenotype observed in the Ɗdek1 line of P. patens (Perroud et al., 2014). APB up-regulation in Ɗdek1 suggests the existence of a regulatory function of DEK1 in protonema independent of 3D development.
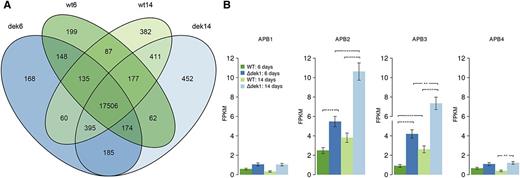
Transcriptome comparison between the wild type and Ɗdek1. A, Venn diagram representing the number of detected transcripts with a FPKM > 1 in the two strains (the wild type and Ɗdek1) at the two time points (6 and 14 d). B, Expression of AP2-type transcription factors APB1, APB2, APB3, and APB4. The height of the bars corresponds to the reported FPKM, and the error bars represent the se (n = 3). Asterisks indicate significance based on the adjusted P value (**P < 0.01 and ***P < 0.001). WT, Wild type.
Charophycean Algae Were the Last Group of Land Plant Predecessors with Multiple Forms of Calpains
Previous analysis concluded that the predecessor of Chlorophyta and Charophyta possessed multiple members of the calpain superfamily (Liang et al., 2013). In land plants, calpains are represented only by the DEK1 clade of TML calpains, whereas only cytosolic calpains, but not DEK1, have been identified in the chlorophyte genome sequences available at that time (Liang et al., 2013). Using RNA-Seq data from organisms that represent the five major lineages of charophyte algae, we identified 17 different CysPc transcripts within Mesostigmatales (M. viride), Klebsormidiales (K. flaccidum), Charales (N. mirabilis), Coleochaetales (Coleochaete orbicularis), and Zygnematales (Spyrogyra pratensis and M. scalaris; Supplemental Table S5). In all species examined, except in S. pratensis, DEK1-like transcripts were detected that encode proteins with identical modular composition to land plant DEK1 proteins. In addition, we identified several CysPc sequences in transcripts encoding proteins without the unique DEK1-domains (MEM and Arm), including transcripts containing single or multiple CysPc domains, with or without the conserved catalytic triad (Cys, His, and Asn) and with or without a C-terminal C2L domain (Supplemental Table S5). These cytosolic non-DEK1-like calpains were detected in M. viride, K. flaccidum, N. mirabilis, and S. pratensis, but not in transcriptome data available for C. orbicularis, possibly representing the stage at which cytosolic calpains were lost during land plant evolution. Phylogenetic reconstruction was performed to infer the evolutionary relationship between the various charophyte CysPc sequences, together with representative land plant and chlorophyte sequences. The resulting phylogeny (Fig. 7) confirmed that Mesostigmatales, Klebsormidiales, and Zygnematales species, early diverging charophytes, harbor both DEK1-clade TML calpains (clustering with land plant calpains) and cytosolic calpains (clustering with cytosolic chlorophyte and animal calpains). The cytosolic calpains were subsequently lost within the evolutionary advanced charophytes, leaving the DEK1 protein as the single calpain of land plants.
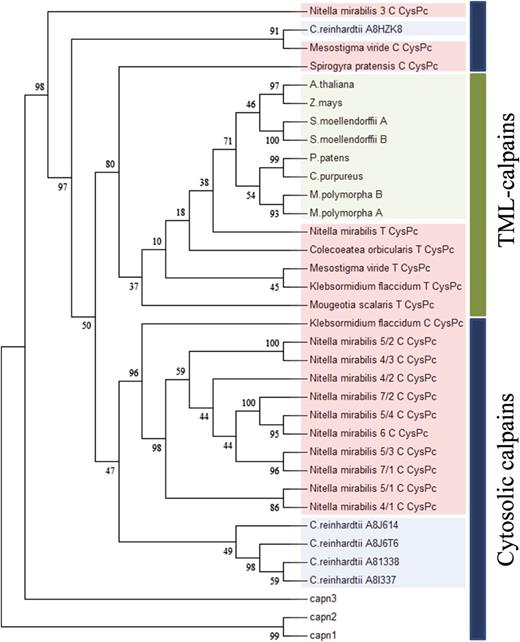
Phylogenetic analysis of streptophyte and representative chlorophyte CysPc sequences. The CysPc sequences were aligned with MAFFT (version 7.058b). The tree was constructed using RAxML with 1,000 bootstrap replicates using the WAG model with γ-distributed rate heterogeneity. TML calpains cluster in a separate group from the cytosolic calpains. Land plant sequences are highlighted in green, and charophyte and chlorophyte algae sequences are in red and blue, respectively. Cytosolic rat calpains are indicated by capn1 to capn3.
DISCUSSION
This study expands our knowledge of DEK1 evolution by showing the distribution of the calpain family in chlorophyte and charophyte algae as well as land plants, together representing an evolutionary time span of about 1000 million years (Zimmer et al., 2007; Pires and Dolan, 2012). As reported earlier, TML calpains, calpains with more than 15 TMSs linked to the protease CysPc-C2L, originated approximately 1.5 billion years ago as a result of a fusion between the CysPc-C2L domains and the TML domain, forming a monophyletic group (Zhao et al., 2012). Reanalysis of the TML domain presented here indicates that segments of the TML domain belong to the large family of MFS domains of secondary transporters, which, similar to CysPc, are also of prokaryotic origin (Pao et al., 1998). We currently have no information about the function of TML in the regulation of CysPc activity in groups other than plants, including members of the Excavata and Stramenopiles, Alveolates, and Rhizaria supergroups, as well as in Thecamonas trahens, an ancient eukaryote sister to Opisthokonta (animals, protists, and fungi; Zhao et al., 2012). We previously showed that the last common ancestor of the chlorophyte and charophyte algae likely contained both TML calpains and cytosolic calpains, but that we were unable to detect TML calpains in species belonging to the Chlorophyta, including Chlamydomonas reinhradtii, Volvox carteri, and Micromonas pusilla. Here we show that early diverging charophytes harbored both the cytosolic calpains and DEK1-like calpains. The cytosolic calpains were subsequently lost within the evolutionary advanced charophytes, leaving the TML calpain as the single calpain giving rise to the DEK1 clade of land plants. This supports our hypothesis that DEK1 evolved from TML calpains by assuming a unique positional sensing function and thereby enabling the critical ability of land plants to direct 3D growth and development of complex organs. One possible explanation for the loss of cytosolic calpains is that cytosolic calpains interfered with DEK1 action and was therefore selected against during the transition from charophyte algae to land plants. Methods for genetic transformation of charophyte algae that could aid in elucidating calpain function in land plant predecessors are currently under way (Sørensen et al., 2014).
A vital role of DEK1 in controlling 3D growth and development is also supported by the fact that DEK1 exists as a single gene in the overwhelming majority of plants examined to date. During land plant evolution, a single TML calpain evolved into the DEK1 clade, in which the calpain catalytic core domain CysPc is highly conserved (Liang et al., 2013). As shown here, the Loop sequence is much more divergent than the sequence of the calpain moiety domains, indicating a role for evolutionary pressure on the regulatory function of the Loop in driving morphological and functional divergence between bryophytes and early tracheophytes, and later dicots and monocots. Retention of a single DEK1 gene in the vast majority of land plants implies selection pressure to maintain DEK1 calpain and its indispensable role in the developmental control of land plants. Elimination of additional copies after multiple genome-wide duplication events has been reported for genes with essential physiological and developmental roles (De Smet et al., 2013).
Previous studies have shown that complementation of dek1 mutants in both Arabidopsis and P. patens can be achieved by expression of the native CysPc-C2L domains, and also by the CysPc-C2L from P. patens in the case of Arabidopsis dek1 (Johnson et al., 2008; Liang et al., 2013). However, the high frequency of abnormal phenotypes and the requirement for a promoter with specific spatiotemporal activity strongly point to an important role for the MEM domain in regulating CysPc enzyme activity. Supplemental Table S6 provides an overview of dek1 mutants, DEK1 down-regulation, and overexpression lines as well as genetic complementation experiments in P. patens and representative angiosperm species. Although a complete understanding of the mechanism of DEK1 activation in surface cells or gametophores via the MEM domain can only be achieved after determination of its 3D structure, some progress toward a better understanding of how this works is provided in this study by the identification of homology between subdomains of MEM and the MFS domains of secondary transporters (Supplemental Fig. S2). We propose that the function of MFS proteins in facilitating transport of various solutes across the membranes in response to chemiosmotic gradients is compatible with evolution of a functional role for MEM in sensing the difference between the surface membrane of a neighboring cell and the external environment. It is likely that this relationship was not discovered earlier due to the large sequence divergence between current-day MFS proteins and MEM. The significance of the positioning of the Loop on the cytosolic side can only be fully appreciated after the 3D structure has been solved. The importance of the Loop in modulating DEK1 calpain activity shown in this study is in line with a dominant negative effect reported in Arabidopsis lines in which the MEM containing the Loop were overexpressed, whereas the lines overexpressing MEM without the Loop appeared wild type (Tian et al., 2007). Removing the Loop in P. patens dek1Ɗloop mutant has a significant effect on gametophore development. However, the effect is less severe than in the Ɗdek1 mutant, because dek1Ɗloop buds are able to form and orient the wall in the bud apical cell perpendicularly to the first asymmetric division of the bud initial, and perpetuate cell proliferation (Fig. 3). In our interpretation, this suggests that the CysPc-C2L domain of dek1Ɗloop plants undergoes a basal level of activation under less stringent control leading to proteolytic activity, albeit at a lower level than in the wild type. In the subsequent development of the gametophore, the effect of removing the Loop becomes evident, causing complete blocking of phyllid development. Interestingly, phyllid progenitor-like cells are formed on dek1Ɗloop buds and later on an aberrant gametophore stem (Figs. 2 and 3), which shows that an intact Loop is required for the CysPc-C2L activity necessary for the asymmetric cell divisions that drive phyllid expansion. This assumption is further supported by the phenotypes of lines with introduced Loop coding sequences from Arabidopsis and maize, where the phyllids are formed but their proximodistal and mediolateral expansion is greatly affected (Fig. 5). One possible explanation for the phenotype of dek1Ɗloop that cannot presently be excluded is destabilization of the molecular structure of MEM as a result of removal of the Loop. However, the observation of near normal division plane positioning in the dek1Ɗloop early bud cells and progressive stem growth suggests that the MEM structure is not completely disturbed; rather, it is improperly regulated without the Loop. The independent folding of separate domains within a multidomain protein has been reported for several proteins as a mechanism preventing separate domains from engaging in aberrant interactions with one another (Netzer and Hartl, 1998; Rüßmann et al., 2012). This fact also speaks against the severe disruption of MEM in the dek1Ɗloop mutant. The 3D structure determination and knowledge of intramolecular interactions within the MEM would shed more light on the structure-function relationships between the Loop and the rest of the MEM domain. In the future, we hope to be able to measure the in vivo activity of calpains in different mutants and in different cell types in which the effects on division plane determination are affected. This has met with considerable difficulties even in the best-studied cases with animal classical calpains (Zadran et al., 2010); however, it represents a powerful future tool to understand the spatiotemporal control of calpain action.
Interestingly, the Loop segment from the liverwort M. polymorpha is fully functional in P. patens even if the amino acid identity between the Loops from these species is only 43%. It is therefore interesting to note that the P. patens Loop shares 38% amino acid identity to Arabidopsis and 35% identity to the maize Loop, respectively. Recent phylogenetic studies resolved the liverworts as the earliest-divergent clade of land plants and mosses as the sister group to hornworts plus tracheophytes (Ligrone et al., 2012). According to a number of studies, liverworts, mosses, and hornworts diverged sequentially and form a paraphyletic group with the hornworts sister to the tracheophytes (Karol et al., 2001; Qiu et al., 2006). On the other hand, according to other recent analyses, bryophytes represent a monophyletic group (Cox et al., 2014). Our functional analysis presented in this work shows that Loops from the moss and the liverwort are interfunctional in the gametophytic and sporophytic phase despite the low sequence identity and uncertain evolutionary distance, and we also show that a likely shift in Loop function occurred in angiosperms that displayed a different body plan organization. Another possible explanation for the lack of full complementation is the failure of the posttranscriptional processing of the PpDEK1 transcripts containing the Loop-coding sequences from Arabidopsis and maize. This possibility is raised by the presence of alternative splicing variants in the AtLoop and ZmLoop lines in addition to normal splice variants (data not shown).
Analysis of the transcriptome of wild-type and Ɗdek1 protonemata and early gametophores identifies DEK1 as a regulator of the initiation of gametophore buds in protonemata by suppressing APB2 and APB3 transcription factors, thereby keeping the number of buds to only one per 15 filaments in the wild type. Four buds per filament are formed with an increased level of these transcription factors in Ɗdek1, whereas the level is intermediate in dek1Ɗloop, consistent with the observation of less severe phenotypes for this mutant in other traits as well. It was recently shown that the AP2-type transcription factors (APB1–APB4) are positively regulated by auxin and restrict the fate of the bud initial cell in P. patens protonema tissue (Aoyama et al., 2012). Here we show that a lack of DEK1 function in the Ɗdek1 mutant causes an overall up-regulation of APB2 and APB3 in protonemata (Fig. 6), which is accompanied by a significant increase in bud formation (Perroud et al., 2014; Fig. 4). This indicates that a physiological role of DEK1 in protonemata involves sensing of cues defined by local gradients of signaling molecules in the growing protonemal tissue, triggering the downstream events, which restrict the fate of side branch initial cells.
The negative control of bud initiation is relaxed in the Ɗdek1 mutant. However, the buds fail to establish a functional meristematic stem cell and their further development is arrested at an early stage (Perroud et al., 2014). Tight control of almost invariant cell division plane positioning typical for wild-type buds is completely lost in the Ɗdek1 mutant, and the newly formed cell walls are often bent and wrinkled in addition to their misorientation (Perroud et al., 2014). A growing body of evidence shows that physical properties of the cell wall and mechanical forces between the neighboring cells constrain genetic regulation of cell proliferation and specification (Murray et al., 2012). However, the integrating mechanisms remain largely unknown. The functional interplay between WUSCHEL-related genes, which control stem cells in the meristems of flowering plants, and cell wall-modifying enzymes was recently reported in P. patens by Sakibara et al. (2014). In their work, the authors show that PpWOX13L activity is required for the up-regulation of cell wall-loosening enzymes that appear to be involved in stem cell formation and growth in P. patens. The potential role of DEK1 in the pathways involving WUSCHEL-related genes was previously hypothesized (for review, see Lau et al., 2012). Cell division plane orientation, cell wall expansion, and fate specification are uncoupled in the Ɗdek1 mutant (Perroud et al., 2014). As we show in this work, a lack of DEK1 function disturbs transcriptional regulation of the genes associated with cell wall modification and morphogenesis (Supplemental Fig. S9; Supplemental Table S4). This again may reflect an inability of the Ɗdek1 mutant to sense and respond to the local cues generated by mechanical forces or gradients of signaling molecules both in protonemata and buds.
CONCLUSION
Here, we show that P. patens strains in which the DEK1 Loop is deleted from the transmembrane domain (dek1Ɗloop) retain sufficient activity to allow cell divisions during early bud development. However, subsequent leafy gametophore development is compromised. Although dek1Ɗloop strains form phyllid primordial cells on gametophore stems, they are incapable of further expansion. These results support our postulated sensory/regulatory role of the Loop segment in the spatiotemporal control of DEK1 activity. In silico re-examination of the Loop topology in DEK1 proteins from algae and land plants shows that the Loop is oriented toward the cytosol. To our knowledge, this is the first study to identify significant homology between DEK1 MEM and a known membrane protein family, namely MFS. We believe that the function of MSF proteins give important hints as to how DEK1 may function in positional signaling to be explored in future experiments. DEK1 evolved from an ancient form of calpains containing a large transmembrane domain (TML calpains) some 1.5 billion years ago. Here we show that in contrast with the chlorophyte algae, which retained only cytosolic calpains, charophyte algae harbor both DEK1-like calpains and cytosolic calpains. During the evolutionary transition from advanced charophyte algae to land plants, the cytosolic calpins were lost and the DEK1-calpain clade evolved, supporting our postulated key role for DEK1 during land plant evolution. In contrast with the highly conserved CysPc-C2L protease domains of land plants, we show that the Loop segment is more variable, both between representatives of charophyte algae and between charophytes and within DEK1 of land plants. A functional differentiation of the loop is also supported by the observation that the Loop sequence of the liverwort M. polymorpha genetically complements the P. patens dek1Ɗloop phenotype, whereas Loop sequences from Arabidopsis and maize only partially complement the same mutant. We interpret this finding to show that in order to stay functional as the land plant morphology evolved, the Loop also evolved. Finally, we show that DEK1 activity is required for controlled expression of genes involved in cell wall remodeling and developmental transition in side branch initials from secondary protonema to bud initial cells. These results indicate that DEK1, although not essential for protonemata cell division and differentiation, may play a role in modulating growth responses globally, likely via the sensing of local cues that determine bud initiation and cell wall expansion. Later, in developing buds and gametophores, DEK1 plays essential role in body patterning, in which various activities are likely needed to control different morphogenetic programs.
MATERIALS AND METHODS
Plant Material and Growth Conditions
In this study, we used the Physcomitrella patens Gransden strain. Tissue maintenance and production was performed on minimal media supplemented with 920 mg L−1 of ammonium tartrate (BCDA) as described in Cove et al. (2009). P. patens tissue and protoplasts were grown under long-day conditions (16-h light [70–80 µmol m−2 s−1]/8-h dark) at 25°C. Medium was supplemented with 30 µg L−1 Hygromycin B or 50 µg L−1 G418 for selection of transformed cells. All phenotypic characterizations were performed on minimal media (BCD) unless specifically mentioned (Cove et al., 2009). Culture for bud count was established as follows. A BCD-containing petri dish was inoculated with 16 equally spaced spot inoculums consisting of 10 μL of protonemal tissue suspension. A bud count was performed after 14 d of growth on 15 caulonemal filament cells. Standardly, 100 filaments were randomly picked from each plate to establish a budding pattern. Tissue for sporophyte production was grown on sterile Jiffy7 soil blocks placed in the glass flasks under short-day conditions (8-h light [70–80 µmol m−2 s−1]/16-h dark) at 15°C and manipulated as described by Perroud et al. (2011). Tissue for RNA-Seq analysis was grown and harvested as follows: tissue of protonema cells grown on BCDA medium under the long-day regime (16-h light [70–80 µmol m−2 s−1]/8-h dark) at 25°C was collected, homogenized in sterile water, and inoculated on BCD medium overlaid with cellophane discs (2 mL of homogenized tissue per plate) as described in Cove et al., (2009). Then, the tissue was collected after 6 and 14 d of growth under the long-day regime (16-h light [70–80 µmol m−2 s−1]/8-h dark) at 25°C, frozen in liquid nitrogen, and stored at −80°C. The procedure was repeated three times to obtain replicates for further analysis.
In Silico Analyses
The DEK1 sequences used in this study are listed in Supplemental Table S1. The topography of the transmembrane domain of DEK1 was analyzed with HMMTOP2.0 (Tusnády and Simon, 1998), using the image creator MyDomain tool (http://prosite.expasy.org/mydomains/) to visualize the result. DEK1 sequences were submitted to the SMART server (http://smart.embl-heidelberg.de/) to identify and extract the amino acids corresponding to the DEK1-Loop segment. The DEK1-Loop sequences were aligned using MAFFT (version 7.058b) and the L-INS-i algorithm. To calculate the pairwise sequence identity between the DEK1-Loop sequences, the MAFFT alignment was submitted to SIAS (http://imed.med.ucm.es/Tools/). This tool calculates the identity as the number of identical residues divided by the length of the shortest sequence. To generate the DEK1-Loop sequence logo, the WebLogo tool (http://weblogo.berkeley.edu/logo.cgi) was used. We performed phylogenetic analyses using the maximum likelihood method as implemented in RAxML (version 7.2.6; Stamatakis, 2006). We used the WAG model of protein evolution (Whelan and Goldman, 2001) with γ-distributed rate heterogeneity. Branch support was assessed by running 1,000 bootstrap replicates.
PpDEK1_ƊLoop and Loop Complementation Vector Construction
Primers used for vector construction are listed in Supplemental Table S2. The schematics for the gene deletion and knock-in complementation constructs are shown in Supplemental Figure S3. All nucleotide numberings are relative to the A1TG start site in the P. patens DEK1 gene sequence (Pp1s173_19V6.1; http://www.phytozome.net) unless otherwise stated. All generated plasmid vectors were verified by restriction digestion analysis and sequencing.
The Loop deletion vector was designed to remove the Loop coding sequence and insert a hygromycin resistance cassette in a single intron. After sequences and assembly design, fragment syntheses and cloning were ordered and performed by GenScript. The 5′ targeting sequence spans nucleotides 2,561 to 3,563 and is flanked by 5′ HindIII and 3′ NruI restriction enzymes. This fragment ends in intron 7. To avoid any splicing conflict with heterologous splicing border pair, the 3′ targeting sequence starts with the end of intron 6 exon 7 border (nucleotides 3,562–3,609) and continues with the exon 8 sequence (nucleotides 5,298–6,301; Supplemental Fig. S3A). In addition, 5′ KasI and 3′ NsiI restrictions enzymes flank the 3′ fragment. Both fragments were cloned sequentially into pBHRH (Schaefer et al., 2010) using HindIII/NruI and KasI/NsiI restriction enzyme pairs, respectively, creating the pBHRF-DEK1-ƊLoop vector (Supplemental Fig. S3A). Prior to transformation, pBHRF-DEK1-ƊLoop was digested with the restriction enzymes HindIII and NsiI.
Complementation constructs have been assembled to reinsert the Loop sequences from different species into the deleted locus. First, to reinsert the P. patens Loop sequence into its native locus, a DNA fragment, spanning the Loop sequence and 5′ and 3′ flanking regions (nucleotides 2,563–5,719), was PCR amplified from genomic P. patens DNA using primers V1/SP and V1/ASP. The resulting 3,156-bp PCR fragment was cloned into the Zero Blunt PCR cloning vector (Invitrogen), giving plasmid pCR_PpLOOP_V1 (Supplemental Fig. S3B). pCR_PpLOOP_V1 was digested with the EcoRI restriction enzyme prior to protoplast transformation. Second, we built three constructs aimed to test heterologous Loop sequences from Arabidopsis (Arabidopsis thaliana; At), maize (Zea mays; Zm), and Marchantia polymorpha (Mp). In these constructs, chimeric Loop from At (nucleotides 2,028–2,855 relative to the ATG start site; AT1G55350), Zm (nucleotides 4,181–5029 relative to the ATG start site; A4061804.1), or Mp (see below) flanked by P. patens DEK1 5′ and 3′ targeting sequences were constructed as follows. Two DNA fragments were synthetized de novo by GenScript (http://www.genscript.com/). First, The Loop 5′ targeting fragment was a 2,174-bp chimeric sequence composed of P. patens DEK1 nucleotides 2,565 to 3681, M. polymorpha DEK1 nucleotides 1,036 to 1,935 (Liang et al., 2013), and P. patens DEK1 nucleotides 4,528 to 4,655, and flanked with 5′ and 3′ PmlI and XhoI restriction sites, respectively. Second, The Loop 3′ targeting fragment was a 968-bp sequence of P. patens DEK1 nucleotides 2,179 to 3,136, and flanked with 5′ and 3′ MluI and ClaI restriction sites, respectively. The Loop 5′ and 3′ targeting fragments were inserted into the vector pBNRF (Schaefer et al., 2010) using PmlI/XhoI and MluI/ClaI restriction sites, respectively, resulting in plasmid pBNRF-MpDEK1-Loop-Comp (Supplemental Fig. S3C). Before transformation, pBNRF-MpDEK1-Loop-Comp was digested with PmlI and ClaI restriction enzymes. To make the corresponding At and Zm Loop complementation constructs, the In-Fusion Cloning Strategy was used (Clontech Laboratory). To generate the At and ZmLoop In-Fusion inserts, forward and reverse gene-specific primers containing 5′ and 3′ 15-bp extensions complementary to the P. patens Loop 3′ flanking sequences in the pBNRF-MpDEK1-Loop-Comp plasmid was used to PCR amplify At (primers At_Loop_ifc_SP and At_Loop_ifc_ASP) and Zm (primers Zm_Loop_ifc_SP and Zm_Loop_ifc_ASP) from genomic DNA. These inserts were each mixed with linearized vector pBNRF-MpDEK1-Loop-Comp, produced by PCR amplification using primers SP_Loop_Comp and ASP_Loop_Comp to exclude the MpLoop coding sequence. The inserts and linearized vector were ligated using the In-Fusion Cloning strategy according to the manufacturer’s instructions, resulting in plasmids pBNRF-AtDEK1-Loop-Comp and pBNRF-ZmDEK1-Loop-Comp (Supplemental Fig. S3C). Prior to transformation, these two plasmids were digested using SalI/SwaI restriction enzymes.
Transformation Procedure
P. patens protoplast production and stable transformation was performed according to the method of Schaefer and Zrÿd (1997) modified by Cove et al. (2009) with 15 µg of linearized plasmid DNA used per transformation. Transformed protoplast regeneration and selection was performed by transferring the culture to different media according to the following sequence: 6 d of protoplast regeneration on protoplast regeneration medium, 6 d of selection on BCDA medium supplemented with the appropriate antibiotic, 14 d of growth on BCDA medium, and 7 d on BCDA supplemented with the appropriate antibiotic. Resistant plants were then picked individually on fresh BCDA medium and used for genotyping and phenotype analysis after sufficient growth.
A Cre recombinase procedure to remove resistance marker from primary transformant was performed as previously described (Trouiller et al., 2006) with minor modifications. Transformed tissue was grown as the wild type and protoplast production and transformation were carried out using 20 µg pAct-Cre (Trouiller et al., 2006) using regular procedure. Protoplasts were plated on cellophane diluted (25,000 counted protoplasts per 9-cm petri dish) to avoid picking mixed regenerated plants. Protoplast regeneration and test procedures were performed as follows: (1) 4 d of protoplast regeneration on protoplast regeneration medium, (2) 4 d of protonemata growth on BCDA medium, (3) individual plant picking on fresh BCDA plates and growth for 8 d, and (4) replica plating of each individual plant on BCDA medium and BCDA with the appropriate antibiotic. Strains showing loss of antibiotic resistance were selected and grown until sufficient tissue was available for genotyping and phenotype analysis.
Molecular Characterization of Transformants
Genomic DNA for Southern-blot analysis was extracted using the Nucleon PhytoPure Genomic DNA Extraction Kit (GE Healthcare). Southern-blot analysis was performed as described by Perroud and Quatrano (2006) using 1 µg of DNA per digestion. Probes were labeled with digoxigenin using the DIG Probe PCR synthesis kit (Roche) according to the manufacturer’s instructions. Templates for PCR amplification of probes were genomic DNA extracted from P. patens and pBHRF vector. Four different probes (Supplemental Fig. S5) were made to hybridize to the 5′ and 3′ targeting sequences, the kanamycin resistant gene (G418), and the Loop coding sequence using primer pairs PpL5_S_Sp/PpL5_S_Asp, PpL3_S_Sp/PpL3_S_Asp, G418-F/G418-R, and PpLL_S_Sp/PpLL_SAsp, respectively.
RT-PCR and sequencing were used to analyze P. patens DEK1 transcripts to ensure proper deletions/insertions and splicing at the DEK1 Loop locus. Total RNA was isolated from P. patens protonemata using the Plant RNeasy Kit (Qiagen). Five-hundred ng of DNase I-treated total RNA was reverse transcribed by 200 units of Superscript III Reverse Transcriptase (Invitrogen) primed with random hexamers (50 µm) at 55°C for 60 min. Phusion High-Fidelity DNA polymerase was used to amplify the target sequence spanning a region from exon 6 to exon 9 (genomic nucleotides 3,190–5,358) as follows. First, 1 µL of undiluted cDNA template was PCR amplified with primers RT-Loop-F and RT-Loop-R (Supplemental Fig. S3) using the following cycling conditions: 98°C for 30 s, 35 cycles of 98°C for 10 s, 56°C for 30 s, and 72°C for 30 s, and a final elongation step of 72°C for 5 min. The PCR product was then treated with exonuclease I (Fermentas) to remove excess primers, and then cycling sequencing reactions were performed using primers PpL_5_Tar-Fw and PpL_3_Tar-Rv, and the ABI BigDye v.3.1 chemistry according to the stepped elongation time protocol (Platt et al., 2007). DNA fragments were precipitated using sodium acetate:ethanol and finally sequenced by Capillary Electrophoresis using the 3130xL Genetic Analyzer (Life Technologies). The Genomic Workbench Software was used to analyze the sequences.
Genotyping of the Complemented Lines
First, we genotyped obtained transformants by PCR, looking for loss of the original dek1Ɗloop locus with RT-Loop-F and RT_Loop-R primers. Then, we screened selected lines from the first round of genotyping for single-copy insertion at the locus using LoopGenot-F and LoopGenot-R primers annealing upstream and downstream of the targeting sequences, respectively (Supplemental Fig. S3). To confirm targeting of the cassette from both 5′ and 3′ sites, we PCR genotyped the lines using the LoopGenot_F and 35S-R primers (5′ targeting) and Term-F and LoopGento-R primers (3′ targeting; Supplemental Fig. S3). Southern-blot analysis was performed to identify the lines with random insertion of the targeting construct in the genome (Supplemental Fig. S5). Resistance cassettes were eventually removed from selected lines using the Cre recombinase-mediated approach as described above. The lines that showed loss of the resistance against G418 were further genotyped in three steps: (1) by PCR using the RT-Loop-F/RT_Loop-R, (2) by Southern-blot analysis, and (3) by sequencing of the cDNA regions overlapping introduced chimeric Loops as described above.
Molecular Procedure for High-Throughput Sequencing
Total RNA was extracted from frozen material using the RNeasy lipid tissue mini kit (Qiagen) with few modifications. Briefly, the frozen tissue was thoroughly homogenized in liquid nitrogen using a mortar and pestle. Approximately 120 mg of powdered tissue was lysed in 1 mL of QIAzol lysis reagent. Two hundred μL of chloroform was added and the mixture was centrifuged at 4°C. The aqueous phase was collected, 1.5 volumes of 100% (v/v) ethanol was added, and the mixture was vortexed. After binding of the RNA to the RNeasy mini spin column, on-column DNase I treatment was performed to remove genomic DNA. The column was washed with the RPE buffer (Qiagen), dried, and RNA eluted in 45 µL of ribonuclease-free water. The concentration of RNA was measured and RNA integrity was further assessed using an Agilent 2100 Bioanalyzer (DE54704553; Agilent Technologies) with an RNA 6000 LabChip kit. The RNA samples were stored at −80°C until sent for sequencing.
The library construction and sequencing was performed at Beijing Genomics Institute (http://www.genomics.cn/en/index). The total RNA samples were treated with DNase I to degrade any possible DNA contamination. Then the mRNA was enriched by using oligo(dT) magnetic beads. Mixed with the fragmentation buffer, the mRNA was fragmented into short fragments (about 200 bp). The first strand of cDNA was synthesized by using random hexamer primers. Buffer, deoxynucleotide triphosphates, ribonuclease H, and DNA polymerase I were added to synthesize the second strand and the double-strand cDNA was purified with magnetic beads. End reparation and 3′-end single nucleotide adenine addition was then performed. Finally, sequencing adaptors were ligated to the fragments and the fragments were enriched by PCR amplification. During the quality-control step, the Agilent 2100 Bioanalyzer and the ABI StepOnePlus Real-Time PCR System were used to qualify and quantify the sample library. The library products were sequenced via Illumina HiSeqTM 2000. The read length for all samples was 49 bp.
Bioinformatics Analyses of the High-Throughput Data Set
Reads were aligned against the genomic assembly of P. patens (Rensing et al., 2008; Zimmer et al., 2013; http://www.phytozome.net/physcomitrella.php, v1.6; Ppatens_152.fa and Ppatens_152_gene_exons.gff3) using Bowtie (version 2.1.0; Langmead et al., 2009) and Tophat (version 2.0.10; Trapnell et al., 2009) using default parameters. Sample quality was assessed using FastQC (version 0.10.1; http://www.bioinformatics.babraham.ac.uk/projects/fastqc/), with all samples passing quality control. For downstream analysis, only uniquely mapped reads were kept (Supplemental Table S7).
GO (Ashburner et al., 2000) terms were taken from the P. patens annotation (http://www.phytozome.net/physcomitrella.php, v1.6; Ppatens_152_annotation_info.txt). GOSlim terms were derived using GOSlimAuto provided by AgBase (McCarthy et al., 2006) based on the automated slimming of GO term annotations (Davis et al., 2010). The significance of over-representation was quantified using hypergeometric tests as implemented in the R package GOstats (Falcon and Gentleman, 2007) with parameter conditions set to FALSE and false discovery rate adjustment of P values (Benjamini and Hochberg, 1995). We applied cuffdiff (version 2.1.1; Trapnell et al., 2010) to estimate gene abundance and to test for pairwise differential expression using the Physcomitrella gene models (parameters: -dispersion-method per-condition–library-norm-method quartile–frag-bias-correct Ppatens_152.fa). Genes with an FPKM larger than 1 as reported from cuffdiff were marked as being expressed. We applied a count-based approach for finding genes showing a significant difference between the wild type and Ɗdek1 in the change of expression between 6 d and 14 d. After extracting the gene-wise unique raw counts by using HTSeq (http://www-huber.embl.de/users/anders/HTSeq), we applied DESeq2 (Anders and Huber, 2010), which makes use of negative binomial generalized linear models to test for differentially expressed genes. We tested for an interaction between genotype and time, so that the resulting genes were those for which the amount of change between the two time points was significantly different between the wild type and Ɗdek1. Genes with a false discovery rate-adjusted P value below 0.05 and an absolute log2 fold change larger than 1 were kept as being differentially expressed.
Sequence data from this article can be found in the ArrayExpress database under accession number E-MTAB-2588.
Supplemental Data
The following materials are available in the online version of this article.
Supplemental Figure S1. Bioinformatic analyses of Loop sequences.
Supplemental Figure S2. Conserved domains detected in the P. patens DEK1 protein by RPS-BLAST using the National Center for Biotechnology Information Conserved Domain Architecture Retrieval Tool.
Supplemental Figure S3. Vector construction for targeted deletion and replacements of the PpLoop.
Supplemental Figure S4. Gametophore morphology in dek1Ɗloop line before and after the Cre recombinase-mediated removal of the resistance cassette.
Supplemental Figure S5. Southern-blot genotyping and RT-PCR.
Supplemental Figure S6. Phyllid development failure in the dek1Ɗloop mutant.
Supplemental Figure S7. Sporophyte formation in the wild-type, dek1Ɗloop, and Loop complemented lines.
Supplemental Figure S8. Micrographs of the P. patens tissue used for RNA-Seq analysis.
Supplemental Figure S9. Correlation between biological replicates.
Supplemental Figure S10. K-means clustering of the data set.
Supplemental Figure S11. Full data set principal component analysis.
Supplemental Figure S12. Comparison of the data set expressed genes with external data sets.
Supplemental Figure S13. Expression of PpDEK1 and control genes in the data set.
Supplemental Figure S14. Track view of PpDEK1 expression in the data set.
Supplemental Figure S15. Transcriptome comparison between the wild type and Ɗdek1.
Supplemental Figure S16. Expression of selected PpVNS genes.
Supplemental Table S1. DEK1 Loop sequences from land plants and charophyte algae used in this study.
Supplemental Table S2. Primer sequences used in this study.
Supplemental Table S3. Gene expression as reported by cufflinks.
Supplemental Table S4. Interaction differential expression analysis results.
Supplemental Table S5. Overview of identified CysP transcripts from charophyte algae.
Supplemental Table S6. Overview of phenotypes of the dek1 mutants, DEK1 down-regulation and overexpression lines, and genetic complementation experiments in P. patens and angiosperm species.
Supplemental Table S7. Read mapping results.
Supplemental Protocol S1. RNA-Seq data validation.
Glossary
- 3D
three-dimensional
- cDNA
complementary DNA
- RNA-Seq
RNA sequencing
- TMS
transmembrane segment
- GO
gene ontology
- AP2
APETALA2
LITERATURE CITED
Author notes
This work was supported by the Norwegian Research Council to the Norwegian University for Life Sciences (research grant no. FRIBIO ES456034 to O.-A.O. and personnel support to V.D. and P.-F.P.), Hedmark University College (grant no. SHP ES441985 209 to O.-A.O. and personnel support to W.J. and A.E.A.), Washington University (to. R.S.Q. and P.-F.P), Deutsche Forschungsgemeinschaft Project SFB924 (to K.F.X.M.), and the U.S. National Science Foundation (grant no. DEB–1036506 to C.F.D. and E.D.C.).
These authors contributed equally to the article.
Present address: Department of Plant Physiology, Faculty of Natural Sciences, Comenius University, Mlynska dolina, Bratislava 84215, Slovakia.
Address correspondence to [email protected].
The author responsible for distribution of materials integral to the findings presented in this article in accordance with the policy described in the Instructions for Authors (www.plantphysiol.org) is: Odd-Arne Olsen ([email protected]).
Some figures in this article are displayed in color online but in black and white in the print edition.
The online version of this article contains Web-only data.
Articles can be viewed online without a subscription.
