


Abstract
ETHYLENE RESPONSE FACTOR1 (ERF1) is an upstream component in both jasmonate (JA) and ethylene (ET) signaling and is involved in pathogen resistance. Accumulating evidence suggests that ERF1 might be related to the salt stress response through ethylene signaling. However, the specific role of ERF1 in abiotic stress and the molecular mechanism underlying the signaling cross talk still need to be elucidated. Here, we report that ERF1 was highly induced by high salinity and drought stress in Arabidopsis (Arabidopsis thaliana). The salt stress induction required both JA and ET signaling but was inhibited by abscisic acid. ERF1-overexpressing lines (35S:ERF1) were more tolerant to drought and salt stress. They also displayed constitutively smaller stomatal aperture and less transpirational water loss. Surprisingly, 35S:ERF1 also showed enhanced heat tolerance and up-regulation of heat tolerance genes compared with the wild type. Several suites of genes activated by JA, drought, salt, and heat were found in microarray analysis of 35S:ERF1. Chromatin immunoprecipitation assays found that ERF1 up-regulates specific suites of genes in response to different abiotic stresses by stress-specific binding to GCC or DRE/CRT. In response to biotic stress, ERF1 bound to GCC boxes but not DRE elements; conversely, under abiotic stress, we observed specific binding of ERF1 to DRE elements. Furthermore, ERF1 bound preferentially to only one among several GCC box or DRE/CRT elements in the promoter region of its target genes. ERF1 plays a positive role in salt, drought, and heat stress tolerance by stress-specific gene regulation, which integrates JA, ET, and abscisic acid signals.
Environmental stresses such as heat, cold, drought, and high salinity influence plant growth and productivity. Plants respond and adapt to these stresses at physiological and biochemical levels. Abiotic stress has been shown to induce the expression of genes with various functions in a variety of plants (Yamaguchi-Shinozaki and Shinozaki, 2006). Ethylene-responsive element-binding factors (ERFs) form a plant-specific transcriptional factor superfamily of 147 members in Arabidopsis (Arabidopsis thaliana; Nakano et al., 2006). ERFs influence a number of developmental processes and are also important for adaptation to biotic or abiotic stresses such as pathogen attack, wounding, UV irradiation, extreme temperature, and drought (Ecker, 1995; O’Donnell et al., 1996; Penninckx et al., 1996). Several Arabidopsis ERFs bind to the GCC box consensus sequence TAAGAGCCGCC, which has a minimal function; the core sequence of AGCCGCC is typically referred to as the GCC motif (Hao et al., 1998). GCC motif binding occurs through a highly conserved DNA-binding domain approximately 60 amino acids in length (Ohme-Takagi and Shinshi, 1995). This domain forms an interface of three antiparallel β-strands and one α-helix, with the β-strands binding primarily to GCC box.
It has been demonstrated that constitutive expression of ERF1 (AT3G23240), a downstream component of the ethylene (ET) signaling pathway, increases Arabidopsis resistance to Botrytis cinerea and Plectosphaerella cucumerina (Berrocal-Lobo et al., 2002). The expression of ERF1 can be activated rapidly by ET or jasmonate (JA) and can be activated synergistically by both hormones (Lorenzo et al., 2003). Furthermore, 35S:ERF1 expression can rescue the defense response defects of coronative insensitive1 and ethylene insensitive2 (ein2). These results suggest that ERF1 acts downstream of the intersection between the ET and JA pathways and that this transcription factor is a key element in the integration of both signals for the regulation of defense response genes (Lorenzo et al., 2003). Constitutive expression of ERF1 activates the transcription of downstream effector genes, such as BASIC CHITINASE (b-CHI) and PLANT DEFENSIN1.2 (PDF1.2), to promote the ET response (Solano et al., 1998). Solano et al. (1998) also found that EIN3 directly regulates ERF1 gene expression by binding to a primary ethylene response element present in the promoter of ERF1.
Recent studies have shown that alterations in ET signaling affect plant responses to both salt and water stress (Cao et al., 2006, 2008; Cela et al., 2011). ET-insensitive mutants are reported to be more salt sensitive, suggesting that ET signaling reduces salt sensitivity (Cao et al., 2008). As a central regulator of ET response genes, ERF1 could be turned on by salt stress, and its expression was altered in a salt-sensitive mutant, vitamin E-deficient4 (vte4; Cela et al., 2011). In other species, ET response factors sharing sequence similarity to ERF1 have also been reported to be involved in various abiotic stresses. Transcription of the wheat (Triticum aestivum) TaERF1 gene was induced by drought, salinity, low temperature, exogenous abscisic acid (ABA), ET, and salicylic acid as well as by infection with Blumeria graminis f. sp. tritici (Xu et al., 2007). Furthermore, overexpression of TaERF1 activated stress-related genes, including PATHOGEN RESPONSE and COLD RESPONSE/RESPONSIVE TO DESICCATION (COR/RD) genes, under normal growth conditions and improved pathogen and abiotic stress tolerance in transgenic plants. These results suggested that the TaERF1 gene encodes a GCC box and CRT/DRE element-binding factor that might be involved in multiple stress signal transduction pathways (Xu et al., 2007). It has also been shown that JERF3 isolated from tomato (Solanum lycopersicum) could be induced by ET, JA, cold, salinity, or ABA, transcriptionally regulated the expression of genes involved in plant responses to osmotic and oxidative stresses, and enhanced the drought, salt, and freezing resistance in tobacco (Nicotiana tabacum), perhaps through reduced reactive oxygen species accumulation (Wang et al., 2004). These results suggest that Arabidopsis ERF1 might also be involved in the abiotic stress response in addition to its role in the defense response. However, the specific role of ERF1 in abiotic stress and the molecular mechanism underlying signaling cross talk between biotic and abiotic stress are still unclear.
We found the ERF1 could enhance drought survival through screening of a transcription factor overexpression library, AtTORF-EX (Weiste et al., 2007). In further experiments, we found a dynamic role of ERF1 in both abiotic and biotic stress responses. Expression of ERF1 was rapidly and transiently induced by salt and dehydration treatments, and 35S:ERF1 transgenics were more tolerant to drought, salt, and even heat stress. Transcriptional analysis using 35S:ERF1 and ERF1 RNA interference (RNAi) knockdown plants found that many stress-related genes, such as COR/RD genes and heat shock-inducible genes, were up-regulated in 35S:ERF1 and conversely down-regulated in ERF1 RNAi plants. Chromatin immunoprecipitation (ChIP) assays revealed a unique mechanism whereby ERF1 bound preferentially to different cis-elements of downstream genes under different stress treatments. This novel mechanism may be a more widespread mechanism for transcription factors to generate specific patterns of gene expression in response to different environmental stimuli.
RESULTS
Abiotic Stress Response, Subcellular Localization, and Expression Pattern of ERF1
We screened seed pools of the AtTORF-EX library (Weiste et al., 2007) by subjecting 2-week-old plants to water withholding over a 2-week period. Surviving plants were selected for sequencing. From this screening, ERF1 was found and further characterized in this paper. Expression of ERF1 was gradually induced by salt (150 mm NaCl), osmotic (400 mm mannitol), and drought stress treatments over 12 h and peaked at 3, 6, and 1 h, respectively, for the different abiotic stress treatments (Fig. 1A). In contrast, we observed hardly any induction of ERF1 under heat stress (37°C) treatment. According to the AtGenExpress Visualization Tool and electronic fluorescent pictographic browser databases, ERF1 is induced by salt stress, especially in the roots, but not by ABA treatment. Across developmental stages, ERF1 expression is higher in dry seeds, seedlings, and senescent leaves. ERF1 subcellular localization was determined by transiently expressing an N-terminal fusion of ERF1 to GFP in Arabidopsis protoplasts using polyethylene glycol-mediated transformation. The ERF1-GFP fusion protein was detected in nuclei (Fig. 1B), and this was confirmed by comparison with 4′,6-diamino-phenylindole staining of nuclei.
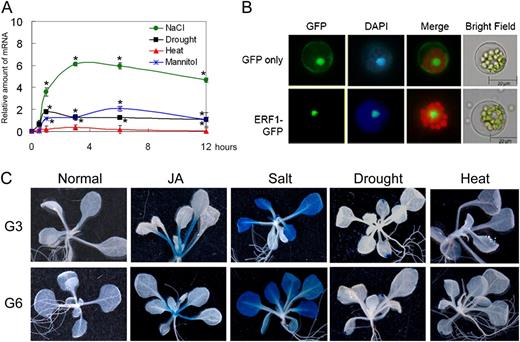
Expression profile of ERF1. A, qRT-PCR analyses of ERF1 induction by abiotic stresses. Total RNA was extracted from plants harvested at the indicated times after each treatment. Two-week-old seedlings were dried on Whatman 3MM paper (Drought), treated with 150 mm NaCl (NaCl), treated with 400 mm mannitol (Mannitol), or incubated at 37°C (Heat). The amplification of ACTIN2 was used as an internal control to normalize all data. The level of the transcript before stress treatments was set to 1.0. Three independent experiments were performed with similar results. Error bars indicate se (ANOVA; *P < 0.05). B, Fluorescence microscopy images of Arabidopsis protoplast. Constructs of 35S:GFP or 35S:ERF1-GFP were translocated into Arabidopsis protoplast by polyethylene glycol transfection. The expression of the introduced genes was detected after 16 h. Nuclei are shown with 4′,6-diamino-phenylindole (DAPI) staining. Bars = 20 μm. C, GUS staining of ERF1 promoter:GUS transgenic plants. Three-week-old homozygous plants (G3 and G6) were either mock treated or treated with 50 μm JA, 150 mm NaCl, 30 min of drought stress, or 1 h of heat shock stress (45°C). Histochemical GUS staining was performed overnight on 10 seedlings for each experiment.
For analyzing the spatial expression of ERF1 under different stress conditions, we fused a 1.5-kb fragment of the ERF1 promoter region to the GUS reporter gene and introduced this construct into Arabidopsis. Three-week-old T2 transgenic plants were analyzed after treatment with JA, salt stress, drought, or heat shock. There was almost no GUS expression under normal conditions (Fig. 1C). After JA treatment, GUS activity was mainly observed in petiole, whereas after salt stress treatment, GUS activity was observed in leaves but not in petiole and the main veins of leaves. After drought and heat shock stress treatment, there was much less GUS activity, except for some regions of leaf tips or leaf margins (Fig. 1C).
Considering that ERF1 might regulate plant responses to a variety of abiotic stresses in which the phytohormone ABA plays an important regulatory role, we asked whether ABA would affect the induction of ERF1 expression. Because ERF1 was reported to be activated synergistically by both JA and ET, we also examined the effect of different hormone combinations on ERF1 expression. In quantitative reverse transcription (qRT)-PCR analyses, ERF1 was repressed by 30 min of ABA treatment but then slowly recovered at later time points (Fig. 2A). ABA-RESPONSIVE-ELEMENT BINDING FACTOR1 (AREB1) was used as a marker gene to show the effectiveness of the ABA treatment. Both JA and ET treatments could trigger ERF1 expression, and the combination of both JA and ET resulted in a synergetic effect on ERF1 induction. However, ERF1 induction by JA, ET, or combined JA and ET treatment was suppressed by ABA (Fig. 2B). These results indicated that that ABA-negative regulation of ERF1 could override JA or ET induction. Consistent with this, GUS staining also showed that ABA treatment could suppress ERF1 promoter induction by JA and ET (Fig. 2C).
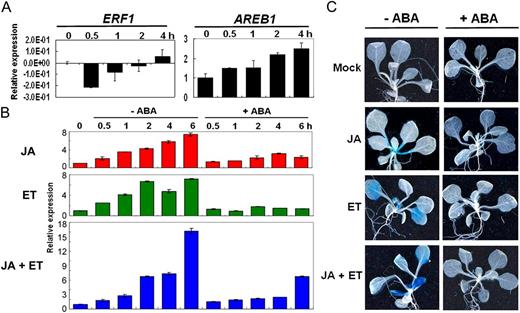
ABA inhibition effect on ERF1 expression. In qRT-PCR and GUS staining analyses, 2-week-old wild-type or ERF1 promoter:GUS transgenic plants were either mock treated or treated with 50 μm JA, 50 μm ET, both JA + ET, or together with 50 μm ABA. A, qRT-PCR analyses of ERF1 and AREB1 under ABA treatment. Total RNA was extracted from 2-week-old plants harvested at the indicated times after 50 μm ABA treatment. Three independent experiments were performed with similar results. B, qRT-PCR analyses of ERF1 under different combinations of hormone treatments. Three independent experiments were performed with similar results. Error bars indicate se. C, Hormone applications on GUS staining of ERF1 promoter:GUS transgenic plants. Samples were collected after 1 h of each treatment.
Overexpression of ERF1 Enhanced Drought and Salt Tolerance in Arabidopsis
We produced both transgenic plants overexpressing the ERF1 gene under the control of the cauliflower mosaic virus 35S promoter (35S:ERF1) as well as RNAi knockdown lines using a specific 50-bp fragment of the ERF1 coding sequence. Expression of ERF1 in the 35S:ERF1 transgenic plants and knockdown plants was verified by qRT-PCR assays (Fig. 3A). 35S:ERF1 plants had a greater resistance to water deficit (Fig. 3B). After 12 d without watering, 35S:ERF1 plants remained nearly turgid without manifesting major macroscopic symptoms of drought-related stress, whereas wild-type and RNAi plants were visibly damaged. The survival rate for 35S:ERF1 plants after resumption of watering was about 90%, compared with only about 33% for wild-type and RNAi plants (Fig. 3D). Similarly, 35S:ERF1 plants also had greater salt tolerance (Fig. 3C). Plants were grown in normal conditions for about 3 weeks and then were watered with 100 mm saline for 4 d, then 200 mm saline for another 4 d, and then 300 mm saline for the rest of the time. After this salt stress treatment, nearly all 35S:ERF1 plants had survived, while only 44% of the wild-type and RNAi plants had (Fig. 3D). 35S:ERF1 plants also had higher germination rates on medium containing 100 to 200 mm NaCl (Fig. 3E). By statistical calculation, in the control and 100 mm NaCl treatments, the germination rates were about the same. But in the 150 mm NaCl condition, germination of the wild type was inhibited and only about 4% of seeds germinated, while the germination rate of 35S:ERF1 plants still reached 100%. Even in the 200 mm NaCl treatment after 5 d, almost no wild-type plants germinated, but the 35S:ERF1 plants had more than 60% of seeds germinated (Fig. 3E). In contrast, ERF1 RNAi lines had reduced germination at 150 or 200 mm NaCl.
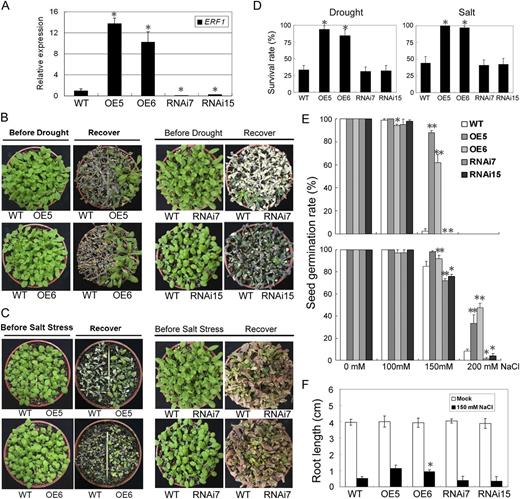
Drought- and salt-tolerant phenotypes of 35S:ERF1 transgenic Arabidopsis. A, Expression levels of ERF1 mRNA in 35S:ERF1 (OE5 and OE6) and ERF1 RNAi (RNAi7 and RNAi15) transgenic plants. B, Drought tolerance of wild-type (WT), 35S:ERF1, and ERF1 RNAi transgenic plants after withholding water for 12 to 16 d and rehydration for 4 d (Recover). C, Three-week-old plants were irrigated with different concentrations of NaCl solution (100 mm for 4 d, 200 mm for another 4 d, and 300 mm for the rest of the time). These experiments were repeated three times with similar results. D, Survival rates of wild-type, 35S:ERF1, and ERF1 RNAi transgenic plants under drought and salt stress. Error bars indicate se (Student’s t test; *P < 0.001). E, Seed germination rates of 35S:ERF1 and ERF1 RNAi transgenic plants under salt stress treatment. ERF1 overexpressed and RNAi seeds were germinated under different concentrations of NaCl. The germination rates were calculated after 3 d (top panel) and 5 d (bottom panel). Results are averages of three replicates. Error bars indicate se (Student’s t test; *P < 0.05, **P < 0.01). F, Root elongation assays. Three-day-old seedlings were transferred to an MS agar plate with 150 mm NaCl and incubated vertically for 7 d before root lengths were measured. Results are averages of three replicates. Error bars indicate se (Student’s t test; *P < 0.05).
As an additional assay of salt tolerance, we measured root elongation under high salinity. The seeds were incubated in one-half-strength Murashige and Skoog (MS) medium for 3 d and then transferred to the plates containing 150 mm NaCl, and the root length increase over 5 d of salt treatment was measured. Significantly greater root elongation was observed in the 35S:ERF1 seedlings, while ERF1 RNAi lines were similar to the wild type (Fig. 3F).
ERF1 Overexpression Reduced Leaf Water Loss and Stomatal Aperture But Increased Pro and ABA Content
To investigate the underlying mechanisms of the drought resistance phenotype of 35S:ERF1, we performed water loss and stomatal aperture assays. As reduction in stomatal aperture is a critical aspect of the drought response, we hypothesized that the enhanced drought resistance of the 35S:ERF1 plants might be related to reduced leaf water loss. Indeed, the transpiration rate from 35S:ERF1 was reduced relative to the wild type in detached leaf assays (Fig. 4A). Consistent with this, 35S:ERF1 plants had a constitutively reduced stomatal aperture compared with wild-type plants (Fig. 4, B and C). ABA treatment reduced stomatal aperture to a similar extent in transgenic and wild-type plants when the smaller initial aperture of 35S:ERF1 was taken into account. The stomatal aperture response to ABA treatment in the ERF1 RNAi mutant was similar to that of the wild type (Fig. 4C). Also consistent with the detached leaf assays and reduced stomatal aperture, 35S:ERF1 plants had significantly higher leaf temperature than wild-type plants (Fig. 4A). All these assays indicated that reduced leaf water loss was one factor, although possibly not the only factor, in the enhanced drought resistance of 35S:ERF1 plants.
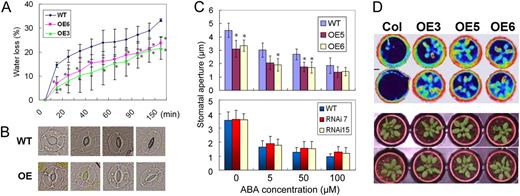
Water loss in detached leaves and the influence of ERF1 overexpression on ABA-mediated stomatal closure. A, Water loss from detached leaves as a function of time in Col-0 and 35S:ERF1 plants (OE3 and OE6). This experiment was repeated three times with similar results. Values are means of the percentage of leaf water loss ± se (n = 15). Error bars indicate se (ANOVA; *P < 0.05). B, Micrographs representing the dynamics of ABA-mediated stomatal closure in Col-0 and 35S:ERF1 plants. C, Stomatal apertures were measured on epidermal peels of wild-type (WT), 35S:ERF1 (OE5 and OE6), and ERF1 RNAi (RNAi7 and RNAi15) transgenic plants. Stomata were preopened under light for 2.5 h and then incubated in the indicated concentrations of ABA for 2.5 h under light. This experiment was repeated three times with the same trend. Values are means ± se (n > 60). Error bars indicate se (ANOVA; *P < 0.05). D, Infrared thermal images of 3-week-old 35S:ERF1 (OE3, OE5, and OE6) and wild-type (Col) plants.
Pro is a compatible osmolyte that contributes to drought tolerance through the protection of cellular structure and the role of Pro metabolism in redox buffering (Szabados and Savouré, 2010, Verslues and Sharma, 2010, Sharma et al., 2011). To determine whether ERF1 overexpression affected Pro accumulation, Pro contents in 35S:ERF1 and ERF1 RNAi mutants were measured. As seen in Figure 5A, 35S:ERF1 plants accumulated higher Pro levels, whereas ERF1 RNAi lines accumulated lower Pro levels, compared with the wild type under normal conditions. However, when treated with 0.4 m mannitol, there was no significant difference among overexpression, RNAi, and wild-type plants (Fig. 5A). We also found that (Ɗ1-PYRROLINE-5- CARBOXYLATE SYNTHETASE1 (P5CS1), which encodes the key enzyme in stress-induced Pro synthesis, was more highly expressed in 35S:ERF1 plants but less expressed in the RNAi plants (Supplemental Fig. S1). These data indicated that ERF1 positively regulates Pro accumulation.
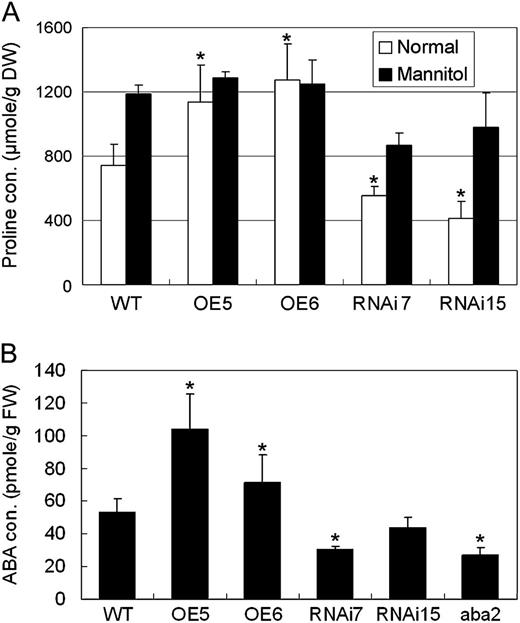
Pro and ABA contents in ERF1 transgenic plants. Total Pro or ABA was prepared from 3-week-old Arabidopsis grown on MS agar plates. Pro contents were also measured after treating with 0.4 m mannitol for 24 h. Data are presented as means and se of three replications. A, Pro contents in ERF1 transgenic plants. Error bars indicate se (ANOVA; *P < 0.01). DW, Dry weight; WT, wild type. B, ABA contents of ERF1 transgenic plants. Error bars indicate se (Student’s t test; *P < 0.01). FW, Fresh weight.
ABA is believed to play an important part in plant responses to environmental stress. Moreover, P5CS1 expression and Pro accumulation are partially ABA dependent (Szabados and Savouré, 2010; Verslues and Sharma, 2010). Therefore, we suspected that ABA content might be altered in ERF1 transgenic plants. Interestingly, the ABA content was up to 2-fold higher in 35:ERF1 plants than in wild-type plants but lower in ERF1 RNAi plants (Fig. 5B). One of the RNAi lines had ABA content just as low as the ABA-deficient mutant aba2-1, and this was used as a comparison.
ERF1 Induction Required Both ET and JA Signaling under Salt Stress and Was Negatively Regulated by ABA
We then examined the role of ABA in ERF1 expression. Interestingly, salt-induced expression of ERF1 was not impaired in aba2-1 but was reduced significantly in ABA-hypersensitive abi1 and abi2 knockout mutants (Merlot et al., 2001; Fig. 6A). This indicated that ERF1 was connected to ABA both through its effect on ABA content and the negative regulation of its expression by ABA signaling.
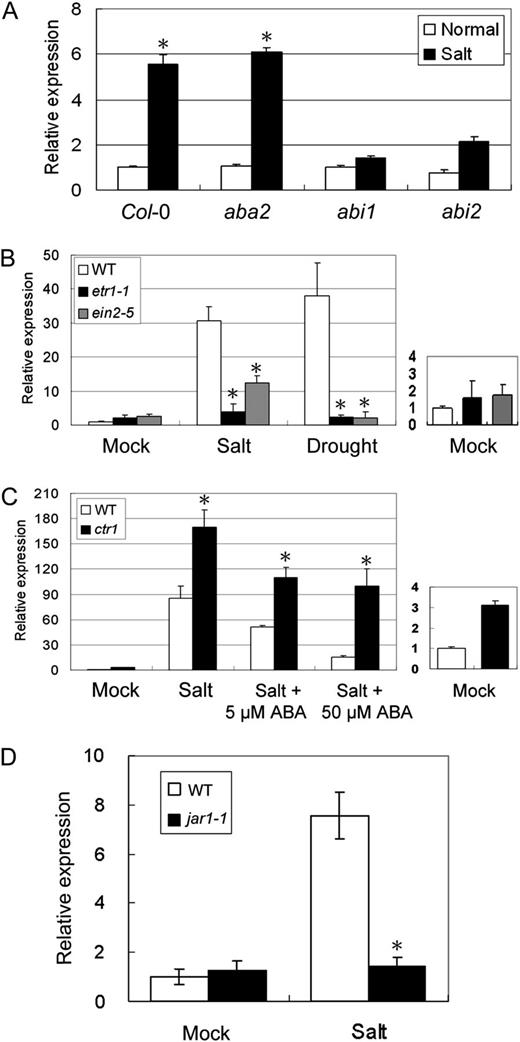
Effects of ABA, ET, and JA on ERF1 gene expression. The relative mRNA amounts of ERF1 were analyzed by qRT-PCR (the expression level of Col-0 was set to 1). Total RNA was prepared from 3-week-old Arabidopsis grown on MS agar plates treated with 0.4 m mannitol for 24 h or 150 mm NaCl for 1 h. Data represent means and se of three replications. Error bars indicate se (ANOVA; *P < 0.01). A, Effects of high salinity on ERF1 gene expression in aba2, abi1, and abi2 knockout mutants. B, Effects of high salinity and drought stress on ERF1 gene expression in etr1-1 and ein2-5 mutants. WT, Wild type. C, Effects of high salinity and ABA on ERF1 gene expression in ctr1 mutants. D, Effects of high salinity and JA on ERF1 gene expression in jar1-1 mutants.
To know whether the salt stress induction of ERF1 requires ET signaling, we further examined ERF1 expression in ET-insensitive mutants, etr1-1 and ein2-5 (Fig. 6B). ERF1 induction was blocked in etr1-1 and ein2-5 under either salt or drought stress. We also tested ABA inhibition of ERF1 induction in the ET-hypersensitive mutant ctr1 and found that ctrl had higher than wild-type ERF1 expression even in the presence of ABA (Fig. 6C). Also, to test whether salt stress induction of ERF1 requires JA signaling, we examined ERF1 expression in the JA-insensitive mutant jar1-1 and found that ERF1 induction was suppressed in jar1-1 (Fig. 6D). These data indicated that the salt induction of ERF1 required both ET and JA signaling and that increased ET response could override the negative effect of ABA.
Transcriptome Analysis of Transgenic Arabidopsis Overexpressing ERF1
To investigate the involvement of ERF1 in the regulation of the expression of abiotic stress-responsive genes, and to further understand why 35S:ERF1 transgenic plants are resistant to drought and salt, a transcriptome analysis of 35S:ERF1 plants was performed using an Agilent Arabidopsis 2 Oligo Microarray (Agilent Technologies) covering about 21,000 genes. Relative to vector control plants, 1,156 genes were expressed at least 2-fold higher in 35S:ERF1. Genes involved in abiotic stress responses (drought, salt, and heat stress) were selected from Gene Ontology analysis by GeneSpring 11 software and are listed in Table I. This analysis confirmed that many drought stress- or salt stress-inducible genes are potentially downstream of ERF1, including RD29B, COR47, LEA4-5, RD20, and many others. Among the 1,156 ERF1 up-regulated genes, 46 and 61 genes showed drought- and salt-responsive gene expression, respectively (Fig. 7A). Eighteen of the 46 drought stress-inducible genes are also involved in the salt stress response. A limitation of this data is that ectopic expression of ERF1 may lead to the up-regulation of genes that are not normally influenced by ERF1. To address this concern, we tested the expression of several ERF1 up-regulated genes in the ERF1 RNAi mutants. Six ERF1 up-regulated genes, LEA4-5, RD20, RD29B, COR47, HSP17.6A, and HSP23.6-MITO, showed clear reduction of their stress-inducible expression in ERF1 RNAi plants (Fig. 7B).
Abiotic stress-related genes up-regulated in 35S:ERF1
Abiotic stress-related genes constitutively expressed in 35S:ERF1 transgenic plants were compared with wild-type plants. Genes in this table used in the ChIP assay are highlighted in boldface letters. Included in this table are genes with a directed role in abiotic stress or that are involved indirectly in abiotic stress responses (drought, salt, and heat stress). The number of plus signs indicates the number of sequences. Genes that have no DRE or GCC in their promoter regions are indicated by minus signs.
| Gene Symbol | Gene Name | Product Description | Fold Change | DREa | GCCa |
|---|---|---|---|---|---|
| All drought, salt, and heat stress | |||||
| At3g23240 | ERF1 | Ethylene response factor1 | 201.76 | ||
| At1g43160 | RAP2.6 | Ethylene response factor subfamily B-4 | 72.62 | ++ | − |
| At2g38340 | DREB19 | Dehydration response element-binding protein19 | 21.19 | − | + |
| At1g12610 | DDF1 | Dwarf and delayed flowering1 | 4.60 | ++ | − |
| At2g38470 | WRKY33 | WRKY DNA-binding protein33 | 2.79 | +++ | + |
| Both drought and salt stress | |||||
| At1g08930 | ERD6 | Early response to dehydration6 | 7.13 | − | − |
| At1g05680 | UGT74E2 | UDP-glucosyltransferase74E2 | 5.42 | ++++ | − |
| At5g13330 | RAP2.6L | Related to AP2 6L | 4.82 | − | − |
| At1g02930 | GSTF6 | Glutathione S-transferase ϕ6 | 3.94 | − | − |
| At2g17840 | ERD7 | Early response to dehydration7 | 3.82 | − | − |
| At1g27730 | STZ | Salt tolerance zinc finger | 3.15 | − | − |
| At2g17290 | CPK6 | Calcium-dependent protein kinase6 | 2.83 | +++ | − |
| At3g19580 | ZF2 | Zinc finger protein2 | 2.80 | − | ++ |
| At2g41010 | CAMBP25 | Calmodulin binding protein of 25 kD | 2.75 | − | − |
| At5g62470 | MYB96 | R2R3-type Myb transcription factor96 | 2.73 | − | − |
| At5g52300 | RD29B | Responsive to desiccation29B | 2.54 | ++ | − |
| At2g47190 | MYB2 | MYB transcription factor2 | 2.44 | − | − |
| At2g33380 | RD20 | Responsive to desiccation20 | 2.25 | ++ | − |
| At1g69270 | RPK1 | Receptor-like kinase1 | 2.21 | − | − |
| Both drought and heat stress | |||||
| At1g20440 | COR47 | Cold-regulated47 | 2.90 | +++ | − |
| At5g05410 | DREB2A | DRE-binding protein2A | 2.80 | ++ | − |
| At3g24500 | MBF1C | Multiprotein bridging factor1C | 2.64 | − | ++ |
| Both salt and heat stress | |||||
| At3g08720 | S6K2 | Ser/Thr protein kinase2 | 6.05 | − | − |
| At2g30250 | WRKY25 | WRKY DNA-binding protein25 | 5.88 | − | − |
| At1g59860 | –b | HSP20-like chaperone superfamily protein | 2.95 | + | + |
| At5g59820 | RHL41 | Responsive to high light41 | 2.25 | − | − |
| Drought stress only | |||||
| At2g40170 | GEA6 | Late embryogenesis abundant6 | 61.94 | +++ | + |
| At5g59220 | HAI1 | Highly ABA-induced PP2C gene1 | 9.93 | − | + |
| At5g06760 | LEA4-5 | Late embryogenesis abundant4-5 | 7.00 | ++ | + |
| At2g35930 | PUB23 | Cytoplasmically localized U-box domain-containing E3 ubiquitin ligase | 5.43 | − | − |
| At4g02380 | SAG21 | Senescence-associated gene21 | 5.37 | + | − |
| At1g52890 | ANAC019 | NAC domain-containing protein19 | 5.17 | ++ | + |
| At3g02480 | – | Late embryogenesis abundant protein family protein | 4.11 | + | − |
| At3g30775 | ERD5 | Early response to dehydration5 | 3.58 | + | − |
| At2g41430 | ERD15 | Early response to dehydration15 | 3.36 | + | − |
| At2g35300 | LEA18 | Late embryogenesis abundant18 | 2.61 | + | − |
| At1g32560 | LEA4-1 | Late embryogenesis abundant4-1 | 2.46 | + | − |
| At2g02800 | KIN2 | Kinase2 | 2.38 | + | − |
| At2g30870 | GSTF10 | Glutathione S-transferase ϕ10 | 2.37 | ++ | ++ |
| At4g25490 | CBF1 | C-repeat/DRE-binding factor1 | 2.35 | ++ | − |
| At2g18050 | HIS1-3 | Histone H1-3 | 2.31 | + | − |
| At1g22190 | RAP2.4 | Related to AP2 4 | 2.27 | + | − |
| At4g02200 | – | Drought-responsive family protein | 2.27 | − | − |
| At1g33560 | ADR1 | Activated disease resistance1 | 2.25 | +++ | − |
| At5g45340 | CYP707A3 | Cytochrome P450 | 2.21 | + | − |
| At1g20450 | ERD10 | Early response to dehydration10 | 2.20 | ++ | − |
| At1g76180 | ERD14 | Early response to dehydration14 | 2.19 | + | − |
| At3g15500 | ANAC055 | NAC domain-containing protein55 | 2.17 | + | + |
| At1g56280 | DI19 | Drought-induced19 | 2.13 | +++ | + |
| At3g06760 | – | Drought-responsive family protein | 2.03 | + | + |
| At1g32640 | MYC2 | MYC transcription factor2 | 2.01 | − | − |
| Salt stress only | |||||
| At1g73260 | KTI1 | Kunitz trypsin inhibitor1 | 23.14 | + | − |
| At4g11650 | OSM34 | Osmotin34 | 21.71 | + | − |
| At4g16260 | – | Glycosyl hydrolase superfamily protein | 20.22 | − | − |
| At4g12720 | NUDT7 | Nudix hydrolase homolog7 | 12.29 | − | − |
| At4g14630 | GLP9 | Germin-like protein9 | 9.03 | + | − |
| At3g23250 | MYB15 | MYB transcription factor15 | 8.38 | − | − |
| At5g54230 | MYB49 | MYB transcription factor49 | 7.96 | − | − |
| At5g62520 | SRO5 | Similar to RCD One5 | 7.61 | + | − |
| At1g25220 | ASB1 | Anthranilate synthase β-subunit1 | 5.04 | − | − |
| At1g02920 | GSTF7 | Glutathione S-transferase ϕ7 | 4.89 | + | − |
| At3g02140 | TMAC2 | Two or more ABREs-containing gene2 | 4.69 | − | − |
| At4g05100 | MYB74 | MYB transcription factor74 | 4.22 | − | − |
| At5g39610 | NAC6 | NAC domain transcription factor6 | 4.10 | − | + |
| At5g07440 | GDH2 | Glu dehydrogenase2 | 3.96 | − | − |
| At1g48000 | MYB112 | MYB transcription factor112 | 3.90 | + | + |
| At1g03220 | – | Eukaryotic aspartyl protease family protein | 3.60 | − | + |
| At1g28380 | NSL1 | Necrotic spotted lesions1 | 3.39 | + | + |
| At1g55450 | – | S-Adenosyl-l-Met-dependent methyltransferase superfamily protein | 3.36 | + | − |
| At3g25780 | AOC3 | Allene oxide cyclase3 | 3.18 | + | − |
| At3g57530 | CPK32 | Calcium-dependent protein kinase32 | 3.17 | + | + |
| At3g44540 | FAR4 | Fatty acid reductase4 | 3.16 | + | − |
| At4g21440 | MYB102 | MYB transcription factor102 | 3.14 | + | − |
| At1g03230 | – | Eukaryotic aspartyl protease family protein | 3.11 | − | − |
| At5g02020 | SIS | Salt-induced Ser rich | 3.07 | − | − |
| At5g67480 | BT4 | BTB and TAZ domain protein4 | 3.07 | +++ | − |
| At4g08500 | MEKK1 | MAPK/ERK kinase kinase1 | 2.82 | +++ | − |
| At3g48360 | BT2 | BTB and TAZ domain protein2 | 2.78 | ++ | − |
| At3g21780 | UGT71B6 | UDP-glucosyltransferase71B6 | 2.77 | ++ | − |
| At2g47730 | GSTF8 | Glutathione S-transferase ϕ8 | 2.68 | ++ | + |
| At5g44610 | MAP18 | Microtubule-associated protein18 | 2.53 | +++ | − |
| At5g43170 | ZF3 | Zinc finger protein3 | 2.35 | +++ | − |
| At4g37530 | – | Peroxidase superfamily protein | 2.26 | ++ | + |
| At4g02520 | GSTF2 | Glutathione S-transferase ϕ2 | 2.23 | +++ | − |
| At2g38380 | – | Peroxidase superfamily protein | 2.20 | ++ | + |
| At1g18570 | MYB51 | MYB transcription factor51 | 2.17 | ++ | + |
| At1g01140 | CIPK9 | CBL-interacting protein kinase9 | 2.15 | +++ | − |
| At5g67450 | ZF1 | Zinc finger protein1 | 2.10 | − | − |
| At1g50460 | HKL1 | Hexokinase-like1 | 2.09 | + | − |
| At5g24470 | VSP2 | Vegetative storage protein2 | 2.03 | + | − |
| Heat stress only | |||||
| At5g52640 | HSP90.1 | Heat shock protein90.1 | 8.61 | +++ | − |
| At5g51440 | – | HSP20-like chaperones superfamily protein | 8.49 | ++ | − |
| At5g57560 | XTH22 | Xyloglucan endotransglucosylase/hydrolase22 | 7.76 | − | + |
| At3g12580 | HSP70 | Heat shock protein70 | 7.47 | + | + |
| At5g03720 | HSFA3 | Heat shock factor A3 | 6.19 | + | − |
| At4g12400 | HOP3 | Carboxylate clamp-tetratricopeptide repeat proteins | 5.80 | ++ | − |
| At4g25200 | HSP23.6-MITO | Mitochondrion-localized small heat shock protein23.6 | 5.12 | + | − |
| At1g74310 | HSP101 | Heat shock protein101 | 4.99 | ++ | − |
| At1g07400 | – | HSP20-like chaperone superfamily protein | 4.65 | + | − |
| At5g07100 | WRKY26 | WRKY DNA-binding protein26 | 3.92 | + | + |
| At3g63350 | ATHSFA7B | Heat shock factor A7B | 3.81 | + | − |
| At5g47910 | RBOHD | NADPH/respiratory burst oxidase protein D | 3.41 | − | + |
| At1g21910 | DREB26 | Dehydration response element-binding protein26 | 3.29 | + | − |
| At3g08970 | TMS1 | Thermosensitive male sterile1 | 2.93 | − | ++ |
| At1g53540 | – | HSP20-like chaperone superfamily protein | 2.78 | + | + |
| At3g51910 | HSFA7A | Heat shock factor A7A | 2.74 | + | − |
| At2g26150 | HSFA2 | Heat shock factor A2 | 2.71 | + | − |
| At1g56410 | ERD2 | Early response to dehydration2 | 2.67 | + | − |
| At5g 12030 | HSP17.6A | Heat shock protein17.6A | 2.43 | − | + |
| At4g17250 | – | Heat acclimation | 2.33 | ++ | − |
| At5g37770 | CML24 | Calmodulin-like24 | 2.07 | + | − |
DRE (G/ACCGAC) or GCC (GCCGCC) in the 3,000-bp upstream region from the 5′ end of the longest complementary DNA. b–, Not applicable.
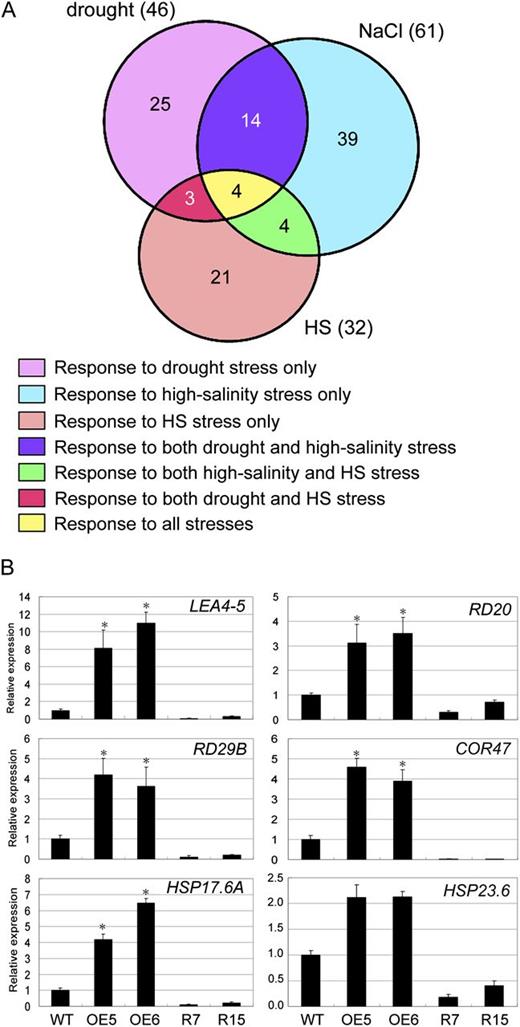
Venn diagram and validation of selected microarray data. A, Venn diagram representing the distribution of drought-, high salinity-, and heat shock (HS)-responsive ERF1 up-regulated genes. The numbers in parentheses indicate total numbers of ERF1 up-regulated genes that showed expression ratios > 2 in the microarray analysis of drought, high salinity, and heat shock stress responses. B, Expression analysis of ERF1 up-regulated genes in the 35S:ERF1 plants. Total RNA was prepared from 3-week-old Arabidopsis plants from one line of Col-0, two independent 35S:ERF1 lines, and two independent ERF1 RNAi lines, R7 and R15. The relative mRNA amount of ERF1 up-regulated genes was analyzed by qRT-PCR (the expression level of Col-0 was set to 1). Data represent means and se of three replications. Error bars indicate se (Student’s t test; *P < 0.01). WT, Wild type.
35S:ERF1 Activates Heat Shock Genes and Exhibits Heat Shock Stress Tolerance
Surprisingly, 32 heat stress-related genes were among the ERF1 up-regulated genes. These included AtHsfA3, which encodes a transcription factor involved in heat shock-inducible gene expression, mitochondria-localized small HSP23.6 (HSP23.6-M; At5g51440), DnaJ-like protein (At1g72070), HSP70 (At3g12580), and HSP17.6A (At5g12030), all of which likely function in heat shock resistance. These results suggest that ERF1 functions not only in drought- and salt stress-responsive gene expression but also in heat shock. To understand if ERF1 directly activated these genes, we searched for GCC boxes in the 1-kb promoter regions of these genes using PlantCARE (http://bioinformatics.psb.ugent.be/webtools/plantcare/html/). However, most of the downstream genes did not have GCC boxes but had the DRE element in their promoters (Table I), indicating that ERF1 may bind to the DRE element.
We were nonetheless interested to determine whether 35S:ERF1 plants had improved heat tolerance. Seven-day-old vector control and transgenic plants were germinated at 22°C on filter paper premoistened by liquid germination medium and then subjected to heat stress treatment at 45°C. Only 7% of the vector control plants survived 3 d after recovery from heat stress, whereas half of the 35S:ERF1 plants survived. These results clearly indicate augmented thermotolerance of the 35S:ERF1 plants (Fig. 8).
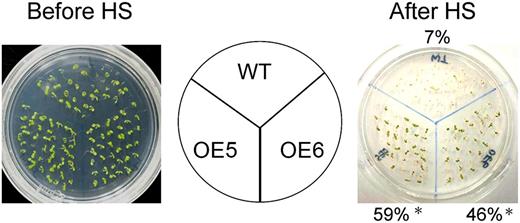
Heat shock stress tolerance of the 35S:ERF1 and wild-type (WT) plants. One-week-old seedlings of wild-type or 35S:ERF1 (OE5 and OE6) plants were incubated at 45°C for 1 h. After heat stress treatment (HS), plants were grown under normal conditions for 1 week. Percentages of surviving plants are indicated. More than 30 plants were used per test, and each test was repeated three times. Error bars indicate se (Student’s t test; *P < 0.005).
ERF1 Binds to Specific GCC Box and DRE Elements of Subsets of Stress-Responsive Genes Up-Regulated in Response to Different Stress Signals
To investigate whether ERF1 directly regulates abiotic stress-responsive genes, we searched for a common cis-acting element presented in the promoters of ERF1 up-regulated genes. The DRE contains the core sequence A/GCCGAC and has been identified as a cis-acting promoter element regulating gene expression in response to drought, salt, and cold stresses in Arabidopsis (Hao et al., 2002; Sakuma et al., 2002). Many of the ERF1 up-regulated genes contained DRE elements in their promoter regions. Electrophoretic mobility shift assays using ERF1-GFP fusion protein purified from Arabidopsis transgenic plants showed that the ERF1 protein bound specifically to the DRE element of the RD29B gene promoter (Supplemental Fig. S2). The GFP protein alone did not bind. ERF1 binding was significantly reduced in the presence of excess unlabeled probes, but DNA fragments with a mutated DRE were less efficient in competing for ERF1 binding, consistent with specific binding of ERF1 to the DRE element.
Nucleotide sequence analysis revealed that the promoters of the ERF1 downstream genes contained GCC box and DRE sequence motifs (Supplemental Fig. S3). ChIP assays were employed to examine whether the ERF1 protein binds to the gene promoters using 35S:ERF1-GFP transgenic plants in which a GFP-coding sequence was fused in frame to the 3′ end of the ERF1 gene. The chromatin solution was sonicated to shear the DNA into approximately 500-bp fragments (Supplemental Fig. S4). Quantitative real-time ChIP-PCR assays using an anti-GFP antibody showed that ERF1 binds to the GCC box or DRE in the gene promoters in normal unstressed conditions (Supplemental Fig. S5). We also performed ChIP assays to examine ERF1 promoter binding under different abiotic stress conditions, including drought, salt, and heat shock. Primers to amplify GCC box- or DRE-containing promoter fragments were designed for the JA-responsive genes b-CHI, PDF1.2, ELI3-2, and GSTF7; the drought-responsive genes LEA4-5, KIN2, GEA6, and At3g02480; the salt-responsive genes P5CS1, SRO5, GLP9, and ATOSM34; and the heat shock-responsive genes ATHSFA3, HSP101, HSP70, and HSP23.6-M, according to Supplemental Figure S5 (Fig. 9A). ChIP assays demonstrated stress-specific ERF1 binding to DRE elements in the promoters of drought stress-responsive genes (LEA4-5, KIN2, GEA6, and At3g02480) under drought stress treatment (Fig. 9B). Moreover, ERF1 also bound to the DRE element in the promoters of salt-responsive (P5CS1, SRO5, GLP9, and ATOSM34) and heat shock-responsive (ATHSFA3, HSP101, HSP70, and HSP23.6-M) genes in a salt- or heat shock-specific manner (Fig. 9B). ERF1 also bound the GCC box in the promoters of JA-responsive genes (b-CHI, PDF1.2, ELI3-2, and GSTF7; Fig. 9B). ChIP assays showing a lack of ERF1 binding to other promoter regions not containing the GCC box or DRE demonstrated the specificity of the ChIP assays (Supplemental Fig. S6). For the genes that were up-regulated in both drought and high salinity, such as RD29B, ERD7, and RD20, we observed ERF1 binding to DRE elements of their promoters under both stresses (Supplemental Fig. S7). Interestingly, ERF1 bound to the promoters of nearly all of these genes under normal growth conditions (Fig. 9B). This indicated that there was stress-specific recruitment or blocking of some genes that led to different patterns of ERF1 binding in different stresses.
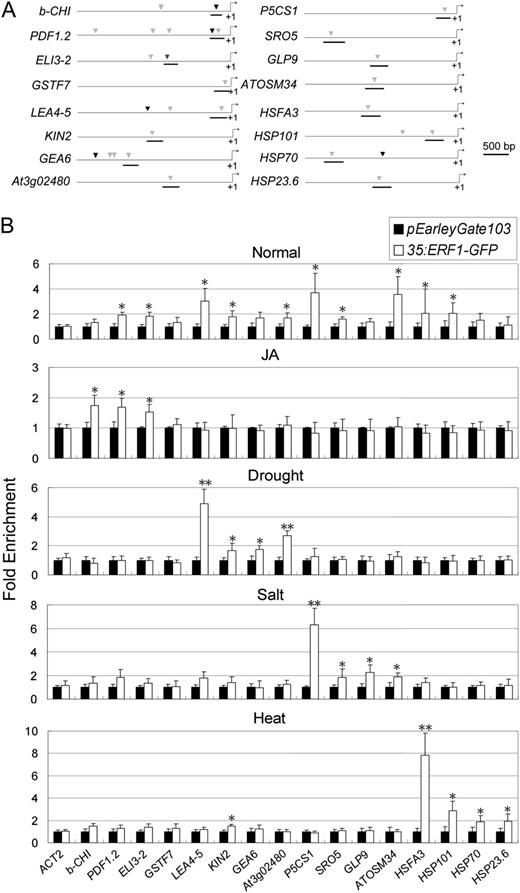
ERF1 binding affinity to the DRE element and the GCC box in selected ERF1 stress-responsive downstream gene promoters. A, In the downstream gene promoters, the sequence regions used for ChIP assays are marked. Black marks, GCC box; gray marks, DRE elements. B, ChIP assays. Fragments showing significant enrichment are underlined. For ChIP assays, 3-week-old 35S:ERF1-GFP transgenic plants under normal conditions (Normal), treated with 1 h of 50 μm JA (JA), 30 min of dehydration (Drought), 1 h of 150 mm NaCl (Salt), or 1 h of heat shock stress (45°C; Heat) were used. Three measurements were averaged for individual assays. The values in Col-0 plants were set to 1 after normalization against ACT2 for qRT-PCR analysis. Error bars indicate se (Student’s t test; *P < 0.05, **P < 0.01).
Among the ERF1-regulated genes, some have both GCC box and DRE elements in their promoter, and some of them possess more than one DRE element. To investigate the ERF1 binding preferences of GCC boxes and DRE elements present in the same promoter, primers were designed to specifically amplify GCC boxes and DRE elements from the promoters of b-CHI, PDF1.2, ELI3-2, GEA6, LEA4-5, and HSP70 (Supplemental Fig. S8A). These assays showed that ERF1 preferentially binds to the GCC box in promoters of JA-responsive genes (b-CHI, PDF1.2, and ELI3-2; Supplemental Fig. S8B). Conversely, ERF1 preferentially bound DRE elements in the promoters of drought-responsive genes (GEA6 and LEA4-5) as well as the heat shock-responsive gene HSP70 (Supplemental Fig. S8, C and D). These results indicated that ERF1 preferentially bound to GCC boxes in the promoters of biotic stress-responsive genes and preferentially bound to DRE element promoters of abiotic stress-responsive genes. In cases where multiple DRE elements were present in the same promoter (RD20, RD29B, COR15B, COR47, and HSP101), ERF1 bound specifically to only one of the DRE elements (Supplemental Fig. S9, B and C). ERF1 binding usually occurred at the DRE element nearest to the 5′ transcriptional initiation site of the target gene. An exception to this trend was COR15B, where ERF1 specifically bound the DRE second closest to the start site (Supplemental Fig. S9).
DISCUSSION
ERF1 has been proposed to regulate Arabidopsis resistance to the necrotrophic fungi B. cinerea and P. cucumerina by integrating ET and JA defense responses (Berrocal-Lobo et al., 2002; Lorenzo et al., 2003). Although ERF1 has been reported to be induced by salt stress and its expression was altered in a salt-sensitive mutant (Cela et al., 2011), no significant evidence has been provided for its role in abiotic stress. Emerging evidence suggests that hormone signaling pathways regulated by ABA, salicylic acid, JA, and ET, as well as reactive oxygen species signaling pathways, play key roles in the cross talk between biotic and abiotic stress signaling. Several factors, including transcription factors and kinases, may be common players that are involved in cross talk between stress signaling pathways. Several novel observations presented here shed new light on the role of ERF1. We discovered a novel function of ERF1 positive regulation of both biotic and abiotic stress responses, such as drought, salinity, and heat shock stress, by binding to different cis-elements (DRE element or GCC box) in response to different stress signals. Along with the expression pattern of ERF1 and stress resistance phenotypes of ERF1 overexpression plants, these data suggest that ERF1 may act as a master integrator between biotic and abiotic stress signals.
Stress-Specific Binding of ERF1 to GCC Box and DRE Promoter Elements Is a Mechanism to Control the Cross Talk of Different Stress Signals
There are 147 AP2/ERF transcription factors in the Arabidopsis genome, which can be divided into four subfamilies, of which DREB and ERF members account for over 85% of the whole family (Sakuma et al., 2002; Feng et al., 2005; Nakano et al., 2006). Members of different subfamilies were reported to display distinct DNA-binding activities. For example, several ERF proteins bind to the GCC box AGCCGCC (Ohme-Takagi and Shinshi, 1995; Hao et al., 1998; Fujimoto et al., 2000; Hao et al., 2002), some proteins of the DREB subfamily bind the DRE or the C-repeat element as defined by A/GCCGAC consensus (Baker et al., 1994; Yamaguchi-Shinozaki and Shinozaki, 1994; Stockinger et al., 1997; Thomashow, 1999; Hao et al., 2002; Sakuma et al., 2002), and some ERFs can bind both GCC box and DRE elements (Gong et al., 2008). ERF1 was known to specifically bind GCC boxes in the promoter regions of PDF1.2 and b-CHI genes (Solano et al., 1998). However, to our knowledge, the binding of ERF1 to DRE elements has not been reported previously. Here, using electrophoretic mobility shift assay and ChIP, we demonstrated that ERF1 specifically binds DRE elements and GCC boxes in a precise stress-specific manner. Interestingly, ERF1 binds to the GCC boxes in the promoters of JA-responsive genes but mostly binds to the DRE elements in the promoters of abiotic stress-responsive genes. Moreover, the binding affinity of ERF1 to the DRE elements, especially in the promoters of LEA4-5, P5CS1, and HSFA3, was much greater than to the GCC box in the promoters of b-CHI, PDF1.2, ELI3-2, and GSTF7, suggesting that ERF1 played a more important role in the abiotic stress response.
In our ChIP assay, 500-bp resolution might not be enough to distinguish the cis-acting elements existing closely. A DRE/CRT near the GCC box in the promoter of PDF1.2 represents one example. In this case, however, analyses have been done in several papers to show indeed that ERF1 binds to the GCC box. The same GCC box close to the transcription starting site of ERF1 was mutated, and protoplast assay indicated that the transactivation was greatly reduced, and this GCC box is the main site interacting with ERF1 (Zarei et al., 2011). In the same report, electrophoretic mobility shift assay was also carried out to confirm that this GCC box in the PDF1.2 promoter is the main binding site for ERF1. Brown et al. (2003) also observed a much lower response to JA when the GCC box region was deleted or mutated. Based on these reports, we conclude that ERF1 binds to the GCC box.
Our data raise the question of how this stress-specific binding is achieved. Possible explanations for this specific binding include the recruitment of ERF1 to specific cis-elements by interacting protein(s), the presence of other promoter-binding proteins or alterations in chromatin structure that prevent ERF1 binding to GCC boxes or DRE elements other than the stress-specific site, or modification of ERF1 itself that alters its DNA binding or interaction with other promoter-binding proteins. Interestingly, under nonstress conditions, ERF1 could bind to all of these genes (Fig. 9), but that binding is enriched in some genes under specific stress conditions. This, in turn, suggests the even if ERF1 is recruited to certain promoter elements under specific stress conditions, there are also likely to be mechanisms that prevent off-target binding. Signaling cross talk is an often discussed idea in plant stress biology, with a sometimes confusing pattern of the same molecular players having many stress signaling roles. Our data indicate one way in which such signaling cross talk may be managed to allow the same transcription factor to have distinct roles in biotic and abiotic stress (Fig. 10). We believe that this type of mechanism may be relevant to other transcription factors that influence multiple stress responses.
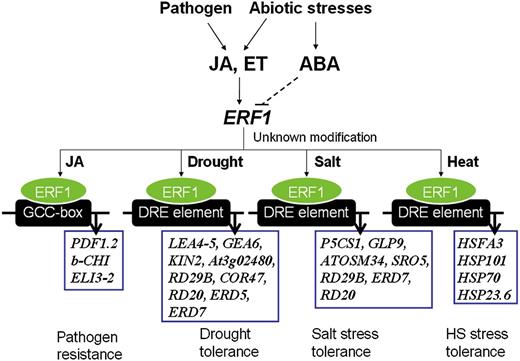
Proposed model of ERF1 function in the regulation of biotic stress- and abiotic stress-responsive gene expression. ERF1 positively regulates both biotic and abiotic stress responses. ERF1 induction required both ET and JA signaling under abiotic stress and was negatively regulated by ABA. It is not clear if the negative effect of ABA on ERF1 expression resulted from a direct effect or indirectly through affecting JA-ET signaling (dashed line). Under different stress conditions, such as pathogen infection, dehydration, high salinity, and heat shock, ERF1 activates specific sets of stress response genes by targeting to specific cis-elements (GCC boxes during biotic stress and DRE elements during abiotic stress). The factors controlling the stress-specific promoter targeting of ERF1 remain unknown.
ERF1 Promotes Stress Tolerance via Multiple Mechanisms
There are several possible physiological mechanisms to explain why 35S:ERF1 exhibited enhanced drought and salt stress resistance. First, the stomata of 35S:ERF1 plants had smaller guard cell apertures and reduced transpiration compared with wild-type plants. This meant that they could better avoid dehydration when soil water became limiting. Second, 35S:ERF1 had enhanced expression of many genes related to stress tolerance, which likely all contributed incrementally to the phenotype. Interestingly, 35S:ERF1 plants accumulated more Pro than wild-type plants under normal growth conditions. The accumulation of Pro in plant cells can protect the cells from stress via multiple mechanisms (Szabados and Savouré, 2010; Verslues and Sharma, 2010; Sharma et al., 2011). The expression level of P5CS1 (the key enzyme involved in Pro synthesis) in 35S:ERF1 was greater than that in wild-type plants, which might suggest that altered Pro metabolism was one contributor to the enhanced stress resistance caused by ERF1 overexpression. Sharma and Verslues (2010) have reported that induction of P5CS1 at low water potential was partially ABA independent. Our data suggest that ERF1 is a major ABA-independent factor regulating P5CS1 expression. Moreover, CPK6 was more highly expressed in our microarray analysis of 35S:ERF1 and has been reported previously to promote Pro accumulation (Mori et al., 2006).
It was reported previously that overexpression of ERF1 did not enhance the salt tolerance of seed germination and seedling growth at 100 mm NaCl. This was consistent with our results; however, we found that ERF1 overexpression did enhance tolerance to more severe (150 mm) salt stress. The different phenotype is consistent with the observation that ERF1 expression was barely induced by 100 mm NaCl (Zhang et al., 2011) but was induced more than 7-fold by more severe salt stress (150–300 mm NaCl). It is possible that 100 mm NaCl was not sufficient to turn on some posttranscriptional or posttranslational modification of ERF1 required for its stress function and promoter targeting. It should also be noted that our data differed from the results of Ellouzi et al. (2013) and Asensi-Fabado et al. (2012), who showed that ERF1 was strongly down-regulated at 72 h and had the same level as the wild type at 15 d of salt stress treatment. Likely, this is because of the different developmental stages and stress time periods used in their studies. As ERF1 is a transcription factor that responds quickly after receiving biotic and abiotic stress signals, we think that it is more proper to analyze its induction within a short time period (minutes or several hours). In agreement with our data, Ellouzi et al. (2013) also found that the ABA-deficient vte4 mutant had higher ERF1 expression under salt stress.
Although ERF1 RNAi plants exhibited lower germination rates and slightly more inhibited root elongation under salt stress, they failed to confer a more sensitive phenotype in our drought and salt stress tolerance tests. Under normal conditions, RNAi lines also accumulated lower Pro levels compared with wild-type plants, consistent with the lower expression of P5CS1. This means that down-regulation of ERF1 substantially conferred a lower stress response to some extent but did not fully repress downstream gene expression. The leaky expression of ERF1 might result in leaky protein production and, thus, turn on some of the downstream genes and might also interact with other cofactors involved in the stress response. Another possible reason is the functional redundancy of its closest homolog genes, ERF15 (At2g31230) and ERF94 (At1g01610), which might play similar roles in abiotic stress to ERF1. In our RNAi lines, ERF1 expression was repressed to about 20% to 30%, whereas both ERF15 and ERF94 remained about the same as in the wild type (Supplemental Fig. S10). Moreover, ERF1 RNAi plants failed to exhibit larger stomatal aperture compared with wild-type plants, for stomatal closure might be controlled by a group of factors instead of a single gene.
Interestingly, 35S:ERF1 plants had altered stomatal aperture and stomatal closure, even though ERF1 is not normally expressed in stomata (Supplemental Fig. S11). This may be caused by ectopic expression of ERF1 from the 35S promoter. Alternatively, it could suggest that ERF1 can regulate stomatal closure indirectly. It is known that methyl jasmonate (MeJA) as well as ABA stimulates stomatal closure in many plant species (Gehring et al., 1997; Saito et al., 2008; Islam et al., 2009). MeJA recruits many ABA signaling components to induce stomatal closure, including the NAD(P)H oxidases AtrbohD and AtrbohF (Suhita et al., 2004), the Snf-related protein kinase OST1 (Suhita et al., 2004), the protein phosphatases 2C ABI1 and ABI2 (Munemasa et al., 2007), a regulatory subunit of protein phosphatase 2A, RCN1 (Saito et al., 2008), and the myrosinase TGG (Islam et al., 2009), suggesting that MeJA signaling is overlapped with ABA signaling in guard cells. As a downstream component of JA signaling, overexpression of ERF1 might enhance the signal of JA and indirectly affect stomatal aperture. Several components to induce stomatal closure are also found in our microarray data, such as RBOHD and CIPK18.
ERF1 Expression Is Controlled by an Interaction of JA, ET, and ABA Signaling
Defense- and stress-responsive gene expression in response to biotic and abiotic stresses are modulated by the antagonistic interactions between multiple components of ABA and the JA-ET signaling pathways (Anderson et al., 2004). Our data revealed that the salt stress induction of ERF1 expression was enhanced by ET and JA signaling and suppressed by ABA treatment and in abi1 and abi2 knockout mutants. These findings suggest that ERF1 expression is controlled by an interaction of JA, ET, and ABA signaling. In addition to the well-known ABA accumulation induced by abiotic stress, ET production is induced by various types of stress, including drought and high salinity in plants (Morgan and Drew, 1997; Yoo et al., 2009), and JA accumulation can also be induced by drought stress in soybean (Glycine max) leaf (Creelman and Mullet, 1995). Under salt/dehydration stress, in our experiments, ERF1 expression was induced, suggesting that during stress JA/ET signaling can override the negative effect of ABA on ERF1 expression. ABA production, however, was highly induced in response to drought and salt stress. The expression of ERF1 probably resulted from the different tissue-specific location of ABA and ET biosynthesis. The expression of AtNCEDs, AtABA2, and AAO3 genes required for ABA synthesis in the turgid tissues and under drought stress was detected in vascular parenchyma cells (Tan et al., 2003; Koiwai et al., 2004; Endo et al., 2008), while ACS2, ACS4, ACS5, and ACS7 participating in ET synthesis were detected in leaf tissues (Rodrigues-Pousada et al., 1993; Wang et al., 2005). Consistent with this, our GUS staining results revealed that ERF1 was induced in leaves but not in petioles and veins or vascular bundles under salt stress treatment, together with ERF1 expression in the JA and ET mutants under salt stress, suggesting that the salt induction of ERF1 was mainly transduced by ET and JA signaling. Lorenzo et al. (2003) reported that both ET and JA signaling pathways are required simultaneously to activate ERF1. In agreement with this, our results of ET and JA mutants under salt stress support the idea that both ET and JA affect ERF1 expression. This specific expression may also play a role. For example, GUS activity was detected in petioles under JA treatment but in leaves under salt stress treatment (Fig. 1C), suggesting that ERF1 might play roles in distinct areas under biotic and abiotic stresses.
Intriguingly, ABA accumulation, however, was greater in ERF1 overexpression lines than in wild-type plants in nonstress conditions, whereas RNAi lines had lower or about the same level of ABA. This is probably because both NCED2 and NCED9, involved in ABA synthesis, were up-regulated in our microarray analysis. This might also explain why overexpression plants accumulated higher Pro levels and exhibited smaller stomatal aperture. However, ABA contents in these lines grown under control conditions are still at low concentration, which is very different from the ABA content under stress conditions. Despite the possibility of a feedback regulation of ABA production by ERF1, endogenous ABA content does not necessarily affect ERF1 expression under normal conditions for the low concentration of ABA or a stable expression regulated by JA-ET signaling. At present, it is not clear whether the negative effect of ABA on ERF1 expression resulted from a direct effect or indirectly by affecting JA-ET signaling.
In our microarray analysis, we identified many up-regulated genes that have physiological functions related to biotic and abiotic stresses. ELI3-2, ADR1, RBOHD, and EDS1 were reported to have positive effects in resisting pathogen infection (Azevedo et al., 2006). DREB2A, COR47, RD29B, RD20, KIN2, ANAC055, CPK6, RPK1, and ADR1 were reported to play roles in drought tolerance (Chini et al., 2004; Tran et al., 2004; Sakuma et al., 2006; Osakabe et al., 2010; Xu et al., 2010). CPK6 and WRKY25 could confer salt stress tolerance (Jiang and Deyholos, 2008; Xu et al., 2010). The expression of these genes was also significantly reduced in our ERF1 RNAi lines. All of these genes may contribute incrementally to the stress resistance phenotypes caused by ERF1 overexpression. Moreover, transcription factors WRKY18, WRKY25, and ANAC055 were highly induced in 35S:ERF1 and conferred salt/dehydration tolerance when overexpressed (Tran et al., 2004; Jiang and Deyholos, 2008; Li et al., 2009; Pandey et al., 2010). Known downstream genes of WRKY18, WRKY25, and ANAC055 that we found to be up-regulated in 35S:ERF1 are listed in Supplemental Table S1. The overall data support ERF1 as a central regulator of a gene expression network contributing to the tolerance of both biotic and abiotic stress.
ERF1 had a substantial role in heat stress tolerance, even though the expression of ERF1 was less induced by heat stress than by other stress treatments. Despite this observation that heat stress was not a major regulator of ERF1 expression, many heat shock-related genes, such as AtHsfA3 and HSPs, were up-regulated by ERF1 overexpression and less expressed in ERF1 RNAi plants (Fig. 7; Supplemental Table S1). Consistent with this gene expression pattern, we also found that the 35S:ERF1 plants showed enhanced thermotolerance. Taking these data together with our ChIP data, we can hypothesize that it may be the heat stress-specific recruitment of ERF1 to the promoters of heat stress related-genes, rather than an increase in the bulk level of ERF1 expression, that is the basis for the role of ERF1 in heat stress tolerance. In this case, a next interesting question is what factors may be involved in the stress-specific promoter recruitment of ERF1. One possibility is MEDIATOR SUBUNIT25 (MED25), which could regulate JA and ABA signaling by interacting with ERF1, MYC2, MYC2, and ABI5 (Çevik et al., 2012; Chen et al., 2012); MED25 was also reported to regulate abiotic stresses such as drought and salt through interacting with DREB2A (Elfving et al., 2011). Whether MED25 or some other part of the transcriptional regulatory complex present on stress gene promoters acts as an signaling integrator controlling stress-specific promoter recruitment of ERF1 is a topic of interest for further investigation.
MATERIALS AND METHODS
Plant Materials and Transgenic Plant Construction
We screened the seed pool of the Arabidopsis (Arabidopsis thaliana) AtTORF-EX library that carried ERF gene overexpression (Weiste et al., 2007) by withholding water from 2-week-old wild-type and overexpression plants for 2 weeks and looking for plants that could survive after rewatering. For further study of ERF1 (At3g23240) promoter:GUS fusions, 35S:ERF1, ERF1-RNAi, and 35S:ERF1-GFP-His transgenic lines were constructed in the Columbia (Col-0) ecotype of Arabidopsis. The promoter of ERF1 was amplified from Col-0 by the primer pair 5′-AAGTTTAATTGGAATAGCAAG-3′ and 5′-GTGGTTATGAAATATTTTCCCCAC-3′ and inserted into pKGWFS7 to generate the ERF1 promoter:GUS construct. The ERF1 coding sequence was amplified by the primer pair 5′-ATGGCTACTGCTAAGAACAAGGG-3′ and 5′-AATTGTATCAGAAGAAGAGT-3′ and inserted into pB2GW7 and pEarleyGate103 to generate 35S:ERF1 and 35S:ERF1-GFP-His transgenic plants, respectively. The 50-bp RNAi fragment was amplified from the ERF1 coding sequence by the primer pair 5′-ATTACTCTCTTCCCTTCAACGAGAACGACTCAGAG-3′ and 5′-GTAGAGAAACATTTCCTCTGAGTCGTTCTCGTTGA-3′ and then was inserted into pB7GWIWG2(II),0 to generate the ERF1 RNAi construct. These plasmids were introduced into Agrobacterium tumefaciens GV3101 cells, and Arabidopsis transformation was performed by the floral dip method. To isolate transgenic plants, seeds were sown in a 2:2:1 mixture of vermiculite, perlite, and peat moss, incubated in the dark for 2 to 4 d at 4°C, and transferred to a growth chamber for germination. The 35S:ERF1, 35S:ERF1-GFP-His, and ERF1-RNAi transgenic plants were selected with Basta after 2 weeks of incubation. For the ERF1 promoter:GUS transgenic lines, screening was performed on MS medium (pH 5.6) containing 1% Suc, 0.8% phytoagar, and 50 μmol of kanamycin. Seedlings were grown under a 16/8-h light/dark photoperiod at 22°C at a light intensity of 100 to 150 μmol m−2 s−1.
Histochemical GUS Staining
The GUS expression patterns of either soil-grown transgenic plants or seedlings grown on one-half-strength MS medium were analyzed. The GUS staining solution contained 100 mm sodium phosphate buffer (pH 7.0), 0.5 mg mL−1 5-bromo-4-chloro-3-indolyl β-d-glucuronic acid (Duchefa; http://www.duchefa.com/), 0.1% Triton, and 0.5 mm each of potassium ferricyanide and ferrocyanide. Samples were vacuum infiltrated for 15 to 30 min and incubated at 37°C for 16 to 24 h. After staining, plant tissues were then fixed in 4% formaldehyde, 50% ethanol, and 5% acetic acid, dehydrated in an ethanol series, and infiltrated with Histo-Clear (International Diagnostics) followed by paraffin. Observation was conducted with a light microscope (MZ16F; Leica), an RS Photometrics CoolSNAP camera (DFC490; Leica), and IM50 software.
Drought and Salt Stress Tolerance Tests and Water Loss Measurements
For the drought tolerance test, plants were initially grown in soil under a normal watering regime for 3 weeks. Watering was then halted, and observations were made after a further 10 to 12 d without water. When wild-type plants exhibited lethal effects of dehydration, watering was resumed and the plants were allowed to grow for a subsequent 5 d. For the salt tolerance test, 3-week-old plants were watered for 12 d at 4-d intervals with increasing concentrations of NaCl of 100, 200, and 300 mm. Survival was scored by examining the inflorescence base to determine if it still remained green.
For transpiration (water loss) measurements, detached leaves from 5-week-old plants were exposed to room temperature (25°C). Leaves were weighed at various time intervals, and the loss of fresh weight (percentage) was used to indicate water loss.
RNA Isolation and Real-Time qRT-PCR Analysis
Total RNA samples were isolated from various plant tissues with Rezol C&T reagent (PROtech). For reverse transcription-PCR, SuperScript III reverse transcriptase (Invitrogen; http://www.invitrogen.com) was used, following the manufacturer’s instructions. Real-time qRT-PCR was carried out with gene-specific primers (Supplemental Table S2) designed using Vector NTI 9.0 software and KAPA SYBR Premix ExTaq (KAPA Biosystems) with assays run on a Bio-Rad MyiQ. Three independent biological replicates were performed for each experiment.
Observation of the Subcellular Localization of Green Fluorescent Signals
The DNA sequence of GFP fused with the ERF1 coding sequence and the Nos terminator (NosT) of the 35S:GFP-ERF1 plasmid was amplified by PCR and cloned into the pGreenII0029 vector by PstI and SalI sites. The 1.8-kb ERF1 promoter sequence was subsequently inserted in front of sGFP-ERF1-NosT by the PstI site. Transient expression in Arabidopsis protoplasts was analyzed following Jen Shen’s laboratory protocol (Yoo et al., 2007). GFP fluorescence was analyzed by a confocal laser-scanning microscope (LSM5 PASCAL; Zeiss).
Seed Germination and Stomatal Aperture Measurements
Imbibed seeds were cold treated at 4°C in the dark for 3 d and moved to 22°C with a 16/8-h light/dark photoperiod. Germination was defined as 1-mm protrusion of the radicle. For stomatal aperture measurements, epidermal peels were stripped from fully expanded leaves of 5-week-old plants and floated in a solution of 30 mm KCl and 10 mm MES-KOH, pH 6.15, in petri dishes. After incubation for 2.5 h under white light at 22°C to induce stomatal opening, different concentrations of ABA were added. Stomatal apertures were recorded with an Olympus BX51 system microscope and were analyzed using DP-PSW software. Measurements were performed using the free software IMAGEJ 1.36b (Broken Symmetry Software; http://brokensymmetry.com).
Quantification of the Pro Contents and ABA Contents
Four-week-old Arabidopsis plants under normal growth conditions were used for the measurement of Pro contents. The Pro assay was performed as described by Bates et al. (1973) using lyophilized samples of approximately 100 mg of plant material extracted in 2 mL of 3% aqueous sulfosalicylic acid. A total of 500 μL of filtrate was reacted with 2 mL of ninhydrin and 500 μL of glacial acetic acid in a test tube for 1 h at 100°C, and the reaction was terminated in an ice bath. The reaction mixture was extracted with 1 mL of toluene and mixed vigorously with a test tube stirrer for 15 to 20 s. The chromophore containing toluene was aspirated from the aqueous phase, warmed to room temperature, and the absorbance was read at 520 nm using toluene for a blank. The Pro concentration was determined from a standard curve and calculated on a fresh weight basis as follows: [(μg Pro mL−1 × mL toluene)/115.5 μg μmol−1]/[(g sample)/5] = μmol Pro g−1 fresh weight material.
For ABA quantification, lyophilized samples of approximately 100 mg of whole seedlings were homogenized with 1 mL of 80% acetone and 20% water (v/v) containing 1% (v/v) acetic acid in a 2-mL round-bottom tube. The homogenate was incubated for 48 h at 4°C in darkness at 200 rpm. A total of 300 μL of the supernatant was dried under vacuum. Following resuspension in 1 mL of 50% methanol (v/v) and 0.1 m NH4H2PO4 by vortexing, samples were purified by polyvinylpolypyrrolidone (Sigma-Aldrich) and a C18 column (Sep-Pak Vac 3-cc [500-mg] C18 Cartridges; Waters). After washing with 4 mL of 20% methanol and 2% acetic acid, ABA was eluted by 4 mL of 55% methanol and 2% acetic acid. One milliliter of eluate was vacuum dried and resuspend in 200 μL of standard Tris-buffered saline buffer. ABA in these extracts was quantified using the Phytodetek ABA ELISA kit (Agdia) according to the manufacturer’s instructions. The assay principle uses the competitive antibody-binding method to measure concentrations of ABA in plant extracts.
Heat Shock Tolerance Test
Arabidopsis seeds were germinated and grown on MS medium in 90-mm plastic petri dishes incubated at 22°C. Twenty-five to 30 seeds were sown for each experiment, and seedlings that germinated within 7 d after sowing were subjected to the heat shock tolerance test. The plate was sealed with plastic electric tape and submerged in a water bath at the indicated temperature for 1 h. After heat shock treatment, plants were grown under normal conditions for 1 week, and the number of surviving plants was counted.
Microarray Analysis
Three independent biological replicates of microarray experiments were performed using 4-week-old wild-type and ERF1 overexpression plants grown under normal conditions. Total RNA was isolated from the rosette leaves using Rezol C&T reagent (PROtech). One microgram of total RNA was amplified by a Quick-Amp Labeling kit (Agilent Technologies) and labeled with Cy3 or Cy5 (CyDye; Perkin-Elmer). CyDye-labeled copy RNA (0.825 μg) was fragmented to an average size of about 50 to 100 nucleotides by incubation with fragmentation buffer at 60°C for 30 min. Labeled copy RNA was then pooled and hybridized to the Agilent Arabidopsis V4 Oligo 4×44K Microarray (Agilent Technologies) at 60°C for 17 h. Microarrays were scanned with an Agilent microarray scanner (Agilent Technologies), and scanned images were analyzed by Feature Extraction 9.5.3 software (Agilent Technologies). Normalization and background intensity determination for each feature were performed. Genes exhibiting more than a 2-fold enhanced or reduced transcription level in three independent experiments were considered to show significant alterations in expression, and P values were calculated using the Benjamini and Hochberg method (false discovery rate) using GeneSpring 11 (Agilent Technologies).
Electrophoretic Mobility Shift Assay
Individual synthetic single-stranded DNA molecules corresponding to the 30-bp DRE box fragment 5′-AAAATTTCATGGCCGACCTGCTTTTAAGCT-3′ and its mutant 5′-AAAATTTCATGTCCTACCTGCTTTTAAGCT-3′ (the DRE/CRT elements are underlined) were annealed with their complementary oligonucleotides. The resulting double-stranded oligonucleotides were end labeled with digoxigenin-11-dUTP and purified by phenol extraction and ethanol precipitation. DNA-binding reactions were performed as described (Ohme-Takagi and Shinshi, 1995). Briefly, 0.1 μg each of GFP-ERF1 and GFP protein was added to a total volume of 20 μL in a binding buffer containing 20 mm Tris, pH 8.0, 60 mm KCl, 5 mm MgCl2, 5 mm dithiothreitol, 4% glycerol, 1 μg of polydeoxy(inosinate-cytidylate), and 2 ng of the DRE element digoxigenin-labeled fragments. After being incubated for 15 min, the reaction mixture was analyzed by electrophoresis on 6% polyacrylamide gels prepared in 0.5× Tris-borate-EDTA under nondenaturing conditions. The protein and the probes were then transferred onto a nylon membrane using a semidry transfer unit (Amersham Biosciences), and signals were detected by the chemiluminescent reaction with disodium 3-(4-methoxyspiro{1,2,-dioxetane-3,2′-(5′-chloro)tricyclo[3.3.1.1]decan}-4-yl)phenyl phosphate (Roche).
ChIP Assay
GFP- and ERF1-GFP-overexpressing plants (see above) were used for ChIP assays and are referred to as GFP and ERF1-GFP, respectively. ChIP was conducted as described by Gendrel et al. (2005). Briefly, leaves (1 g) of Arabidopsis plants overexpressing ERF1-GFP and pEarleyGate103-GFP were fixed with 1% formaldehyde at room temperature (25°C) for 10 min with gentle agitation. The chromatin solution was then sonicated to shear the DNA into approximately 500-bp fragments. After centrifugation (13,000g), 300 μL of the supernatant was diluted to 3 mL, and 60 μL of GFP-Trap coupled to magnetic particles (ChromoTek) was added. After incubation at 4°C overnight, the beads were washed and proteins were eluted. The eluates were subjected to digestion with proteinase K (Merck) and RNase. Bound DNA fragments were then extracted using phenol and precipitated with ethanol. The PCR analysis was performed using equal amounts of DNA from the input fractions, washes, and eluates in 42 cycles using amplimers for the DNA fragments (Supplemental Tables S2 and S3).
Supplemental Data
The following materials are available in the online version of this article.
Supplemental Figure S1. Expression levels of P5CS1 in ERF1 transgenic plants.
Supplemental Figure S2. ERF1 binding affinity to DRE/CRT element in the RD29B gene promoter.
Supplemental Figure S3. Location of DRE/CRT element and/or GCC box in ERF1 stress-responsive gene promoters.
Supplemental Figure S4. DNA sonication for ChIP assay.
Supplemental Figure S5. ERF1-binding affinity to DRE/CRT element and GCC box in ERF1 stress-responsive downstream gene promoters.
Supplemental Figure S6. ERF1-binding affinity to regions without DRE/CRT element and GCC box in ERF1 stress-responsive downstream gene promoters.
Supplemental Figure S7. ERF1-binding affinity to DRE/CRT element and GCC box in ERF1 stress-responsive downstream gene promoters.
Supplemental Figure S8. ERF1 binding preferences to DRE/CRT element or GCC box in ERF1 stress-responsive downstream gene promoters.
Supplemental Figure S9. ERF1 binding preferences to DRE/CRT elements in ERF1 stress-responsive downstream genes promoters.
Supplemental Figure S10. Gene expression of ERF15 and ERF94 in ERF1 RNAi transgenic plants.
Supplemental Figure S11. ERF1 promoter-GUS expression in guard cells.
Supplemental Table S1. Downstream genes of WRKY18, WRKY25, and ANAC055 upregulated in the microarray analysis.
Supplemental Table S2. Primers used in the chromatin immunoprecipitation (ChIP) assays.
Supplemental Table S3. Primers used in the chromatin immunoprecipitation (ChIP) assays of promoter regions without the GCC box or DRE.
ACKNOWLEDGMENTS
We thank Prof. W. Dröge-Laser (Universität Würzburg) for kindly providing the seed pool of the Arabidopsis AtTORF-EX library and Paul E. Verslues (Institute of Plant and Microbial Biology, Academia Sinica) for critical editing of the manuscript. We are grateful to the staff of TC5 Bio-Image Tools, Technology Commons, College of Life Science, National Taiwan University for help with the confocal laser scanning microscopy. We also thank Dr. W.-H. Cheng (Academia Sinica) for providing aba2 seeds, and Dr. L.-C. Wang (Academia Sinica) for providing ctr1, etr1, and ein2 seeds.
Glossary
- ET
ethylene
- JA
jasmonate
- ABA
abscisic acid
- RNAi
RNA interference
- ChIP
chromatin immunoprecipitation
- qRT
quantitative reverse transcription
- MS
Murashige and Skoog
- MeJA
methyl jasmonate
- Col-0
Columbia
LITERATURE CITED
Author notes
This work was supported by the National Science Council, Taiwan (grant no. 101–2311–B–002–013–MY2), and National Taiwan University (grant no. 101R892001 to T.-P.L.).
Corresponding author; e-mail [email protected].
The author responsible for distribution of materials integral to the findings presented in this article in accordance with the policy described in the Instructions for Authors (www.plantphysiol.org) is: Tsan-Piao Lin ([email protected]).
The online version of this article contains Web-only data.
Open Access articles can be viewed online without a subscription.
