


Abstract
Root architecture is a major determinant of plant fitness and is under constant modification in response to favorable and unfavorable environmental stimuli. Beyond impacts on the primary root, the environment can alter the position, spacing, density, and length of secondary or lateral roots. Lateral root development is among the best-studied examples of plant organogenesis, yet there are still many unanswered questions about its earliest steps. Among the challenges faced in capturing these first molecular events is the fact that this process occurs in a small number of cells with unpredictable timing. Single-cell sequencing methods afford the opportunity to isolate the specific transcriptional changes occurring in cells undergoing this fate transition. Using this approach, we successfully captured the transcriptomes of initiating lateral root primordia in Arabidopsis thaliana and discovered many upregulated genes associated with this process. We developed a method to selectively repress target gene transcription in the xylem pole pericycle cells where lateral roots originate and demonstrated that the expression of several of these targets is required for normal root development. We also discovered subpopulations of cells in the pericycle and endodermal cell files that respond to lateral root initiation, highlighting the coordination across cell files required for this fate transition.
Introduction
Plants grow new tissues and organs throughout their lives. To enable this iterative body plan, cells must maintain mechanisms of organogenesis, proliferation, and differentiation. Iterative growth of plants is most easily observed aboveground, as plants put out new branches, leaves, and flowers, but equally important is the growth of root systems below the soil. Lateral root development is essential for a plant to remain stably rooted as well as to obtain essential water and nutrients from its surrounding environment. Plants use plasticity in their growth patterns to avoid adverse stimuli and take advantage of favorable ones. In this way, altering root architecture is one of the main mechanisms by which plants can adapt to changing environmental conditions (Khan et al., 2016).

Lateral root development proceeds through three discrete stages: specification, initiation, and emergence. The auxin response exhibits cyclic maxima in the basal meristem, with a periodicity of ∼ 6 h (De Smet et al., 2007). During specification, cells in the meristematic zone of the primary root are specified as competent to form lateral roots if they transit through the basal meristem when the auxin response is high (De Smet et al., 2007). Many other genes oscillate in phase with the auxin response in the basal meristem—these genes may be targets of auxin signaling or independent regulators of specification (Moreno-Risueno et al., 2010). These competent cells then exhibit a sustained auxin maximum in the differentiated zone of the root, termed pre-branch sites (Moreno-Risueno et al., 2010). In Arabidopsis thaliana and most dicot plants, the pericycle cell layer within these pre-branch sites is the cell layer that undergoes lateral root initiation (Beeckman et al., 2001). How this initial transient auxin response is molecularly translated to the sustained auxin response of pre-branch sites leading to initiation is unknown.
The earliest morphological signal of lateral root initiation is the nuclear migration of two longitudinally adjacent pericycle cells to their shared cell wall. These cells subsequently undergo the first anticlinal cell division that initiates lateral root development. GATA TRANSCRIPTION FACTOR 23 (GATA23) is necessary for this nuclear migration to occur (De Rybel et al., 2010). LOB DOMAIN-CONTAINING PROTEIN 16 (LBD16) and LBD29 are two other transcription factor genes shown to play a role in lateral root initiation. These genes are direct targets of AUXIN RESPONSE FACTOR 7 (ARF7) and ARF19, which promote cell division (Okushima et al., 2007). Mutants of these genes exhibit a loss of lateral root initiation, and overexpression of LBD16 rescues the Arabidopsis arf7 arf19 mutant phenotype, which also lacks lateral roots (Goh et al., 2012). Further cell divisions of specific plane orientations and structural changes in cell files exterior to the pericycle allow for lateral root emergence. The emergence process is accompanied by the strong upregulation of cell wall remodelers that are also targets of auxin signaling (Lewis et al., 2013; Ramakrishna et al., 2019) and appears to be the easiest stage of lateral root development to arrest, with many mutants arresting at this stage.
Transcriptomic analyses of lateral root development have been a rich resource for determining key regulators of this developmental process (Vanneste et al., 2005; De Smet et al., 2008; Lewis et al., 2013; Voß et al., 2015; Ramakrishna et al., 2019). Careful temporal staging and analyses of different steps during lateral root formation have led to the identification of novel regulators (Voß et al., 2015), although the complexity of the pathways regulating this process has also become more apparent. Complicating this analysis is the fact that lateral root development is not cell-autonomous, with many different cell types playing different roles and activating diverse genetic networks during this process (De Smet et al., 2007; Marhavý et al., 2013; Vermeer et al., 2014; Porco et al., 2016). Cell sorting analyses of lateral root development have not been done to parse tissue-specific signals, likely because the regions of the root undergoing this fate transition are prohibitively small for such analyses. Single-cell RNA sequencing (RNA-seq) is an alternative approach to obtain transcriptomes on the level of individual cells that requires much less tissue compared to cell sorting. In plants, single-cell RNA-seq has been used to characterize several plant tissue types, and single-cell analyses of root transcriptomes have identified both previously characterized and novel cell type markers. To date, single-cell analyses of root tissue have focused on gene expression in the primary root, transcriptome changes between hair cells and non-hair cells, endodermal differentiation, and regeneration of the primary root meristem after injury (Efroni et al., 2016; Jean-Baptiste et al., 2019; Ryu et al., 2019; Shulse et al., 2019; Denyer et al., 2019; Shahan et al., 2020).
While the initiation of lateral roots is known to be regulated by auxin, only a handful of specific molecular markers of this fate switch have been identified. One reason for this scarcity of markers may be that for any given primary root, lateral root initiation only occurs in a very small proportion of xylem pole pericycle (XPP) cells, which themselves comprise a very small proportion of the root cells (∼ 5% ; Schmidt et al., 2014). The rarity of lateral root fate transition is further complicated by the pulsatile nature of the auxin signal, making this a highly transient event (Moreno-Risueno et al., 2010). In th is study, to counteract these challenges, we microdissected sections of Arabidopsis roots undergoing gravity-induced lateral root initiation and subjected the resulting protoplasts to single-cell sequencing. Using this approach, we successfully captured cells from all major cell types of the root outside the meristem. Through pseudotime analyses, we found that cells identified as lateral root primordia (LRP) are transcriptionally derived from those identified as XPP cells, which is consistent with the results of previous morphological analysis (Malamy and Benfey, 1997). Differentially expressed gene (DEG) analyses identified many candidate genes that are upregulated in LRP cells as compared to XPP cells. We validated the expression patterns of a subset of these genes using fluorescent reporters. In addition, we developed a CRISPR/dCas9 tool to specifically target the repression of these candidate genes in XPP cells and found that many of these targets shape root architecture. Finally, we were able to harness the single-cell approach to determine how cells surrounding the developing primordium, specifically endodermal cells overlaying and pericycle cells flanking LRPs, are affected by this fate transition.
Results
To examine the developmental transition of lateral root initiation, we used gravistimulation to synchronize the formation of LRP and then dissected the region of interest at two time points and performed single-cell transcriptome analyses. Mechanical or gravitropic bending of primary roots in Arabidopsis causes the accumulation of auxin and the formation of a lateral root at the bend (Figure 1A; De Smet et al., 2007; Ditengou et al., 2008). Under our conditions, wild-type plants had formed a primordium at either Stage I or II by 20 h after gravistimulation (Guseman et al., 2015). As our goal was to identify early regulators of lateral root initiation, we analyzed cells 20-h post-bending, when initiation has just begun, and 8-h post-bending, where there are no morphological signs of lateral root development but transcriptome changes have started (Voß et al., 2015). We included a control treatment group where we did not bend the roots but cut a similar region of the primary root. We microdissected the root bend regions to maximize our yield of the rare cell types of interest.
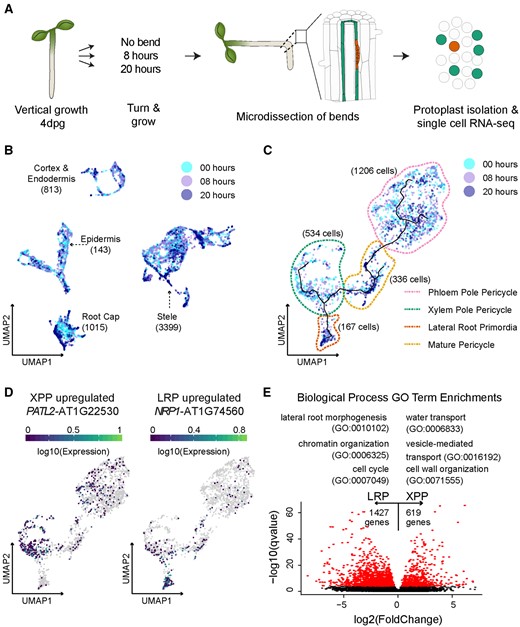
Analysis of lateral root initiation using single-cell RNA-seq. A, Experimental design: A. thaliana seedlings were grown vertically for 4 dpg and then rotated (or marked, for the control) and grown for an additional 8 or 20 h. Protoplasts were prepared from microdissected root sections for single-cell RNA-seq. B, UMAP of all 6,658 cells colored by experiment. Cell type identities were assigned to each partition based on a set of marker genes. The cell type identities are indicated on the UMAP with the number of cells corresponding to each cell type. C, UMAP of pericycle-specific cells, such as LRP, mature pericycle (MP), PPP, and XPP cells colored by experiment. Pseudotime trajectory lines included on UMAP. D, Expression of pericycle-specific UMAPs of two DEGs between LRP and XPP. E, Scatter plot of the log2 fold change of average gene expression values between XPP and LRP and the MWW q-value. DEGs are colored in red. A selection of GO terms associated with DEGs is shown above the plot.
Our experiment yielded 6,658 cells, with a mean number of 15,987 reads per cell and a median of 1,383 genes expressed. Of these 6,658 cells, 1,730 (∼26%) cells were from the 20-h time point, 2,443 (∼37%) cells were from the 8-h time point, and 2,485 (∼37%) cells were from the no bend control (Supplemental Table S1). Further analysis was performed using Monocle 3 (Trapnell et al., 2014; Qiu et al., 2017; Cao et al., 2019), which uses Principal Component Analysis (PCA) and Uniform Manifold Approximation and Projection (UMAP) to reduce the dimensionality of the dataset and to visualize the relationships among cellular transcriptomes in a 2D space. Our analysis revealed four clusters. Using previously defined cell type markers (Brady et al., 2007; Cartwright et al., 2009), each cluster was assigned a label. Of the 6,658 cells, 813 (∼12%) cells were classified as cortex and endodermis, 1,015 (∼15%) cells were classified as columella/root cap, 1,431 (∼22%) cells were classified as epidermis, and 3,399 (∼51%) cells were classified as stele (Figure 1B; Supplemental Figure S1A). These results demonstrate that the microdissection was successful in capturing a representative sample of stele cells, as the proportion of these cells in our data was similar to that determined by imaging analyses (Shulse et al., 2019).
XPP cells are precursors of mature pericycle and LRP cells
To better understand the relationships between vasculature cell types, we re-clustered all cells identified as belonging to the stele. Of the 3,399 stele cells, 216 cells were labeled as phloem, 242 were labeled as xylem, 1,206 were labeled as phloem pole pericycle (PPP), 534 were labeled as XPP, 336 were labeled as mature pericycle, 167 were LRP, and 698 cells were too ambiguous in their gene expression to assign a label (Supplemental Figures S1, B and C; Supplemental Table S1). Intrigued by these ambiguous stele cells, we identified marker genes for this cluster by determining DEGs using a generalized linear model (GLM). Using a false discovery rate (FDR) cut-off of 0.1, this model identified 832 DEGs (Supplemental Data Set S1) in this cluster. Gene ontology (GO) term enrichment analysis of this gene list revealed three general trends. First, many of the GO terms were associated with stress and stimulus response. Second, many of the GO terms were associated with chromatin silencing and the negative regulation of gene expression. Third, a small number of GO terms pertain to root development. The ambiguous stele cluster also had signatures of stress-responsive genes that were independent of protoplast-induced stress (Supplemental Figure S1C inset). The upregulation of chromatin silencing genes may provide clues about the identity of these cells, or it could be a byproduct of the stress response signal. We identified several genes specifically expressed in this cell cluster that could serve as potential markers for further exploration of this ambiguous cell identity (Supplemental Figure S2A).
Due to the ambiguous nature of these cells, we generated a pericycle-specific UMAP that only included XPP, LRP, PPP, and mature pericycle cells (Figure 1C). A cell developmental trajectory connected the pericycle sub-clusters and recapitulated the known developmental relationship between these cell types (Figure 1C). Trajectories initiating either from the XPP or the PPP converged to mature pericycle but only the XPP (and not the PPP) population branched out toward the LRP, confirming that our results were faithfully recapitulating the known exclusive relationship of XPP to LRP cells (Malamy and Benfey, 1997). The XPP and the PPP cells are expected to differentiate at a similar time, whereas LRP and mature pericycle cells should form later. Our dataset confirmed this developmental progression, as ∼ 20% of the XPP and PPP cell clusters were from the 20-h time point whereas ∼ 50% of the LRP and mature pericycle clusters were from this later time point (Supplemental Figure S1D). We identified novel specific markers for each of these pericycle sub-clusters and from transcriptomic databases and confirmed the specificity of these potential markers (Supplemental Figure S2B).
We next attempted to identify genes that were expressed as XPP cells transitioned to LRP cells. To do this, we carried out a pseudotime analysis originating from the XPP population and connecting to either the LRP or the mature pericycle (Supplemental Figures S3, A and B). Using an FDR cutoff of 0.1, 1,892 genes were identified as changing in at least one of the trajectories. Of these genes, 878 were specific to the XPP to mature pericycle trajectory (Supplemental Figure S3C), 504 were specific to the XPP to LRP trajectory (Supplemental Figure S3D), and 510 were observed in both trajectories. As XPP cells developed, the expression of genes found in both trajectories decreased, and most were not expressed at high levels in the LRP cells or the mature pericycle cells. Among genes uniquely upregulated across the XPP to LRP trajectory, genes encoding transcription factors were overrepresented, including the well-known markers of initiation LBD16 and LBD29 (Okushima et al., 2007), as well as WUSCHEL-RELATED HOMEOBOX 5, CYTOKININ RESPONSE FACTOR 2 (CRF2), and PUCHI, all of which have previously been shown to play a role or to be expressed during lateral root development (Hu and Xu, 2016; Jeon et al., 2016; Goh et al., 2019; Supplemental Figure S3E). Other genes unique to this trajectory were regulatory kinase genes such as MUSTACHES, MAP KINASE KINASE 6, and RGF INSENSITIVE 5, which have also been shown to regulate lateral root development (Zeng et al., 2011; Ou et al., 2016; Xun et al., 2020; Supplemental Figure S3E). Observation of columella cells in our micro-dissected cell population (Supplemental Figure S1A) raised the possibility that root tips might have been inadvertently included in our analysis and that cells from the primary root meristem could therefore have been mixed into the LRP cluster. To test whether this was the case, we queried the expression of eleven genes recently identified as specifically marking the quiescent center (QC; Denyer et al., 2019). If there was substantial inclusion of root tips, we would expect to find cells expressing these markers. Instead, 7 out of 11 genes did not show any detectable expression in our dataset, and the four remaining genes had very low levels of expression with no enrichment in the LRP population (Supplemental Figure S3E). Taken together, the elevated expression of known LRP-induced genes and the absence of expression of QC-specific genes enable the LRP cluster to be annotated with a high degree of confidence.
We next performed DEG analysis on the transcriptomes associated with these different populations (Figure 1E). Due to the small number of LRP cells (167 cells i.e. ∼2.5% of all cells), three different statistical approaches were used to perform DEG analysis: a GLM, the Mann –Whitney –Wilcoxon (MWW) test, and a recently published packaged called Vision (DeTomaso et al., 2019). We used previously identified LRP-enriched genes as a guide to inform our use of the results from each method. LBD16 and LBD29 (Okushima et al., 2007) were called in all three methods, whereas ARF19 and GATA23 (De Rybel et al., 2010) were only called in Vision (but narrowly missed by the MWW method, with P-values of 0.001 and 0.0004, respectively, with an FDR of 0.0001). ARF7 was not identified as significantly differentially expressed using any approach. To compile the most comprehensive list, we generated a list of significant DEGs between the XPP and LRP populations identified using at least two approaches (Supplemental Figure S4A). We called 1427 DEGs specific to LRP and 619 DEGs specific to XPP cells (Supplemental Data Set S1). Several of these genes have been previously characterized as specific in their expression patterns, and expression maps of these genes on the pericycle UMAP reflect this quality (Figure 1D; Supplemental Figure S4, B and C; Zhu et al., 2006; Tejos et al., 2018; Winter et al., 2007).
As expected, a GO term enrichment analysis of the DEGs with higher expression in LRP cells (Figure 1E; Supplemental Data Set S1) showed a strong enrichment for terms associated with lateral root formation, lateral root morphogenesis, lateral root development, and auxin response. Terms associated with the regulation of translation initiation and RNA processing were also enriched, suggesting that the transition from the XPP to the LRP requires a burst of de novo protein production. Increased protein production is associated with a stem cell state (Himanen et al., 2004), which correlates with the transition from XPP to early LRP cells, which are competent to form all the types of cells of a developing root. Other GO terms associated with the DEGs more highly expressed in LRP were lateral root morphogenesis, cell cycle, and chromatin organization.
Single-cell analysis recapitulates and extends findings from previous transcriptome studies
Lateral root development has been extensively characterized by transcriptomic analysis, which was performed using a variety of lateral root induction models and experimental designs. We compared our LRP versus XPP DEGs with published datasets to assess differences in single-cell versus whole tissue (or population) methods. We found that roughly half of the genes (463 genes, including genes regulated by auxin and genes belonging to cell cycle processes) identified by a microarray analysis of induced lateral root development (Vanneste et al., 2005) were included in our set of genes that were upregulated in LRP cells; only five genes from this dataset were in our set of XPP-upregulated genes (Supplemental Figure S5A). This result suggests that our approach faithfully captured genes involved in lateral root initiation and distinguished LRP and XPP cells. A detailed time course analysis of lateral root development using a bend assay similar to that used in th is study (Voß et al., 2015) allowed us to compare to bulk RNA -seq data taken at similar time points to those used in our study. Two-thirds of the genes (187 genes) previously found to be upregulated at 9-h post-bending were contained within our set of genes upregulated in LRP, but none of the genes that were upregulated at 9 h were XPP-enriched (Supplemental Figure S5B). Roughly half the genes (469 genes) that were upregulated at 21 h were within our LRP-upregulated gene list; only nine genes that were upregulated at 21 h were in our XPP-upregulated gene list (Supplemental Figure S5B). At both time points, ∼1000 genes were uniquely found in LRP DEGs from our study. This similar bend assay consequently identified many of the same LRP-enriched genes as our single-cell analysis at distinct time points, demonstrating the trajectory of primordium development over time.
We also compared our data to transcriptome assays that did not directly examine lateral root initiation through root bending but instead queried related processes in the root. We compared our data to a time course analysis of primary root transcriptomes after auxin treatment (Lewis et al., 2013), as auxin treatment strongly promotes lateral root initiation. We found that 37 LRP-upregulated genes were strongly induced in this dataset in response to auxin, whereas only 2 XPP-upregulated genes were auxin-induced (Supplemental Figure S5C). By contrast, 26 XPP-upregulated genes were repressed by auxin treatment, whereas only 5 LRP-upregulated genes were found in this repressed dataset (Supplemental Figure S5C). Another recent analysis identified genes specifically induced by the ARF19-mediated auxin response (Powers et al., 2019). We found that 243 of our LRP-upregulated genes overlapped with the set of ARF19-specific auxin-induced genes, while only 19 XPP-upregulated genes did so (Supplemental Figure S5D). We conclude that our data reflect the auxin inducibility of lateral root initiation, and specifically that this auxin inducibility is at least in part mediated by ARF19. ARF19 is unique among the ARFs in being both auxin-responsive in its own expression pattern (Wilmoth et al., 2005) and a very strong activator of transcription itself (Lanctot et al., 2020)
We next examined how our dataset compared to genes expressed in the basal meristem during lateral root specification. During specification, cells become competent to form lateral roots if they transit through the basal meristem during an auxin response maximum. Many genes exhibit similar oscillatory behavior to the auxin response in the basal meristem (Moreno-Risueno et al., 2010). We found that 58 genes that oscillated in phase with the auxin response in the basal meristem were in our set of LRP-upregulated genes, whereas only one XPP-upregulated gene oscillated in phase with auxin (Supplemental Figure S5E). However, 213 XPP-upregulated genes oscillated antiphase to auxin in the basal meristem, while only 20 LRP-upregulated genes showed antiphase oscillation. How specification and initiation are connected temporally and spatially and how competent cells “remember” their future cell fate is still unknown. Our results suggest that the oscillatory behavior of some genes may predict their importance during initiation later in development, and in particular that genes with antiphase oscillation patterns may actively repress lateral root fate.
Finally, we compared our dataset to two datasets examining the early initiation of lateral roots. Compared to a study that identified genes whose expression was affected by repressing the auxin response specifically in early-stage LRPs (Ramakrishna et al., 2019), we found that our LRP-upregulated genes overlapped with nearly 200 of these genes (Supplemental Figure S5F), again emphasizing the importance of the auxin response for establishing lateral root fate. Comparison to a dataset of fluorescence-activated cell -sorted XPP cells treated with the auxin NAA (De Smet et al., 2008), which promotes lateral root development, also showed strong correspondence with our data. Clusters from this dataset where lateral root initiation was promoted overlapped with over 400 of our LRP DEGs and only three of our XPP DEGs (Supplemental Figure S5G), whereas clusters from this dataset where lateral root initiation was repressed overlapped with 52 genes from our XPP DEGs and 5 genes from our LRP DEGs (Supplemental Figure S5G). These cell type -specific transcriptomes identified key markers of this cell fate transition, and consequently their strong correlation with our own DEG lists suggests that our analysis faithfully captured transcriptomes during this developmental process.
Genes upregulated in LRP cells are indicative of cells undergoing fate transitions
Based on the comparison of our XPP and LRP DEGs to published datasets, it is clear that much of our data replicate and support previously identified genes specific to lateral root initiation. We consequently chose genes identified in our analysis as upregulated in LRP cells for further molecular and phenotypic validation analysis. We decided to assay three groups of genes based on function, choosing several candidate genes from these three groups: chromatin regulators (four genes), cell cycle regulators (seven genes), and regulators of stemness (undifferentiated, stem cell-like status; six genes) to carry out two types of validation experiments: (1) characterizing their spatial expression patterns with transcriptional reporters in wild-type Col-0 and arf7 arf19 mutant seedlings, and (2) phenotypic evaluation of lateral root development in transgenic line with cell -type- specific repression of candidate genes.
The gene function categories we chose for validation are indicative of cells undergoing fate transitions. As one of the earliest morphological steps in this process is an asymmetric cell division, followed by many subsequent cell divisions (Malamy and Benfey, 1997), it is not surprising that a number of LRP-enriched DEGs are involved in cell cycle control. It is already known, for example, that expression of the cyclin gene CYCB1;1 marks LRP (Beeckman et al., 2001). Interestingly, one of the distinguishing features of XPP cells compared to PPP cells is that some XPP cells are arrested in G2, whereas all PPP cells are arrested in G1 (Beeckman et al., 2001). This G2 arrest may prime these XPP cells to undergo rapid reintroduction into the cell cycle. We also found enrichment of chromatin remodeling factors in the set of LRP-upregulated genes. Considering that lateral root initiation is the first step in organogenesis, it makes sense that broad transcriptional changes, mediated by changes in the chromatin landscape (Jarillo et al., 2009), may be required (Supplemental Data Set S1). Finally, we found that genes that promote cell division, differentiation, and stemness, mostly transcription factor genes, were also enriched in the set of genes upregulated in LRP cells. Most of these genes have been characterized as regulating development in other meristems, such as the primary root meristem or the shoot apical meristem, but had not been shown to play a role in lateral root development. Through careful analysis of these genes, we parsed apart their roles in lateral root development.
Perturbation of candidate genes using a cell type -specific dCas9-driven repressor system affects lateral root architecture
To explore the functional roles of candidate genes in lateral root development, we devised a method to repress the expression of candidate genes only in the XPP cell lineage. We leveraged the enhancer trap line J0121, which is specifically expressed in XPP cells via a UAS–GAL4 driver system (Laplaze et al., 2005). We first introgressed J0121 into the Col-0 background (referred to hereafter as J0121Col) and then introduced a UAS-dCas9-TPLN300 repressor (dCas9R) construct with three gene-specific sgRNAs directed to the promoter regions of candidate genes (J0121Col≫dCas9R; Supplemental Figure S6; Supplemental Data Set S2). This cell -type -specific repression system has several advantages over traditional knockdown and knockout studies. For instance, multiple guides can be used to simultaneously repress several members of the same gene family that may have redundant functions. Additionally, many of the candidate genes we identified as enriched in LRP cells also play roles in embryonic and primary root development, greatly complicating assessment of their role in lateral root development using global mutant approaches.
To test the efficacy of our assay, we investigated the effects of repressing the expression of both ARF7 and ARF19. As expected, these perturbation lines had significantly reduced lateral root density compared to the empty vector control, although they did not fully recapitulate the full suppression of lateral roots seen in arf7 arf19 null mutants (Supplemental Figure S7; Figure 2C). This observation is consistent with the small reduction in lateral root number seen in plants harboring a GATA23-driven CRISPR/Cas9 deletion of ARF7 and ARF19 (Decaestecker et al., 2019). There are at least two likely explanations for the milder phenotype of J0121Col≫dCas9R compared with the arf7 arf19 null mutant. First, repression in J0121Col expression is limited to XPPs and lateral root Stages I –III, so there is likely residual ARF protein that persists from expression in pre-XPP fate cells (Dubrovsky et al., 2006). Second, our synthetic repressor may not block all transcriptional activity, leading to hypomorphic rather than amorphic phenotypes. Even given these limitations, the system proved to be sufficiently sensitive to enable detection of cell type-specific impacts on lateral root development.
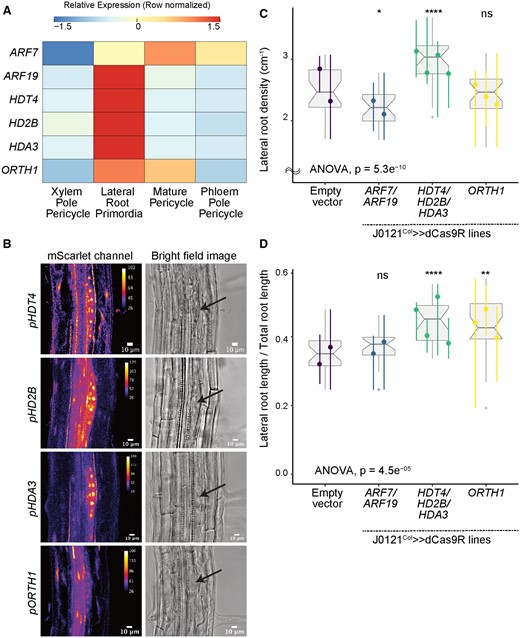
Validation experiments on chromatin modifier candidate genes. A, Heatmap (row-scaled) visualizing the expression of candidate genes in the pericycle cell clusters from the single-cell library. Scale bar represents the z-score of the normalized expression values. B, Confocal microscopy images of candidate genes’ transcriptional reporters in early-stage LRP (left) and bright-field image of the corresponding primordia (right, Arrow indicate LRP). C, Lateral root density of J0121Col≫dCas9R transgenic lines of candidate genes. D, Proportion of total root length contributed by lateral roots of J0121Col≫dCas9R transgenic lines of candidate genes. For C and D, significance was determined by pairwise comparison with empty vector control and ANOVA (ns: P > 0.05 | *P ≤ 0.05 | **P ≤ 0.01 | ***P ≤ 0.001 | ****P ≤ 0.0001; Supplemental File S1). For each candidate gene, multiple independent transgenic lines have been analyzed; each colored line in the graph represents an individual line. All seedlings were imaged and analyzed at 10 dpg.
Chromatin remodeling factors influence lateral root development
Three histone deacetylase (HDAC) genes that are all in the same plant-specific gene family, HISTONE DEACETYLASE 3, HISTONE DEACETYLASE 2, and HISTONE DEACETYLASE 13 (HDA3, HD2B, and HDT4 ; Li et al., 2017; Luo et al., 2017), were all enriched in LRP cells in our DEG analysis (Figure 2A), as was ORTHRUS 1 (ORTH1), encoding an E3 ubiquitin ligase that decreases DNA methylation (Figure 2A; Kim et al., 2014). Transcriptional reporters of these genes were strongly expressed in early -stage primordia (Figure 2B). The expression of HDT4 and HDA3 was specific to LRPs in the differentiated zone of the primary root, although both were also strongly expressed in the meristematic zone of the primary root (Supplemental Figure S8). Their expression in the meristem was substantially reduced in arf7 arf19 mutants, suggesting they may be regulated by auxin-mediated transcriptional programs (Supplemental Figure S8). HD2B was also strongly expressed in LRP cells, as well as the primary root meristem and other pericycle cells (Supplemental Figure S8). ORTH1 was broadly expressed in the vasculature of the differentiated zone of the primary root, not only in LRP cells (Supplemental Figure S8), which is reflected by its enrichment in mature pericycle cells in our single-cell library (Figure 2A). Its expression was not affected in arf7 arf19 mutant lines (Supplemental Figure S8).
Using J0121Col≫dCas9R, we targeted all three HDAC genes for repression using distinct guide RNAs for each gene. Simultaneous repression of all three genes caused a strong phenotype, where both the density of lateral roots (Figure 2C) and the proportion of total lateral root length contributed by lateral roots were significantly increased (Figure 2D). We chose these two metrics, as they encapsulate multiple aspects of root system architecture. Lateral root density measures the frequency of lateral root initiation by quantifying how many lateral roots occur normalized by the length in which they can form, namely the axis of the primary root. The proportion of total root length contributed by lateral roots is a more complex metric, as the percentage of the root system that is contributed by lateral roots is determined by both the number and length of these lateral roots. Consequently, this measurement can assess both initiation and the speed and degree of outgrowth of lateral roots, but it also conflates these developmental processes into a single metric. By measuring both the density and proportion of lateral roots, we decoupled initiation and emergence in our analyses. We performed ANOVA statistical analysis on these metrics in all experiments (Supplemental File S1). The finding that both metrics increased in our perturbation lines suggests that the HDACs may repress lateral root initiation and later stages of development. ORTH1 repression in XPP cells did not significantly affect lateral root density (Figure 2C), but the proportion of total root length contributed by lateral roots significantly increased (Figure 2D). Thus, ORTH1 may repress lateral root growth only post-initiation. All of these chromatin regulators were strongly expressed in LRP cells, and repressing their function stimulates lateral root growth, suggesting they may act to coordinate cells and promote orderly development.
Cell cycle regulators are active during lateral root development
We characterized the roles of five DEGs enriched in our LRP population that function in cell cycle regulation: RECEPTOR FOR ACTIVATED C KINASE 1A, B and 1C (RACK1A, RACK1B, and RACK1C), NAP1-RELATED PROTEIN 1 and 2 (NRP1 and NRP2), and CYCLIN-DEPENDENT PROTEIN KINASE INHIBITORS 6 and 11 (SMR6 and SMR11 ; Figure 3A). RACK1B and RACK1C interact with protein kinase C (Guo and Chen, 2008), SMR6 and SMR11 are cyclin-dependent kinase inhibitors (Yi et al., 2014), and NRP1 is a histone chaperone whose null mutant is characterized by cell cycle arrest during the G2 to M transition (Zhu et al., 2006). We generated transcriptional fluorescent reporters of RACK1B and RACK1C and found that both genes are indeed expressed in early -stage LRP , as seen in the single-cell data (Figure 3B). RACK1B is also expressed in XPP cells not undergoing lateral root development in the differentiation zone, a result that is also aligned with our single-cell analysis. Expression of both RACK1B and RACK1C was lost in the differentiated zone of the primary root in arf7 arf19 mutants, which do not form lateral roots, indicating the specificity of their expression in LRP cells in this zone (Supplemental Figure S9). In the primary root meristem, these genes are also highly expressed, and their expression was highly reduced in arf7 arf19 mutants (Supplemental Figure S9). This expression pattern in the primary root meristem suggests that ARF7 and ARF19 may be the primary ARFs regulating RACK1 expression.
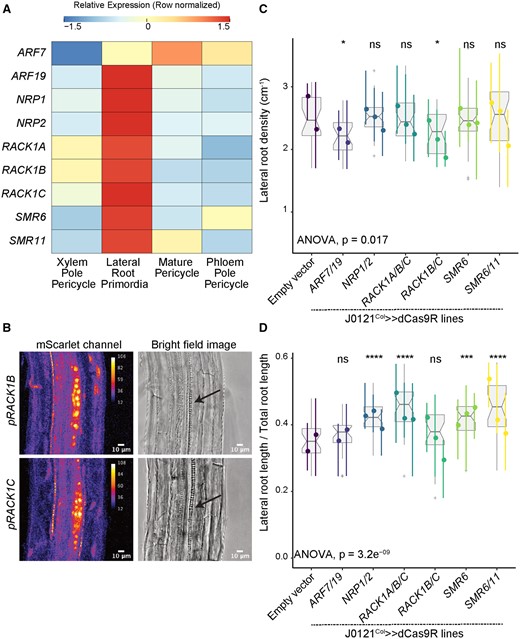
Validation experiments on cell cycle regulator candidate genes. A, Heatmap (row-scaled) visualizing the expression of candidate genes in the pericycle cell clusters from the single-cell library. Scale bar represents the z-score of the normalized expression values. B, Confocal microscopy images of candidate genes’ transcriptional reporters in early-stage LRP (left) and bright-field image of the corresponding primordia (right, Arrow indicate LRP). C, Lateral root density of J0121Col≫dCas9R transgenic lines of candidate genes. D, Proportion of total root length contributed by lateral roots of J0121Col≫dCas9R transgenic lines of candidate genes. For C and D, significance was determined by pairwise comparison with empty vector control and ANOVA (ns: P > 0.05 | *P ≤ 0.05 | **P ≤ 0.01 | ***P ≤ 0.001 | ****P ≤ 0.0001; Supplemental File S1). For each candidate gene, multiple independent transgenic lines have been analyzed; each colored line in the graph represents an individual line. All seedlings were imaged and analyzed at 10 dpg.
We next used J0121Col≫dCas9R to examine the functional relevance of these cell cycle regulators. NRP1 is highly related to NRP2, so we generated a repression line with guides targeting both genes. These lines did not show differences in lateral root density (Figure 3C), but they did show a significantly increased proportion of summed total root length that was contributed by lateral roots, reflecting longer lateral roots than in the control lines (Figure 3D). RACK1B and RACK1C are highly related and show redundancy with RACK1A, so we generated two separate sets of repression lines: one with guides targeting RACK1B and RACK1C and the other with guides targeting all three RACK1 genes. Repression of RACK1B and RACK1C caused a significant decrease in lateral root density (Figure 3C). Interestingly, while repression of all three RACK1 genes did not significantly affect lateral root density, this line did show a significantly increased proportion of total root length contributed by lateral roots (Figure 3D), similar to the NRP1/NRP2 repressed line. Lines with singular repression of SMR6 and concurrent repression of SMR6 and SMR11 did not show differences in lateral root density from the control (Figure 3C), but again they showed a significantly increased proportion of total root length contributed by lateral roots (Figure 3D).
Genes that encode pluripotency and stemness are upregulated in LRP cells
We chose five DEGs known to play a role in developmental transitions for further validation studies, specifically TARGET OF MONOPTEROS 6 (TMO6), encoding a Dof-type transcription factor originally isolated as a target of ARF5 in embryos (Schlereth et al., 2010); BREVIS RADIX-LIKE 1 (BRXL1), encoding a BRX-like regulator of primary root development (Briggs et al., 2006); LATERAL ROOT PRIMORDIUM 1 (LRP1), a marker of LRP (Smith and Fedoroff, 1995; Singh et al., 2020); OVATE FAMILY PROTEIN 8 (OFP8), encoding a transcriptional repressor of KNOX family transcription factors (Wang et al., 2011); and PLETHORA 3 (PLT3), encoding a PLT family protein that interprets auxin gradients in the primary root (Santuari et al., 2016). The presence of genes such as LRP1, BRXL1, and PLT3, which are known to regulate early stages of root development, confirmed that our dataset includes genes expected to be active early during lateral root initiation. BRXL proteins have recently been shown to play a role in promoting nuclear migration and asymmetric cell division during stomatal development (Rowe et al., 2019; Muroyama et al., 2020), two processes that are also essential during the very first stages of lateral root initiation. OFP8 and TMO6 were somewhat unexpected discoveries, given that OFP s have primarily been characterized as functioning in fruit development (Wang et al., 2016; Snouffer et al., 2020), and TMO genes have primarily been characterized as functioning in embryonic development (Schlereth et al., 2010).
The expression of all of these genes showed enrichment in LRP cells, although TMO6 expression was most highly enriched in PPP cells (Figure 4A), which is consistent with its known role in phloem cell division and differentiation (Miyashima et al., 2019). Reporters of PLT3 (Galinha et al., 2007), LRP1 (Smith and Fedoroff, 1995), and TMO6 (Schlereth et al., 2010) have previously been published, so we only generated transcriptional reporters of OFP8 and BRXL1. Both showed strong and specific expression in LRP (Figure 4B). The TMO6 reporter was indeed strongly expressed in developing primordia, as predicted from the single-cell analysis, but it was also expressed in vascular cells not undergoing lateral root development, an expression pattern that corresponds to our single-cell data and published results. TMO6 expression in all tissue types was lost in arf7 arf19 mutants (Supplemental Figure S10). The loss of TMO6 expression in non-LRP cells in arf7 arf19 mutants suggests that TMO6, at least in the root, is primarily a target of these ARFs rather than ARF5. TMO6, BRXL1, and OFP8 were not expressed in the primary root meristem (Supplemental Figure S10), making them potentially useful for targeting engineering efforts specifically to lateral roots.
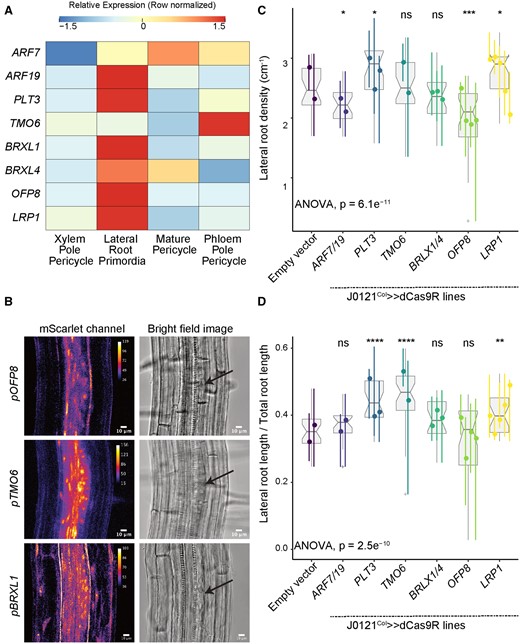
Validation experiments on stemness candidate genes. A, Heatmap (row-scaled) visualizing the expression of candidate genes in the pericycle cell clusters from the single-cell library. Scale bar represents the z-score of the normalized expression values. B, Confocal microscopy images of candidate genes’ transcriptional reporters in early-stage LRP (left) and bright-field image of the corresponding primordia (right, Arrow indicate LRP). C, Lateral root density of J0121Col≫dCas9R transgenic lines of candidate genes. D, Proportion of total root length contributed by lateral roots of J0121Col≫dCas9R transgenic lines of candidate genes. For C and D, significance was determined by pairwise comparison with empty vector control and ANOVA (ns: P > 0.05 | *P ≤ 0.05 | **P ≤ 0.01 | ***P ≤ 0.001 | ****P ≤ 0.0001; Supplemental File S1). For each candidate gene, multiple independent transgenic lines have been analyzed; each colored line in the graph represents an individual line. All seedlings were imaged and analyzed at 10 dpg.
Repression of these genes in XPP cells using J0121Col≫dCas9R affected root architecture but in different ways. Repression of PLT3 caused a significant increase in both lateral root density (Figure 4C) and the proportion of total root length contributed by lateral roots (Figure 4D), suggesting that PLT3 may repress both lateral root initiation and emergence post-initiation. Repression of TMO6 did not affect lateral root density (Figure 4C), but it did cause a significant increase in the proportion of total root length contributed by lateral roots (Figure 4D), suggesting it may act on lateral root development post-initiation. Repression of LRP1 in XPP cells significantly increased both lateral root density (Figure 4C) and the proportion of total root length contributed by lateral roots (Figure 4D), a phenotype that matches previously reported overexpression lines of LRP1, which showed reduced lateral root density (Singh et al., 2020). Concurrent repression of BRXL1 and its close homolog BRXL4 did not significantly affect either lateral root density (Figure 4C) or the proportion of total root length contributed by lateral roots (Figure 4D), despite its strong expression in LRP cells. We did observe irregular spacing of lateral roots and shorter primary roots in BRXL/BRXL4 repression lines, suggesting they may play a role in lateral root emergence (Supplemental Figure S7). Repression of OFP8 led to unique behavior in our perturbation lines, as these lines showed significantly reduced lateral root density (Figure 4C). Since OFP8 was not previously shown to play a role in root development, this strong effect on lateral root initiation and its strongly specific expression in LRP are notable. OFP8 repression did not affect the proportion of total root length contributed by lateral roots (Figure 4D), but these lines had shorter primary roots than the wild -type (Supplemental Figure S7).
Non-LRP cells populations undergo transcriptional changes and fate transitions in response to lateral root initiation
The formation of a new lateral root is a self-organizing process during which a very limited number of competent XPP cells undergo repeated cell divisions to initiate lateral root organogenesis (Torres-Martínez et al., 2020). Continued development of the new root requires biophysical restructuring of the surrounding cell files (Vermeer and Geldner, 2015). Signatures of lateral root development are seen outside the pericycle during the pre-emergence stages of development, including early initiation (Vermeer et al., 2014). Feedback on auxin signaling and changes in auxin transport patterns in the endodermis (Marhavý et al., 2013) and the vasculature (De Smet et al., 2007; Porco et al., 2016) are also essential for the first steps of lateral root initiation. In our comparison of our LRP DEGs to previously published bulk transcriptomes taken at similar time points (Supplemental Figure S5B ; Voß et al., 2015), not all the genes captured in the bulk analysis were found in our LRP DEGs or XPP DEGs. To test whether these genes, identified in the previous study but not in ours, are expressed in cell layers outside the pericycle, we analyzed the non-stele clusters in our analysis. Because our single-cell RNA -seq dataset allowed us to examine the transcriptional state of these different cell layers independently, we examined which of the non-pericycle cell files contribute to transcriptional changes in response to this fate switch. For this analysis, we leveraged DEGs (945 genes) identified from this previous study (Voß et al., 2015) corresponding to the 20- h post-bend time point in our study and mapped the expression of these genes to our cell type-resolved dataset (Figure 5A). As expected, most of these genes showed high expression in the LRP population and very low expression in the XPP population. In addition, we found strong enrichment of certain groups of genes in non-LRP populations, especially in those categorized as mature pericycle, endodermis cells, and root cap cells.
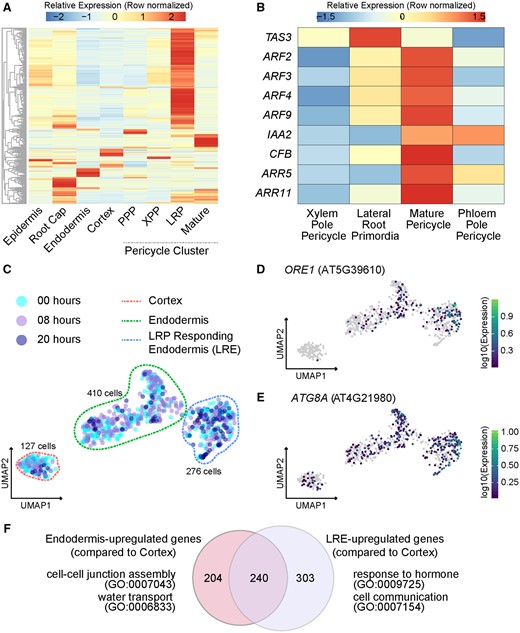
Analysis of non-LRP cells in the single-cell library. A, Heatmap (row-scaled) of the expression patterns of previously identified LR-specifying genes in different cell clusters. B, Expression heatmap (row-scaled) of specific auxin-inducing and auxin-repressing genes in different stele cell clusters. C, UMAP of Cortex, Endodermis, and LRE cells. D, Expression UMAP of ORE1, encoding a NAC transcription factor that promotes autophagy of endodermal cells overlying LRPs. E, Expression UMAP of ATG8 A. F, GO of genes enriched in endodermis and LRE cell populations. The Venn diagram represents DEGs upregulated in endodermis in comparison to the cortex and upregulated in LRE in comparison to the cortex. A selection of GO terms for each of these sets of DEGs is shown.
We focused first on genes showing strong expression in the mature pericycle, as these cells could be directly in contact with the initiating primordium. To assess if the genetic circuits regulating the XPP to mature pericycle transition were linked to lateral root development at the bend, we examined the genes expressed in our pseudotime analysis of the transition of XPP cells to mature pericycle cells compared to the genes expressed in the trajectory of the transition of XPP cells to LRP cells (Supplemental Figure S3, A–D). Genetic signatures in this mature pericycle trajectory suggested that these cells, acting as the outgroup for this fate transition, nonetheless were responding to lateral root development, though in a very distinct manner from cells within the XPP to LRP trajectory. One gene that was expressed in XPP cells and LRP cells close to the branch point is TRANS-ACTING siRNA3 (TAS3; Figure 5B). TAS3 promotes lateral root development by inhibiting the class B ARF genes ARF2, ARF3, and ARF4 (Marin et al., 2010). Consistent with this pattern, ARF2 transcripts were found only in the mature pericycle trajectory. While TAS3 expression was fairly consistent across XPP, LRP, and mature pericycle cells, ARF2, ARF3, and ARF4 showed greater expression in the mature pericycle cell population compared to the XPP population, and they also showed high expression in PPP cells (Figure 5B). As LRPs never initiate from PPP, strong expression of these repressor ARFs in mature pericycle cells and PPP cells suggests that these genes are repressing the auxin response, and thus lateral root development, in these cells.
A growing body of research has shown that LRPs send signals to actively repress the initiation of surrounding pericycle cells, allowing for the proper spacing of lateral roots along the axis of the primary root (Murphy et al., 2016; Toyokura et al., 2019; Trinh et al., 2019). The strong expression of genes that repress the auxin response in mature pericycle cells suggests one mechanism for this inhibition. Further evidence in support of this model is the expression of another repressor ARF, ARF9, and the auxin repressor IAA2 only in the mature pericycle trajectory (Figure 5B). Two CRF s are also uniquely expressed in this trajectory, ARABIDOPSIS THALIANA RESPONSE REGULATORS 5 and 11 (Figure 5B), which are known to inhibit the auxin response, repress lateral root development, and coordinate the uniform spacing of lateral roots (To et al., 2004; Mason et al., 2005). A target of cytokinin signaling, CFB, which is specifically expressed in the flanking zone of developing LRPs (Brenner et al., 2017), is also unique to this trajectory (Figure 5B). Together, these data suggest that cells that were initially categorized as mature pericycle may be more accurately described as LRP-flanking pericycle cells and that this flanking fate is specifically induced by the initiation of a new root.
Lateral root development shows strong signatures in endodermal transcriptomes
We next examined the impact of lateral root initiation on the endodermal cell file, which is immediately exterior to the pericycle. We first re-clustered the 813 cell partition labeled as cortex and endodermis cells (Figure 5C). This analysis revealed three distinct cell populations. The first population was a set of 127 cells that expressed cortex marker genes, the second population was a set of 410 cells that expressed endodermis marker genes, and the third population was a set of 276 cells that were branching out from the endodermis population on the UMAP (Figure 5C; Supplemental Figure S11A). This third population was transcriptionally most similar to the 410 cells expressing endodermis marker genes (Supplemental Figure S11A), and 26% of the cells in this third population were from the 20 -h time point (Supplemental Figure S11B). As a comparison, ∼ 8% of the 127 cell population were from the 20 -h time point, while ∼ 9% of the 410 cell population were from the 20 -h time point (Supplemental Figure S11B). This third population also had the highest expression of the NAC transcription factor gene ORESARA1 (ORE1) and autophagy marker gene ATG8a (Figure 5, D and E). ORE1 (encoding a positive regulator of programmed cell death) and the autophagy marker gene ATG8a are specifically expressed in cells overlying LRPs (Escamez et al., 2020). ORE1 expressing cells eventually die in order to make space for the lateral root to emerge (Escamez et al., 2020). As such, we categorized these three populations as cortex (127 cells), endodermis (410 cells), and lateral root-responding endodermis (LRE; 276 cells; Supplemental Table S1).
To aid in identifying DEGs between the endodermis and LRE, both cell types were compared to cortex cells as an outgroup. We compared our populations of interest to an outgroup, as opposed to conducting a direct comparison, to reduce a strong signature of cortex-associated genes in the endodermis (further details are described in the Methods). As in the XPP–LRP comparison, only genes that were called significantly different using at least two methods were called as DEGs (Supplemental Figure S12). This analysis yielded > 2,000 DEGs between the endodermis and cortex, and > 3,000 DEGs between the LRE and cortex. As expected, there was large overlap between these two sets of DEGs (Supplemental Data Set S3). A smaller set of genes were identified that were specific to the endodermis cells (204 genes), and specific to the LRE cells (303 genes), while 240 were commonly upregulated genes in the endodermis and LRE (Figure 5F). The DEGs specific to the endodermis cells were enriched for GO terms associated with cell–cell junction assembly and water transport, while the DEGs specific to the LRE cells were enriched for GO terms associated with hormone response, auxin homeostasis, cell communication, lateral root development, and multiple stress responses (Figure 5F; Supplemental Data Set S3).
We performed pseudotime analysis to identify genes driving the transition from the endodermis to the lateral root endodermis. This analysis uncovered a branch point between the two cell types. One branch that we termed the “main branch” was composed mostly of cells from the 8-h time point and was transcriptionally similar to the rest of the endodermis cluster. The other branch that we called the “LRE branch” led toward the LRE cluster (Supplemental Figure S13A). Again, two separate trajectories were analyzed, one containing only endodermis cells and another containing endodermis cells below the branch point and LRE cells. This analysis yielded a set of 2,082 genes whose expression changed over the course of the cell developmental trajectory. After removing genes that were upregulated in cortex cells, a small set of genes were identified as specific to the main branch (154 genes) and to the LRE branch (648 genes; Supplemental Figure S13B; Supplemental Data Set S3). GO analysis of the main branch-specific genes showed enrichment for terms associated with responses to various stimuli. An example of a main branch-specific gene is DEEPER ROOT 1 (DRO1; Supplemental Figure S13C). DRO1, which is negatively regulated by auxin, is involved in gravity sensing in the root tip and in determining lateral root branch angle (Uga et al., 2013; Guseman et al., 2017; Waite et al., 2020). DRO1 loss-of-function mutants have increased numbers of horizontal lateral roots and have trouble establishing auxin gradients in response to gravistimulus. In our dataset, the majority of cells expressing DRO1 are endodermal cells, suggesting these cells play a specific role in response to gravity. The LRE branch genes were enriched for GO terms associated with lateral root development, auxin homeostasis, auxin transport, and biosynthetic processes. Examples of LRE branch-specific genes are WRKY75 and PINS-LIKE 5 (PILS5; Supplemental Figure S13D). WRKY75 is particularly induced in response to phosphate starvation (Devaiah et al., 2007), PILS5 encodes an auxin efflux carrier that regulates intracellular auxin homeostasis, and both independently play a role in controlling root architecture (Barbez et al., 2012). These findings, along with gene ontologies pertaining to several biotic and abiotic stress responses (Supplemental Data Set S3), suggest that the LRE cell population is primed to dynamically assess environmental conditions and thereby regulate lateral root emergence.
Discussion
Among the greatest mysteries in development is the process by which a single cell begins proliferating and partitioning its progeny into increasingly determined cell fates. The initiation of lateral root development is among the best understood example of such a process in plants, yet many fundamental questions remain. One key piece of missing information is a full accounting of transcriptional changes during the earliest stages of lateral root organogenesis. We attempted to fill this gap by performing single-cell RNA -seq on root sections undergoing the initiation phase. Using this approach, we were able to capture and identify all root cell types outside the meristem, including cells expressing known markers of LRP (Figure 1). Directed comparisons of transcripts in these LRP cells and the cells classified as XPP progenitors revealed many genes previously unknown to be associated with lateral root initiation. Repressing the expression of multiple candidate genes caused defects in lateral root development, and many showed reduced expression in arf7 arf19 mutants, thereby connecting them to auxin signaling (Figures 2–4; Supplemental Figures S7–S10). We also identified two subsets of cells outside the LRP that appear to respond to the initiation of a new root (Figure 5).
Lateral root development has been extensively probed by bulk RNA-seq experiments (Vanneste et al., 2005; De Smet et al., 2008; Voß et al., 2015; Ramakrishna et al., 2019), and our study successfully captured the majority of transcripts previously associated with this process (Supplemental Figure S5). We also found many more LRP-enriched genes in our library than in bulk transcriptomes, underlining the utility of this method for examining rare developmental events. There are also nearly 700 cells within our stele cluster that were too ambiguous in their gene expression to assign a cell label. Analysis of DEGs within this cluster generated GO terms associated with stress responses, potentially masking the expression of developmental regulators, which are typically expressed at low levels. It is possible that these cells represent highly transient populations, such as XPP precursors that are in transition to lateral root competency. Additional DEG analysis with more time points within the XPP cluster and this non-assigned stele cell cluster may yield further insights into the identity of these cells.
Many of our XPP-upregulated genes oscillate antiphase to the auxin response in the basal meristem (Moreno-Risueno et al., 2010), which is consistent with a fate of not being competent to form lateral roots. This transcriptional signature may be actively preventing lateral root initiation in this subset of XPP cells, which is in alignment with the hypothesis that LRP-competency is the default state of XPP cells. Further supporting this hypothesis, the majority of our J0121Col≫dCas9R transgenic plants exhibited increased lateral root density or increased lateral root length, suggesting that these target genes may normally act as repressors of lateral root initiation or emergence. When they are repressed, development is accelerated. One interpretation is that cell division and lateral root development are the default states of competent pericycle cells. This would be analogous to the situation in the root epidermis, where becoming a root hair is the default state that must be actively repressed in non-hair cells (Berger et al., 1998). This hypothesis is supported by the finding that laser ablation of surrounding tissue caused unrestricted cell division in the pericycle cell file (Marhavý et al., 2016), and exogenous auxin treatments triggered lateral root initiation in every pericycle cell (Himanen et al., 2002). Another explanation may be that these genes act as gatekeepers in lateral root development, promoting developmental progression or providing checks to keep cellular events coordinated or appropriately controlled. For example, HD2C and HD2B have been linked to the downregulation of ribosomal biogenesis genes (Chen et al., 2018), a process we found to be strongly induced in LRP . This connection is consistent with our finding that repression of these genes led to a higher density of lateral roots.
Our study was specifically designed to untangle differences between the primary root meristem and developing LRP using single -cell transcriptomics on microdissected roots and cell type-specific perturbation of candidate genes using the J0121Col≫dCas9R system. Although our identified LRP cell cluster was enriched for known LRP genes (Supplemental Figure S5) and deprived of QC markers (Supplemental Figure S3E), the presence of cells expressing lateral root cap and columella markers (Supplemental Figure S1A) in our overall cell population means that we cannot exclude the possibility of contamination of primary root meristematic cells in our library. Furthermore, although reporter expression for genes such as OFP8 and TMO6 appeared to be restricted to lateral and not primary roots in our study (Supplemental Figure S10E), the expression of these genes has been detected in the primary root meristem region in other recent studies (Möller et al., 2017; Miyashima et al., 2019). This underscores the similarities in the transcriptional profiles of early-stage LRP and the primary root meristem and highlights the challenges in distinguishing any independent factors.
By repressing the expression of candidate genes specifically in XPP cells, we could specifically query the roles of these common genes during lateral root development, in addition to avoiding several problems associated with global loss-of-function mutants. For example, PLT3 (Santuari et al., 2016) and BRXL1 (Briggs et al., 2006) play critical roles in the primary root meristem, making interpretation of any lateral root phenotypes difficult. A narrower spatiotemporal window of repression—only in XPP cells and in LRP cells up to Stage IV—may also reduce the likelihood of compensation from paralogs. This tissue-specific expression may explain the phenotypic difference between the PLT3-repressed line and plt3 plt5 plt7 mutants, which show reduced lateral root emergence (Du and Scheres, 2017). Differences in phenotypes could reflect an incomplete loss-of-function, expression in other cell types or at earlier time points, and/or feedback effects on other genes in the same gene regulatory network (Lavenus et al., 2015). Future studies might explore whether phenotypes could be uncovered in specific environments or using different metrics beyond what we analyzed here (Fitter, 1987; Lynch, 1995). Introgression of J0121 into different accessions would enable analysis of a broader array of cryptotypes (Chitwood and Topp, 2015) and would provide a more holistic view of impacts on root architecture. It is also challenging to definitively assign candidate genes as drivers of cell fate changes or as responders with essential downstream roles in organogenesis. Indeed, extensive feedback within the lateral root gene regulatory network (e.g. Lavenus et al., 2015) implies the existence of multiple cell states, each of which allows for acceleration or stalling of organogenesis. A large increase in the number of reporters active during the critical window of initiation, ideally multiplexed in wild-type and mutant backgrounds, should make it possible to better tease out cause and effect between the players identified here and elsewhere.
Although lateral root development is specific to XPP cells, the process is not cell-autonomous. Our analysis identified a population of endodermal cells distinct from the main endodermis branch (Figure 5). These cells were enriched in the expression of genes falling in ontology categories for hormone and auxin responses, cell–cell communication, and lateral root development, making a strong case that they are responding to developing primordia in underlying pericycle cells. These cells were also enriched in ORE1 expression, a gene that has recently been shown to play a role in lateral root initiation and emergence through programmed cell death of tissue overlying LRPs (Escamez et al., 2020). We were also able to identify a subset of pericycle cells that were likely located adjacent to the primordium and responding with a distinct transcriptional program that included a combination of auxin-repressing and cytokinin-induced genes (Figure 5). A dynamic analysis of the gene regulatory network governing lateral root development established that early cell fate-determining genes initiate multiple genetic feedback loops that divide the developing primordium into two zones, a central proliferative core and flanking cells that have inhibited expression of meristematic genes to repress cell division (Lavenus et al., 2015). The repression of auxin signaling might be induced in several cell types to sharpen the boundaries between the new organ and the cells that remain part of the primary root.
As human activity changes the climate and environments in which plants grow, understanding root development will help us engineer crops that are more robust to nutrient scarcities and environmental extremes. The major pathway by which eudicot plants regulate their root architecture is through modification of the position, spacing, density, and length of lateral roots. The stages of lateral root development are regulated by distinct genetic circuitry. Every stage represents an opportunity for natural and engineered modification of this developmental process. Molecular characterization of early stages of lateral root at single-cell resolution gives us a more comprehensive understanding of this fate decision and the molecular pathways that tune it.
Materials and methods
Construction of plasmids
Each reporter plasmid is composed of the selected promoter, the red fluorescent protein mScarlet with a nuclear localization tag (Bindels et al., 2017), and the rbcS terminator (Siligato et al., 2016). The three parts were assembled using Golden Gate assembly in the modified pGII-Hygr vector containing compatible Golden Gate sites (Weber et al., 2011). For each of the 10 constructed reporters, the promoter sequence of the reporter corresponds to the DNA sequence located 5′ of the start codon of the corresponding gene based on the TAIR10 genome from (Briggs et al., 2006) http://plants.ensembl.org/. While aiming for a 2,000 bp length, the lengths of promoters are usually smaller to avoid the coding sequences of other genes. The exact sequence and length of the selected promoter for each of the 10 genes can be found in Supplemental Data Set S2. The promoter sequence for the TMO6 reporters corresponds to the sequence used in a previous work (Smet et al., 2019). The promoter sequences were amplified from purified A. thaliana Col-0 genomic DNA using Q5 polymerase and with primer adding the specific Golden Gate spacer. After gel purification, each promoter part was cloned and sequence verified in a pBLUNT entry vector. Three-part Golden Gate assembly was performed using the pBLUNT promoter plasmid, mScarlet, rbcS terminator to clone the reporter plasmid.
For cell-type-specific knockdown mediated by J0121Col≫dCas9R, Gibson cloning was used to replace the egg-specific promoter and Cas9 from pHEE401E (Wang et al., 2015) with the UAS promoter and dCas9–TPL fusion (Khakhar et al., 2018). The resulting plasmid is used as a starting point to clone two or three guide RNAs against the promoters of selected gene/genes (identified using CHOP CHOP (Montague et al., 2014) ranging from the −200 to +100 region from the annotated TSS) using polymerase chain reaction (PCR) and the Golden Gate strategy described in (Wang et al., 2015).
Plant growth conditions and sample preparations
For all plant experiments, A. thaliana seeds were sown on plates containing 0.5 strength Linsmaier and Skoog nutrient medium and 0.8% w/v agar, stratified at 4°C for 2 d, and grown in continuous light conditions (fluorescent bulbs at 70–80 µmol m−2 s−1) at 22°C for the respective experimental designs.
Microdissection of root bends and protoplast isolation
For lateral root induction assays, ∼150 seedlings for each time point and treatment were rotated 90° 4 d post-germination (dpg) or in the case of the control treatment, the primary root tip was marked at this time and the plates were not turned. All tissue collection occurred simultaneously in order to control for circadian effects, so plates were turned at the appropriate time pre-collection to correspond to the different time points post-bend. On the day of single-cell library preparation, the protoplasting enzyme mix was prepared, as adapted from (Yoo et al., 2007). Briefly, 20 mM MES (pH 5.7) containing 1.25% (wt/vol) cellulase R10 (C224 PhytoTechnology Laboratories, Lenexa, KS, USA), 0.3% (wt/vol) macerozyme R10 (M481 PhytoTechnology Laboratories, Lenexa, KS, USA), 0.4 M mannitol, and 20 mM KCl was prepared and incubated in a 55°C warm water bath for 10 min. Upon cooling to room temperature (∼25°C), 10 mM CaCl2 and 0.1% BSA were added. Root bends (or marked region in the no bend control) were microdissected using a scalpel at 8 h (control and 8-h treatment groups) and 20 h (20- h treatment group) post-bending, ∼ 1 mm from the bend or mark in both directions. Using fine forceps, dissected bend tissue was transferred into 30 mm dishes containing 1 mL of protoplasting enzyme mix and gently scored using a fresh scalpel to increase the exposure of interior cell files to protoplasting enzymes. The plates were then flooded with 9 mL more protoplasting enzyme mix and incubated at room temperature for 1 h with gentle shaking (75–80 rpm). Protoplasting enzyme mix was filtered through a 40 μm cell strainer, transferred to 15 mL conical tubes, and centrifuged in 5 min at 500 g. The supernatant was carefully removed and resuspended in 50 μL protoplasting mix without enzymes. Cell number was determined using a hemocytometer and density was adjusted to ∼1,000 cell/μL.
Construction and selection of transgenic Arabidopsis lines
The floral dip method (Clough and Bent, 1998) was used to introduce constructs into Col-0 and arf7 arf19 lines (Okushima et al., 2007). T1 seedlings were selected on plates containing 0.5 strength Linsmaier and Skoog nutrient medium and 0.8% w/v Bacteriological agar (Caisson Laboratories, Smithfield, UT, USA) supplemented with 25 μg/mL Hygromycin B. The seeds were stratified for 2 d, exposed to the light for 6 h, and incubated in the dark for 3 d (Harrison et al., 2006). Hygromycin-resistant seedlings were identified by their long hypocotyl, enlarged green leaves, and long root. Transformants were transferred to soil, and T2 seeds were collected.
Lateral root bend assay and confocal microscopy
For each reporter, one Col-0 T1 line representative of other characterized T1 lines was selected to perform the lateral root bend essay. For each reporter, 20 T2 seeds of the corresponding T1 line were placed on plates containing 0.5 strength Linsmaier and Skoog nutrient medium and 0.8% w/v Bacteriological agar following a specific pattern to avoid seedling collision during the lateral root bend essay. The seeds were stratified for 120 h, grown vertically for 96 h at 22°C, rotated 90°C while keeping the plate vertical, and grown for an additional 20 h.
Confocal microscopy of reporter lines at root bends
Seedlings were fixed at 4 dpg + 20 h in 4% formaldehyde using vacuum infiltration followed by clearing using ClearSee solution (Kurihara et al., 2015). Fixed and cleared seedlings were mounted on microscopic slides using 50% glycerol and Parafilm edges to prevent the coverslips from pressing on the root. Seedlings were imaged at the bend region under a Leica SP5 confocal microscope. Images were processed using FIJI.
Comparison between Col-0 and arf7 arf19 lines
To perform comparative imaging of Col-0 and arf7 arf19 reporter lines, seeds of selected T1 lines for both Col-0 and arf7 arf19 reporter lines were sown on plates containing 0.5 strength Linsmaier and Skoog nutrient medium and 0.8% w/v Phytoagar. The selected Col-0 and arf7 arf19 lines for each reporter are specified below the microscope images shown in Supplemental Figures S8 –S10 and highlighted in bold. The seeds were stratified for 2 d and grown vertically at 22°C for 10 d. The seedlings were imaged under a Leica DMI 3000B microscope at the root tip region, the region above the root tip corresponding to root hair initiation, and the lateral root initiation region. As the arf7 arf19 line does not develop lateral roots, the theoretical lateral root initiation region was determined by identifying an LRP in a Col-0 seedling and imaging at a similar region.
Lateral root phenotypes of repression lines
For cell-type-specific knockdown mediated by J0121Col≫dCas9R, we leveraged an established GAL4-UAS system (Laplaze et al., 2005) of enhancer trap line J0121. We backcrossed the J0121 line generated in the C24 background 8 times into the Col-0 background to produce a strain we refer to as J0121Col. We confirmed that J0121Col retained strong green fluorescent protein (GFP) expression in the XPP and exhibited Col-0-like root growth dynamics. Transformants were selected as described above, and T2 seeds for at least 10 lines were collected. T2 seeds were grown vertically for 10 d in 100 mm square plates on 0.8% Bacteriological agar and scanned on a flatbed scanner (Epson America, Long Beach, CA, USA) for phenotyping. Since the T2 generation is a segregating population for the transformed plasmid, seedlings were genotyped for the presence of vector backbone to identify positive seedlings. Roots for positive seedlings were traced using ImageJ and the SmartRoot plugin (Lobet et al., 2011) and analyzed and plotted using the R package archiDART (Delory et al., 2016). Plots were generated using ggplot2. Lateral root density was measured as the total number of lateral roots divided by the length of the primary root. The proportion of lateral root length was measured as the summed length of all lateral roots divided by the summed length of all lateral roots and the primary root length. Statistical analysis was carried out, and detailed results of ANOVA and T-test are presented in Supplemental File S1.
Single-cell RNA-seq Protocol
Single-cell RNA-Seq was performed using the Chromium Single Cell Gene Expression Solution 10X scRNA-Seq platform (10X Genomics–version 2). Two replicates were produced for each time point of the experiment for a total of six samples. We also generated two replicates from a transgenic plant line with a slowed rate of IAA14 degradation (Guseman et al., 2015), dissecting root bends in this line 20 h after bending. This line shows delayed lateral root development, and we initially decided to compare its transcriptomes to our wild-type treatment groups. Unfortunately, one of the replicates of this line failed at the 10× droplet-binding stage, so we did not obtain the same number cells from this treatment group as from our other groups. Consequently, we excluded these cells from further analysis.
Estimating gene expression in individual cells
Single-cell RNA-seq reads were sequenced using the Illumina NextSeq 500 platform and mapped to the TAIR10 Arabidopsis genome using Cellranger version 3.0.1 software. Cellranger produces a matrix of UMI counts where each row represents a gene and each column represents a cell. The ARAPORT gene annotation was used. For this analysis, reads from two 0 -h replicates, two 8 -h replicates, and two 20 -h replicates were aggregated using the aggr command in cellranger to normalize to an equivalent number of mean reads per cell across samples. This resulted in a mean of 14,516 reads per cell, a median of 1,411 genes per cell, and a median of 2,873 UMIs per cell.
Running Monocle 3: dimensionality reduction and cell clustering
The filtered output of the Cellranger pipeline (./outs/filtered_gene_bc_matrices_mex/) was parsed into R version 3.5.0. In particular, the matrix.mtx file was parsed using the readMM() function from the Matrix package (https://cran.r-project.org/web/packages/Matrix/Matrix.pdf), and the barcodes.tsv file and the genes.tsv file were parsed using the read.table() function. Genes that were expressed in ˂ 10 cells were removed from the analysis. In addition, the 346 genes induced due to the protoplast generation process were also removed from the analysis (Birnbaum et al., 2003). The barcodes table was updated to label cells by Sample Number and Experiment. Finally the expression matrix, the barcode table, and the gene table were converted into a CellDataSet (CDS) using the new_cell_data_set() function in Monocle 3 ( version 0.1.2; https://cole-trapnell-lab.github.io/monocle3/; Cao et al., 2019)
All Monocle 3 analysis was performed on a High Performance Computing cluster using 128 GB of RAM spread across eight cores. We visualized cell clusters and trajectories using the standard Monocle workflow. Monocle internally handles all normalization needed for dimensionality reduction, visualization, and differential expression. The CDS was normalized and pre-processed using the preprocess_cds() function with the following parameters:
num_dim=100,
method="PCA",
norm_method="log",
scaling=T,
residual_model_formula_str="∼ Sample_Number"
Preprocessing involves reducing the dimensionality of the data (the number of genes) using PCA. Here, we retained the first 100 PCs for further dimensionality reduction, and in addition, we reduced batch effect across samples. Then, the PCA matrix was used to initialize a non-linear manifold learning algorithm implemented in Monocle 3 called UMAP (McInnes et al., 2018). This allows us to visualize the data into two or three dimensions. Specifically, we projected the data onto two dimensions using the reduce_dimension() function using the following parameters:
reduction_method="UMAP",
preprocess_method="PCA",
umap.metric="cosine",
umap.min_dist=0.1,
umap.n_neighbors=15L,
umap.nn_method="annoy",
umap.fast_sgd=F
Next, cells were clustered into partitions using PhenoGraph (Levine et al., 2015) and into clusters using the Leiden community detection algorithm (Traag et al., 2019) with the cluster_cells() function using the following parameters:
reduction="UMAP",
k=20,
louvain_iter=1,
partition_qval=0.05,
weight=T,
resolution=c(10^seq(-6,0)).
This resulted in 5 cell partitions and 43 cell clusters. Next, for each cell partition, a cell trajectory was drawn atop the projection using Monocle’s reversed graph embedding algorithm, which is derived from SimplePPT (Mao et al., 2017) using the learn_graph() function using the following parameters:
use_partition=T,
close_loop=F,
learn_graph_control=list(prune_graph=T)
To further analyze the partition, we annotated as stele those cells that were reclustered together and reanalyzed using Monocle 3 as previously described, except that during pre-processing, instead of performing PCA on all the genes, PCA was performed on just a set of stele cell marker genes reported earlier (Mao et al., 2017). Specifically, the “use_genes” option was used in the preprocess_cds() function, and a list of gene names was provided. Lastly, cells were clustered using the cluster_cells() function, and the “resolution” parameter was set to 0.001. This produced three partitions and seven clusters.
To further analyze the clusters we annotated as PPP , Mature Pericycle, XPP , and LRP , these cells were reclustered together and reanalyzed using Monocle 3 as previously described except that during pre-processing, instead of performing PCA on all the genes, PCA was performed on just a set of stele cell marker genes reported in (Brady et al., 2007). Again, the “use_genes” option was used in the preprocess_cds() function, and a list of gene names was provided. Next, the data were reduced into two dimensions using the reduce dimension function, but the “umap.min_dist” parameter was set to 0.01. Afterward, cell clusters were called as before using the cluster_cells() function, except that the “resolution” parameter was set to 0.0005. Next, a cell trajectory was created using the learn_graph() function. Finally, cell clusters were recalled using the cluster_cells() function, except that the “resolution” parameter was set to 0.001. This produced one partition and four clusters.
To further analyze the partition we annotated as Cortex and Endodermis, these cells were reclustered together and reanalyzed using Monocle 3 as previously described, except that during pre-processing, instead of performing PCA on all the genes, PCA was performed on just a set of cortex and endodermis cell marker genes reported in (Brady et al., 2007). This produced 2 partitions and 15 clusters.
Estimating doublets
Single Cell Remover of Doublets (Scrublet) was used to predict doublets in our scRNA-Seq data (Wolock et al., 2019). Using python version 3.5, Scrublet was run using default settings as described by the example tutorial that is available as a Python notebook (https://github.com/AllonKleinLab/scrublet/blob/master/examples/scrublet_basics.ipynb). The only significant change was that expected double rate was set to 0.1; in the tutorial, it is 0.06.
Assigning cell types
A set of known marker genes derived from earlier studies using GFP marker lines of the Arabidopsis root were used to identify cell types (Brady et al., 2007; Cartwright et al., 2009). For each cell, the average expression level of each set of marker genes was calculated and cells were assigned the cell identity whose marker gene set they expressed most highly.
From the initial UMAP containing all the cells in the dataset (6658 cells), we observed that the 4 major cell clusters identified in the reduced dimensional space corresponded with a major tissue layer or cell type. One cell cluster had cells that contained high expression of hair cell markers and non-hair cell markers and as such, cells from this cluster were labeled Epidermis. In a second cluster, cells had a high expression of columella marker genes as well as lateral root cap marker genes. This second cluster was labeled Columella/Root Cap. Similarly, there was a cluster of cells where some of the cells highly expressed cortex markers and other cells highly expressed endodermis markers. This third cluster was labeled Cortex & Endodermis. The final cluster had cells that highly expressed markers from various stele cell subtypes such as phloem, xylem, XPP , and so on. This last cluster was labeled stele.
To resolve sub cell types in the stele population, these cells were isolated to generate a second UMAP of only stele cells. Rerunning the dimensionality reduction on a subpopulation of cells allows for cell subtype populations to be identified as distinct cell clusters more easily using Monocle 3’s cluster_cells() function. In this second UMAP, cells expressing xylem, phloem, PPP , and mature pericycle cell markers formed distinct cell clusters. Cells expressing XPP markers and LRP markers were clustered together. Finally, there was a cluster composed of cells that highly expressed either XPP markers or PPP markers. Due to this ambiguity, this cell cluster was labeled Ambiguous Stele Cells. To help subcluster XPP cells and LRP cells and to further study pericycle cell development, the phloem, xylem, and ambiguous stele cells were removed from further analysis. With the remaining cells (labeled as Pericycle in Supplemental Figure S1C), a third UMAP was generated to help separate the distinct cell populations. In this third UMAP, XPP , LRP , mature pericycle, and PPP cells formed distinct clusters.
As done with the stele population, the population of Cortex & Endodermis cells was isolated to make an additional UMAP of only Cortex & Endodermis cells. This generated three distinct cell clusters: one composed of cells expressing cortex markers, another composed of cells expressing endodermis markers, and a third cluster that was most transcriptionally like endodermis but did not express endodermis markers as highly. Performing DEG analysis to identify which genes made this population distinct from the endodermis population, we found that this third population contained upregulated genes associated with the auxin response and lateral root formation. Thus, we labeled this cluster lateral root endodermis to indicate that these are most likely endodermis cells whose transcriptomes are changing in response to lateral root formation.
Calling DEG s: xylem pole pericycle versus lateral root primordia
DEG s between the cluster of cells labeled XPP and the cluster of cells labeled LRP were called using three different approaches.
The first approach involved running a GLM to predict the average log expression of each gene as a function of the cell type label. This was done using a subsetted CDS containing only XPP cells and LRP cells and the Monocle 3 function fit_models() with the following parameters:
model_formula_str = "∼cell_type",
expression_family="negbinomial",
clean_model=T
where “cell_type” is a column in the dataframe returned by the colData() function that describes the cell type label associated with a cell/barcode. Using an FDR cutoff of 0.1, 1,204 DEGs were called between XPP and LRP . Of these, 424 were more highly expressed in XPP , and 780 were more highly expressed in LRP .
The second approach involved using the MWW test to determine if the rank-sum of the normalized expression values for each gene differed between the XPP population and the LRP population. MWW test P-values were adjusted for multiple test comparisons using the Benjamini–Hochberg procedure via the R function p.adjust() from the stats package. Normalized expression values were calculated by taking the UMI matrix obtained using Monocle 3’s counts() function and dividing by the size factors of each cell using Monocle 3’s size_factors() function. Using an FDR cutoff of 0.0001, 2,088 DEGs were called, with 604 genes more highly expressed in XPP and 1,484 genes more highly expressed in LRP .
The last approach involved using the analysis tool Vision. The normalized expression matrix for only XPP and LRP cell clusters was exported from Monocle. The gene signatures of the pericycle cell population from (Parizot et al., 2012) were used to run the Vision() and analyse() function. LRP cell population was selected in browser view mode to identify DEGs against the XPP population. Vision identified 4,900 DEGs using an FDR of ˂ 0.05.
Pseudotime analysis: xylem pole pericycle cell development
Pseudotime analysis was performed on two subsetted CDSs, one containing only XPP cells and Mature Pericycle cells and the other containing only XPP cells and LRP cells. Cells in both CDSs were assigned a pseudotime on the cell trajectory using Monocle 3’s order_cells() function with the XPP serving as the root of the trajectory. Genes whose expression changed as a function of pseudotime were identified using a GLM . This was done on both CDSs using the fit_models() function and the following parameters:
model_formula_str = "∼pseudotime",
expression_family="negbinomial",
clean_model=T
Using an FDR cutoff of 0.1, 1,394 genes were identified as changing as a function of pseudotime in the CDS containing only XPP cells and Mature Pericycle cells, and 1,014 genes were identified as changing as a function of pseudotime in the CDS containing only XPP cells and LRP cells with an overlap of 510 genes.
Calling differential expressed genes: endodermis versus lateral root primordia responding endodermis
As previously described, a GLM was used to identify DEGs between the cluster of cells labeled Endodermis and the cluster of cells labeled LRP Responding Endodermis. Using an FDR cutoff of 0.1, 1,251 DEGs were identified, with 748 genes being more highly expressed in Endodermis and 503 genes being more highly expressed in lateral root endodermis. To identify additional DEGs, the MMW test was performed comparing Endodermis to Cortex and lateral root endodermis to Cortex, as was an analysis using the Vision tool.
For all analyses, DEGs were called between the endodermis and the cortex and the LRE and the cortex. We chose this outgroup method of comparison as our initial direct comparison of endodermis and LRE clusters showed a strong signature of cortex markers expressed in the endodermis, and we wished to identify endodermis-specific DEGs.
Pseudotime analysis: endodermis cells
Pseudotime analysis was performed on two subsetted CDSs, one with only Endodermis cells, and the other containing only Endodermis below the branch point, and LRP Responding Endodermis. As previously described, cells were assigned a pseudotime along the cell trajectory with the Endodermis cells below the branch point serving as the root. As previously described, a GLM was used to identify DEGs as a function of pseudotime. Using an FDR cutoff of 0.1, 2,063 genes were identified in the CDS with only Endodermis, and 2,079 genes were identified in the CDS with only Endodermis and LRP Responding Endodermis, with an overlap of 2,060 genes.
GO enrichment analysis
GO enrichment analysis was performed using PANTHER (http://pantherdb.org/ ; Mi et al., 2019). For GO term enrichments for XPP, LRP, Endodermis, and LRE, genes that were significant using at least two methods were used for analysis. All genes in the Arabidopsis genome were used as a background. Fisher’s Exact test was used and the FDR was calculated for multiple test correction. The complete annotation dataset for biological process, molecular function, and cellular component GO terms were used for analysis.
Accession numbers
The GEO accession number for the scRNA-seq data reported in this paper is GSE158761 (https://www.ncbi.nlm.nih.gov/geo/query/acc.cgi?acc=GSE158761). The ATG designations of the genes targeted for reporter and perturbation assays are as follows: AT5G10510 (AIL6), AT5G20730 (ARF7), AT1G19220 (ARF19), AT2G35600 (BRXL1), AT5G20540 (BRXL4), AT3G44750 (HDA3), AT2G27840 (HDT4), AT5G22650 (HD2B), AT5G12330 (LRP1), AT1G74560 (NRP1), AT1G18800 (NRP2), AT5G19650 (OFP8), AT5G39550 (ORTH1), AT1G18080 (RACK1A) AT1G48630 (RACK1B), AT3G18130 (RACK1C), AT5G60200 (TMO6), AT5G4046 (SMR6), and AT2G28330 (SMR11). All code used for single-cell analysis was deposited at https://github.com/Nemhauserlab/Lateral_Root_scRNAseq.
Supplemental data
The following materials are available in the online version of this article.
Supplemental Figure S1. Marker gene expression profiles and stele cell UMAP.
Supplemental Figure S2. Marker genes identified for sub-populations of stele clusters.
Supplemental Figure S3. XPP developmental trajectories.
Supplemental Figure S4. Venn diagram visualizing overlap of genes between DEG calling methods and expression map for selected genes enriched in XPP or LRP.
Supplemental Figure S5. Comparison of XPP and LRP DEGs from the single-cell library to bulk transcriptomes.
Supplemental Figure S6. Design of the J0121Col≫dCas9R system to generate cell-type-specific dCas9-repressor mediated knockdown of candidate gene expression.
Supplemental Figure S7. Example seedling traces from J0121Col≫dCas9R perturbation lines.
Supplemental Figure S8. Transcriptional reporters of chromatin regulator candidate genes in wild -type and arf7 arf19 roots.
Supplemental Figure S9. Transcriptional reporters of cell cycle candidate genes in wild -type and arf7 arf19 roots.
Supplemental Figure S10. Transcriptional reporters of stemness candidate genes in wild -type and arf7 arf19 roots.
Supplemental Figure S11. Marker gene expression profiles and experiment breakdown of cortex, endodermis, and lateral root endodermis cells.
Supplemental Figure S12. Overlapping DEGs identified using different methods for endodermis/lateral root endodermis analyses.
Supplemental Figure S13. Pseudotime analysis of endodermis to lateral root endodermis cells.
Supplemental Table S1. Breakdown of cell types by experiment.
Supplemental Data Set S1. XPP , LRP , and mature pericycle DEG analysis sheet and GO terms.
Supplemental Data Set S2. Cloning primers for generation of plasmids used to generate reporter and J0121Col≫dCas9R transgenic lines.
Supplemental Data Set S3. Cortex, endodermis, and lateral root endodermis DEG analysis sheet and GO terms.
Supplemental File S1. ANOVA and t-test results.
A.L., H.P.G., C.Q., J.T.C., and J.L.N. designed the research; H.P.G., A.L., S.G., J.C.C., J.E.Z., W.G., and J.T.C performed research; A.L., H.P.G., K.J.B., J.T.C., and J.L.N. analyzed data; and A.L., H.P.G., K.J.B., and J.L.N. wrote the manuscript.
The author responsible for distribution of materials integral to the findings presented in this article in accordance with the policy described in the Instructions for Authors (https://dbpia.nl.go.kr/plcell) is: Jennifer L. Nemhauser ([email protected]).
Acknowledgments
We would like to thank members of the Nemhauser, Queitsch, Trapnell, Steinbrenner, and Imaizumi groups for helpful discussions and technical guidance. We are grateful for the generosity of Dr. Dolf Weijers and his group for hosting A.L. to work on TMO6, as well as for Dr. Bert De Rybel’s sharing of TMO6 reporter lines.
Funding
This work was supported by the National Institutes of Health (R01-GM107084; J.L.N.; R01-GM079712, C.Q. and J.C.), the Howard Hughes Medical Institute Faculty Scholars Program (J.L.N.), and the National Science Foundation (IOS-1748843; C.Q. and J.C.). A.L. was supported by an NSF Graduate Research Fellowship (DGE-1256082), and S.G. was supported by an EMBO Post-doctoral Award (ALTF 409-2019). K.J.B. was supported by the University of Washington National Institutes of Health Big Data for Genomics and Neuroscience Training Grant T32LM012419).
Conflict of interest statement. The authors declare no conflict of interest.
References
Author notes
Hardik P. Gala, Amy Lanctot and Ken Jean-Baptiste contributed equally to the work.
Senior Author.
