


Abstract
Most annual studies of tintinnid and phytoplankton in coastal habitats are influenced by alien species introduced by water masses exchange, and therefore cannot be used as direct evidence for exploring the mechanism of annual succession in indigenous community. For brackish communities, very limited annual studies exist because of the difficulty of conducting stable sampling in the transition between freshwater and seawater. The special topography of Xiangshan Bay isolates the external water mass and provides a suitable habitat for exploring the annual succession mechanism of the brackish tintinnid community. In this study, samples were collected from seven stations in Tie Harbor, Xiangshan Bay (East China Sea) during 10 months from 2022 to 2023. A total of 23 tintinnid species of five genera were identified throughout the year. These tintinnid species can be clustered into four seasonal groups, winter, summer, autumn and spring-autumn, with three temperature preferences. The Lorica Oral Diameter (LOD) size-class of each tintinnid species, which determines the food item size of tintinnid, separated their different ecological niches within each seasonal group. The seasonal succession of tintinnid community in Xiangshan Bay was organized by both temperature preference and LOD size of the tintinnid species.
INTRODUCTION
Tintinnids, planktonic ciliates with durable lorica (Lynn, 2008), are ubiquitous in marine habitats (Liang et al., 2018; Li et al., 2021, 2022), estuaries (Godhantaraman, 2003; Smith et al., 2018) and freshwaters (He et al., 2022) with varying salinities. With over 900 recorded species (Zhang et al., 2012), tintinnids are important feeders of pico/nanoplankton and model organisms for plankton ecology studies (Dolan, 2013).
Estuaries are complex environments influenced by human activities and natural action (Cloern and Jassby, 2012), with varying geomorphological and hydrological characteristics in different regions around the world (Kennish, 2002). Dramatic fluctuations in salinity are the most prominent environmental feature controlling the distribution of plankton in estuaries (Laprise and Dodson, 1994). Freshwater, brackish and marine tintinnid species occurred sequentially along a salinity gradient from upstream freshwaters to polyhaline waters (Li et al., 2019).
Annual variations of tintinnid communities have been studied at over 40 coastal or estuarine sites (Table 1). Most sites had a broad range of salinities, indicating changes in water mass during the annual sampling period. In these studies, imports of fresh water and connected ocean currents brought in different tintinnid species to the fixed sampling stations. For example, research showed that salinity of the eastern Adriatic Coast ranged from 1.7 to 38.8 through a year (Kršinić, 1987). Thus, the annual variation of tintinnid community is in fact a change of brackish and coastal assemblages, rather than a seasonal succession of a specific community. Only in a few specific estuaries with weak water exchange (low salinity shift), the annual variation of tintinnid may be attributed to seasonal succussion, such as the coastal water in Mission Bay (salinity 30–35, Elliott and Kaufmann, 2007) and Kaštela Bay (salinity 34–38, Bojanić et al., 2001). To the best of our knowledge, only one study reported the annual succession of brackish tintinnid community in Narragansett Bay (salinity 28–30, Hargraves, 1981).
Studies of annual tintinnid variation in estuaries and coastal areas
| Study sites | Latitude | Sampling time | Sampling frequency | Temperature/°C | Salinity | References |
|---|---|---|---|---|---|---|
| Annual variation (totally 32 studies) | ||||||
| Parangipettai, southeast coast of India | 11°N | 1994.1–1994.12 | monthly | 22.5–33.8 | 2.9–34.5 | Godhantaraman (2002) |
| Coastal waters of south Andaman, Andaman Sea | 11°N | 2012.9–2013.8 | monthly | 25–35 | 7–35 | Sai Elangovan and Padmavati (2017) |
| Hooghly (Ganges) River Estuary, coastal part of India | 21–22°N | 2013.3–2014.2 | monthly | 19–34 | 0.1–22.5 | Rakshit et al. (2016) |
| Hooghly Estuary, India | 21–22°N | 2012. 3–2014.8 | monthly | 15–35.5 | 0–35 | Rakshit et al. (2017) |
| Topolobampo-Santa Maria-Ohuira lagoon complex, Gulf of California | 25°N | 2004.11–2006.2 | monthly | 12–30 | 30–40 | Martínez-López et al. (2019) |
| Gulf of Hat (Aqaba), Red Sea | 29°N | 1974.6–1975.6 | monthly | 20–26 | — | Kimor and Golandsky-Baras (1981) |
| Egyptian Mediterranean coast of Damietta, Egypt | 31°N | 2007.1–2007.12 | biweekly | 12.5–31 | 0.3–32.9 | Dorgham et al. (2013) |
| Western Harbor, Egypt | 31°N | 2012.2–2012.11 | seasonal | — | — | Heneash et al. (2015) |
| Hiroshima Bay, Seto Inland Sea of Japan | 34°N | 1987.5–1990.4 | biweekly | 9.5–26.4 | 11.3–33.2 | Kamiyama and Tsujino (1996) |
| Gulf of Gabes, Tunisia | 33–35°N | 2006.3–2007.2 | monthly | 13.6–32.2 | 33–52 | Kchaou et al. (2009) |
| Lake Shinji, Ohashi River and Lake Nakaumi, Japan | 35°N | 1998.4–1999.3 | monthly | 6–29 | 2.2–30 | Godhantaraman (2003) |
| Southeastern coast of Korea | 35°N | 2008.5–2009.11 | intervals of 1.5 days | 6–26.7 | 13–33 | Baek et al. (2022) |
| Kuryongpo Harbor, East Sea | 35°N | 2001.2–2003.10 | seasonal | 10–25 | — | Kim et al. (2007) |
| Jiaozhou Bay, China | 36°N | 2007.6–2008.5 | biweekly | 1.4–27.5 | 20.4–32.2 | Jiang et al. (2011) |
| Sanggou Bay, China | 37°N | 2011.4–2012.1 | seasonal | 1.9–24.2 | 26.2–31.6 | Li et al. (2020) |
| Bahia Blanca estuary | 38°S | 1986.3–1987.2 | weekly | 5–24 | 15–41 | Barría de Cao (1992) |
| Bahia Blanca estuary | 38°S | 2002.3–2003.3 | half-monthly | 6–22.8 | 14–35 | Barría de Cao et al. (2005) |
| Zhangzi Island, Northern Yellow Sea, China | 39°N | 2009.7–2010.6 | monthly | 0.3–26.1 | 29.8–32.4 | Yu et al. (2013) |
| New York Bight | 40°N | 1973.8–1974.8 | monthly | 4–23 | — | Gold and Morales (1975) |
| Bay of Blanes (NW Mediterranean Sea) | 41°N | 1992.3–1995.2 | weekly & biweekly | 11–26 | — | Vaqué et al. (1997) |
| Narragansett Bay | 41°N | 1980.2–1982.12 | weekly | 0–24 | — | Verity (1987) |
| Kaštela Bay (middle Adriatic Sea) | 43°N | 1998.1–1999.11 | monthly | 9–27 | 32–38.5 | Bojanić et al. (2012) |
| Damariscotta River estuary, Maine, USA | 43°N | 1981.3–1982.5 | monthly | −0.8-21.6 | 24–34 | Sanders (1987) |
| Neretva Channel, Adriatic Sea | 43°N | 1998.5–1999.10 | monthly | 9–25 | 29–38 | Vidjak et al. (2007) |
| Nervión River estuary, Basque Country, Spain | 43°N | 2000.3–2002.3 | monthly | 10–22 | 5.2–34.8 | Urrutxurtu (2004) |
| 10 bays along the eastern Adriatic Coast | 42–44°N | 1981.11–1982.12 | monthly | 4.1–28.3 | 1.7–38.8 | Kršinić (1987) |
| Quoddy Region of the Bay of Fundy, Canada | 45°N | 1983.5–1984.3 | weekly & monthly | — | — | Middlebrook et al. (1987) |
| Gulf of Trieste, Northern Adriatic Sea | 45°N | 1998.7–2016.7 | weekly & monthly | — | — | Monti-Birkenmeier et al. (2019) |
| Kiel Bight, Baltic Sea | 54°N | 1973.1–1974.4 | intervals of a few days to 2–3 weeks | — | — | Smetacek (1981) |
| Borge Bay, east coast of Signy Island | 60°S | 1990.4–1991.5 | monthly | −1.9-1.3 | — | Leakey et al. (1994) |
| Admiralty Bay, King George Island | 62°S | 1990.2–1991.1 | half-monthly | — | — | Wasik and Mikolajczyk (1994) |
| Seasonal succession-coastal community (totally 10 studies) | ||||||
| Mission Bay, San Diego, California | 32°N | 2002.7–2004.6 | biweekly | 12–25 | 30–35 | Elliott and Kaufmann (2007) |
| North Lebanon coast | 34°N | 1991.3–1992.2 | monthly | 16–28 | 38.7–39.6 | Abboud-Abi Saab (2002) |
| Jiaozhou Bay, China | 36°N | 2003.5–2012.12 | monthly | 2.2–26.4 | 28–32 | Feng et al. (2018) |
| Gulf of Naples, Italy (Tyrrhenian Sea) | 35–40°N | 1997.1–2001.5 | weekly | 14.2–27.8 | 36–38 | Modigh and Castaldo (2002) |
| Southern Tyrrhenian Sea (Western Mediterranean) | 38°N | 2003.3–2004.5 | half-monthly | 13–27 | 37.4–38.6 | Sitran et al. (2008) |
| Coastal Ionian Sea, Central Mediterranean | 38°N | 2003.3–2004.4 | half-monthly | 15–27.8 | 38–39 | Sitran et al. (2007) |
| Kaštela Bay (central Adriatic Sea) | 43°N | 1995.1–1995.11 | monthly | 11–24 | 34–38 | Bojanić et al. (2001) |
| West part of Kaštela Bay | 43°N | 1995.1–1995.11 | monthly | 10–24 | 34–38 | Bojanić (2001) |
| Akkeshi Bay, Japan | 43°N | 1972.4–1973.4 | monthly | 3–17 | 31.2–33.3 | Taguchi (1976) |
| Eutrophicated part of Kaštela Bay (middle Adriatic Sea) | 43°N | 1998.1–1999.1 | monthly | 10–24 | 34–38 | Bojanić et al. (2005) |
| Seasonal succession-brackish community (1 study) | ||||||
| Narragansett Bay, Rhode Island, U.S.A. | 41°N | 1976.3–1976.11 | weekly | 5–25 | 28–30 | Hargraves (1981) |
Xiangshan Bay (Fig. 1) is an elongated, shallow estuary ~60 km in length, 3 km in width at its narrowest point, and with an average depth of 10 m (Yang et al., 2018). Adjacent to the East China Sea, Xiangshan Bay is a subtropical estuary with annual water temperature varying from 9.0 to 28.7°C (Du et al., 2020). As the innermost part of Xiangshan Bay, Tie Harbor is isolated from the East China Sea, with a water-residence time of approximately 65–80 days (Li, 1999). The waters in Tie Harbor are brackish, with annual salinity ranging from 20 to 28 (Fan and Jin, 1989; Luo et al., 2018; Yang et al., 2018; Jiang et al., 2019).
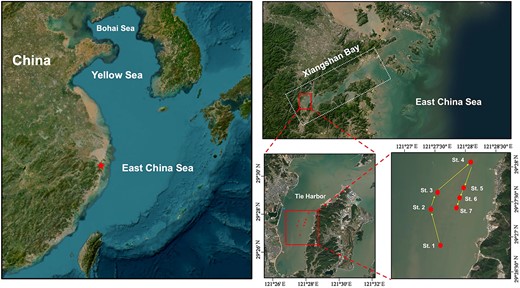
Sampling stations (dots) in Tie Harbor of Xiangshan Bay (star). The yellow arrows indicate the sampling sequence of the stations.
The species-rich assemblages of tintinnids are structured by their lorica oral diameter (LOD) size (Dolan et al., 2013). However, there has been no report on LOD size composition in existing studies of annual variation in tintinnid community. The aim of the present study is 2-fold: (i) to investigate the seasonal variation of tintinnid community in brackish water without disturbance of water masses exchange and (ii) to determine the seasonal organization of tintinnid community by temperature preference and LOD size of different tintinnid species.
MATERIAL AND METHODS
Sample collection
Samples were collected at 7 stations (St. 1, St. 2…St.7; 29°26′30″N-29°28′00″N, 121°27′00″E-121°28′30″E) in Tie Harbor of Xiangshan Bay (Fig. 1) over a 10-months period (13 January, 27 February, 27 March, 12 May, 28 June, 7 August, 8 September, 23 October, 3 December 2022 and 4 January 2023) aboard a fishing vessel Ningqiaoyang 004. The depths of these sampling stations ranged from 1.2 to 8 m. Water temperature and salinity were measured at each station using a portable water quality analyzer HQ40D (HACH, USA). For chlorophyll a (Chl a) concentration determination, water samples of 100 mL were filtered onto 0.7-μm GF/F filters (Whatman®). The filters were frozen at −20°C until laboratory analysis. For tintinnids, 20 L of surface water was collected using a bucket at each station and then gently filtered through a net (mesh size 20 μm). The concentrated tintinnid samples (22–57 mL) were fixed with Lugol’s solution to 1% final concentration.
Laboratory procedures and data analysis
In the laboratory, chlorophyll was extracted from the filters with 90% acetone at −20°C in the dark for 24 h. The concentrations were determined using a Turner Design Fluorometer. A subsample (5–10 mL) of each tintinnid sample was settled in a Utermöhl counting chamber for at least 24 h (Utermöhl, 1958) and examined using an Olympus IX 73 inverted microscope (Olympus, Tokyo, Japan) at 100× or 400× magnification. Empty tintinnid loricae were counted in cell abundance because mechanical and chemical disturbance during collection and fixation can detach tintinnid protoplasts from the lorica. The LOD and lorica length (LL) of each tintinnid species were recorded for at least 20 individuals (Supplementary Table S1). Tintinnid species were determined according to lorica morphology and size based on literatures (Feng et al., 2018; Li et al., 2019).
Cluster analysis was performed using the software TB tools (Chen et al., 2020) based on environmental data and relative abundances of different tintinnid species. Figures and correlation analysis were performed by GraphPad Prism 9.
RESULTS
Hydrography
Mean surface seawater temperature on sampling dates fell in the range of 9.5 ± 0.6°C (January 2023) to 31.3 ± 0.2°C (August) (Fig. 2a). Except for March, which had an anomalously low salinity (14.6 ± 1.7) due to rainfall, the magnitude of salinity variation during the sampling period was small (20.8 ± 0.4–27.6 ± 0.4) (Fig. 2b). Mean surface Chl a concentration varied between 1.0 ± 0.1 μg/L (December) and 5.7 ± 0.7 μg/L (August), except for two exceptionally high values in January 2022 (26.2 ± 7.5 μg/L) and February (9.0 ± 4.0 μg/L) caused by phytoplankton bloom (Fig. 2c). Cluster analysis was performed based on temperature and salinity, and the 10 sampling months were categorized into two groups (Fig. 2d): cold months (< 20°C, January, February, March, December 2022 and January 2023) and warm months (> 20°C, May, October, June, August and September 2022) (Fig. 2e).
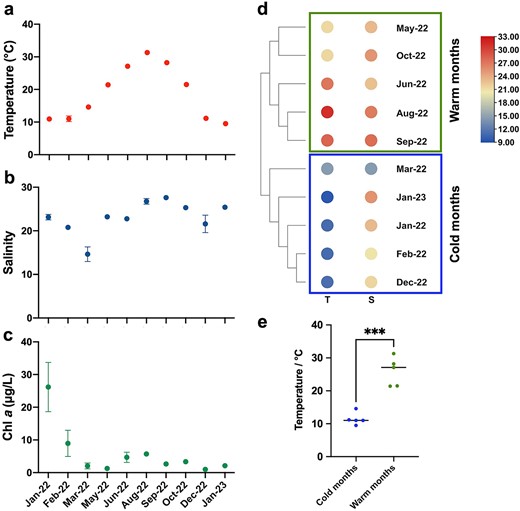
Annual variation of temperature (a), salinity (b) and chlorophyll a (Chl a) concentration (c) in Tie Harbor during January 2022 to January 2023. Data are averages of the 7 stations with standard deviation. (d) Two month-groups (cold months group and warm months group) based on temperature and salinity data using hierarchical agglomerative cluster analysis; (e) Significant different temperature of two month-groups based on t-test (P < 0.05).
Four seasonal tintinnid groups
A total of 23 tintinnid species in 5 genera were identified from 70 samples over a 10-months period (Fig. 3), including three unidentified species (Eutintinnus sp., Tintinnidium sp. 1 and Tintinnidium sp. 2). The maximum abundance of each species showed a positive correlation with the occurrence frequency (Supplementary Fig. S1). Four species were considered to be occasional species because they either occurred in only 1 month (Tintinnidium sp. 1, Tintinnopsis estuariensis, and T. corylicarpa) or had a maximum abundance <0.25 ind/L (Eutintinnus sp.) (Supplementary Fig. S1 and Fig. S6).
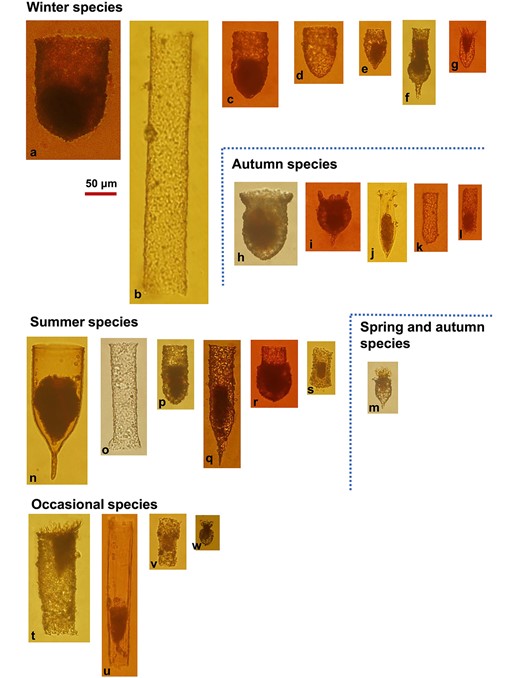
Photos of 23 tintinnid species observed in Tie Harbor. Tintinnids were categorized into four seasonal species groups (see Fig. 4) and an occasional species group: Winter species: (a) Tintinnopsis japonica; (b) Leprotintinnus simplex; (c) Tintinnopsis tubulosoides; (d) Tintinnopsis brasiliensis; (e) Tintinnopsis rapa; (f) Tintinnopsis tocantinensis; (g) Tintinnopsis beroidea; Autumn species: (h) Tintinnopsis schotti; (i) Tintinnopsis tentaculata; (j) Amphorellopsis acuta; (k) Tintinnopsis tubuformis; (l) Tintinnidium primitivum; Spring and autumn species: (m). Tintinnopsis amoyensis; Summer species: (n) Favella ehrenbergii; (o) Leprotintinnus nordqvisti; (p) Tintinnopsis digita; (q) Tintinnopsis radix; (r) Tintinnopsis chinglanenesis; (s) Tintinnidium sp. 2; Occasional species: (t) Tintinnopsis estuariensis; (u) Eutintinnus sp.; (v) Tintinnidium sp. 1; (w) Tintinnopsis corylicarpa.
The cluster of monthly abundance of 19 tintinnid species (excluding four occasional species) in the heatmap revealed two month-groups and four seasonal tintinnid groups (Fig. 4). The two month-groups, i.e. cold months group (December to March) and warm months group (May to October) were consistent with the result of cluster analysis based on temperature and salinity (Fig. 2).
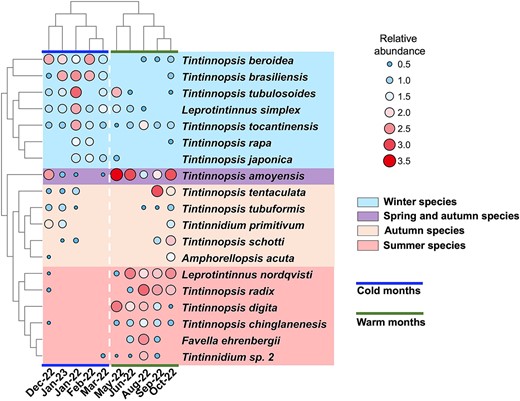
Cluster analysis of the average abundance of 19 tintinnid species in Tie Harbor, except for 4 occasional species. Tintinnid abundances were converted to log10(20*abundance+1) for statistical analysis. Tintinnids were clustered into four seasonal groups, i.e. winter species group, autumn species group, summer species group and spring and autumn species group. The 10 study months were clustered into cold months group and warm months group, the same as the cluster analysis in Fig. 2.
Tintinnids in four seasonal groups were:
(1) Winter group, which include Tintinnopsis beroidea, T. brasiliensis, T. tubulosoides, Leprotintinnus simplex, T. tocantinensis, T. rapa, and T. japonica. The total abundance of these species was maximum in January of 2022 (73.8 ± 32.1 ind/L) and minimum in September (0.6 ± 0.6 ind/L, Fig. 5a), and showed higher values at colder ambient temperatures (Fig. 5e). The seven winter species were predominantly abundant in cold months, with the highest abundance occurring in January and February when temperature was about 10°C (Supplementary Fig. S2). T. tocantinensis had the highest average abundance (11.1 ± 7.1 ind/L) in January, 2022 and was the most common species throughout the year (Supplementary Fig. S2f). T. rapa had the lowest occurrence frequency (30%) and the highest average abundance (1.9 ± 1.9 ind/L) in January, 2022 (Supplementary Fig. S1 and Fig. S2e). T. tubulosoides showed the highest average abundance (29.1 ± 13.3 ind/L) among all winter species in January, 2022 (Supplementary Fig. S2c).
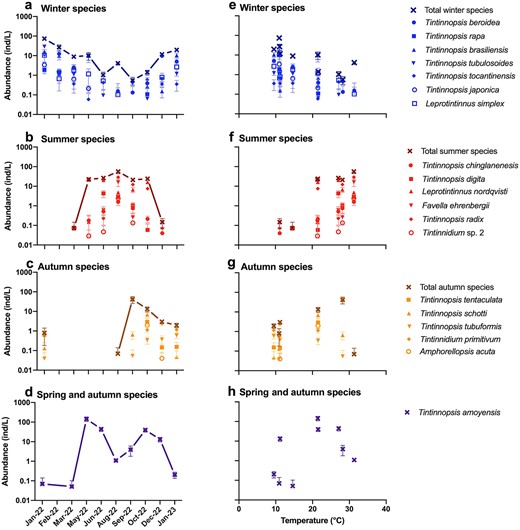
Abundance variation of four tintinnid seasonal groups across seasons (a-d) and temperature gradients (e-h).
(2) Summer group, which include T. chinglanenesis, T. digita, Leprotintinnus nordqvisti, Favella ehrenbergii, T. radix, and Tintinnidium sp. 2. These species were abundant mainly in warm months (Supplementary Fig. S3a-f) with a maximum total abundance (56.5 ± 35.2 ind/L) in August (Fig. 5b). The abundances of summer species showed higher values at warmer ambient temperature (Fig. 5f). Three summer species (F. ehrenbergii, T. radix and Tintinnidium sp. 2) had the highest average abundance in August (16.1 ± 16.7 ind/L, 28.8 ± 17.3 ind/L and 2.4 ± 2.1 ind/L), while L. nordqvisti and T. digita had the highest abundance in June (20.6 ± 8.9 ind/L) and May (22.1 ± 12.2 ind/L), respectively. Maximum abundance of summer species mostly occurred around 30°C (Supplementary Fig. S3g-l).
(3) Autumn group, which include Tetranchyroderma tentaculata, T. tubuformis, T. primitivum, T. schotti and Amphorellopsis acuta. These five species were observed from August to the following January, covering both cold and warm months (Fig. 5c). The highest average abundance of T. schotti and T. tentaculata was recorded in October (6.9 ± 5.5 ind/L) and September (40.6 ± 40.8 ind/L), respectively (Supplementary Fig. S4a, b). The average abundance of the other three species (T. tubuformis, T. primitivum, and A. acuta) was lower than 5 ind/L (Supplementary Fig. S4c-e). In terms of temperature preference, T. primitivum and T. tubuformis appeared at about 10°C, A. acuta and T. schotti had high abundance around 20°C, T. tentaculate showed the greatest abundance around 30°C (Supplementary Fig. S4f-j).
(4) Spring and autumn group which include a single specie T. amoyensis. T. amoyensis was found in nearly all months of the year and had two abundance peaks in May (144.5 ± 98.4 ind/L) and October (39.8 ± 24.4 ind/L, Supplementary Fig. S5a). The highest abundance of T. amoyensis appeared at about 20°C (Supplementary Fig. S5b).
Annual succession of tintinnid community
Total tintinnid abundance (Fig. 6a) showed three peaks in January, 2022 (74.6 ind/L), May (177.0 ind/L) and October (78.6 ind/L). This annual succession was attributed by the seasonal groups. The January 2022 peak arose from the high abundance of the winter group species, the May peak was resulted from the high abundance of spring and autumn group (T. amoyensis), and the October peak was raised by T. amoyensis, summer group species and autumn group species (Fig. 6a, b). The maximum value of species richness was 15, which occurred in October and included species from all four seasonal groups. The species richness minimum was 6, which occurred in February and included only winter group species (Fig. 6c).
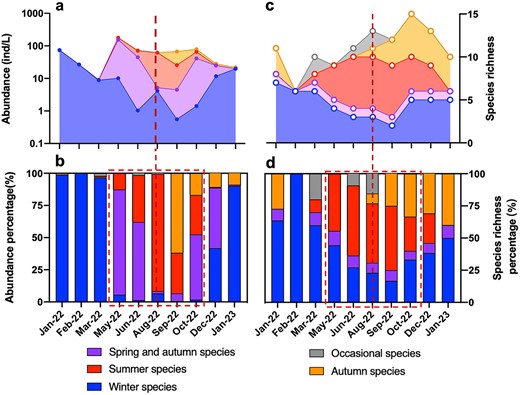
Variations of annual abundance (a), abundance percentage (b), species richness (c) and species richness percentage (d) of four tintinnid seasonal groups and the occasional species group.
Abundance percentage and species richness percentage of four tintinnid seasonal groups fluctuated with month (Fig. 6b and d). The abundance percentage of winter species was above 90% in most cold months, with 98.8%, 100%, 96.5% and 90.1% in January 2022, February, March and January, 2023, respectively (Fig. 6b). Winter species occurred all year round, with species number more than 50% in the cold months, except for 33.3% in December (Fig. 6d). Summer species appeared from March to December, among which August had the highest abundance percentage (91.0%) and species number (6) (Fig. 6b and c). Both abundance and species richness of summer species showed a trend of increasing first, reaching the peak in August, and then decreasing. Autumn species had the highest abundance percentage in September at 61.8% and lowest by January, 2023 at only 9.0% (Fig. 6b). The maximum species richness of autumn species occurred in October at 5. Spring and autumn species (T. amoyensis) was recorded in all months except February (Fig. 6d), with higher abundance percentage in the warm months of May, June, and October (Fig. 6b), accounting for 81.6%, 60.7% and 50.7%, respectively.
LOD size-classes of tintinnids in different seasonal groups
The average LOD of tintinnid species ranged from 18 μm (T. beroidea) to 122 μm (T. japonica) (Supplementary Table S1). Starting at 16 μm and with an incremental interval of 4 μm, the tintinnid species in Xiangshan Bay fell in 12 LOD size-classes (Fig. 7a-c). Species in the four tintinnid seasonal groups differed in LOD size-classes. Each winter group species had different LOD size-class ranged from 16–20 μm to 120–124 μm (Fig. 7a). For summer species, their LODs were mostly concentrated in three size-classes (28–32 μm, 32–36 μm and 36–40 μm), with F. ehrenbergii exhibiting the largest LOD in 76–80 μm size-class (Fig. 7b). The LODs of autumn species mainly centered in 2 size-classes (16–20 μm and 20–24 μm) except for T. tentaculata (41 μm) and T. schotti (63 μm) (Fig. 7c). LOD of the spring and autumn specie, T. amoyensis, was 20 μm which belonged to the smallest size-class 16–20 μm (Fig. 7c).
For tintinnids within the same seasonal group, most of the LOD size-classes had only one species, except in two cases: the 36–40 μm LOD size-class had three summer species (Fig. 7b) and the 20–24 μm size-class had two autumn species (Fig. 7c), respectively. This three summer species in the 36–40 μm LOD size-class, with peak abundances occurring in the same month, were sequentially dispersed over 3 months (Fig. 7d). The autumn species in the 20–24 μm LOD size-class showed the same pattern (Fig. 7e).
DISCUSSION
Scarce studies on the seasonal succession of tintinnids in brackish water
Annual variations of tintinnid communities were first recorded in New York Bight in 1975 (Gold and Morales, 1975). Since then, a total of 43 studies on the annual variation of tintinnid have been reported (Table 1). The latitudinal range of these study sites extends from 54°N (Kiel Bight of Baltic Sea) (Smetacek, 1981) to 62°S (Admiralty Bay of King George Island) (Wasik and Mikolajczyk, 1994). Most of the tintinnid annual variation studies variability have sampling sites with high variability in salinity. For example, in the Bahia Blanca estuary, salinity ranged from 15.0 to 34.1 (Barría de Cao, 1992). Research in the eastern Adriatic Coast (Kršinić, 1987) showed that salinity fluctuated between 1.7 and 38.8 through the year. If salinity varies greatly at the sampling site, the annual variation in tintinnid assemblages are in fact changes of brackish and coastal assemblages rather than seasonal succession of a specific community. As in one study in the Pearl River estuary, freshwater (salinity < 3), brackish (salinity 3–23), and coastal (>23) tintinnid communities occurred sequentially across a salinity gradient of 0–31 (Li et al., 2019).
Of the previous reports on seasonal variation of tintinnid (Table 1), only 11 studies with narrow salinity changes (<5) could be considered as the annual succession of indigenous tintinnid species in their habitats. Ten of them were located in coastal areas, such as the coastal waters in Mission Bay (salinity 30–35, Elliott and Kaufmann, 2007) and Kaštela Bay (salinity 34–38, Bojanić et al., 2001). Only one tintinnid study at Narragansett Bay with a salinity range of 28–30 could be considered as a brackish community (Hargraves, 1981). Due to its special location at the bottom of the narrow Xiangshan Bay, monthly samples from Tie Harbor could reveal the seasonal succession of tintinnid in a single water mass. With the annual salinity range of 20.8 to 27.6, this research provides valuable data for annual studies of tintinnid in brackish habitats.
Seasonal preference of tintinnid species
In this study, we were able to define four tintinnid seasonal groups in Xiangshan Bay, i.e. winter group, summer group, autumn group, as well as spring and autumn group. Several studies have shown discrete tintinnid groups in coastal waters. A long-term study of tintinnid in Jiaozhou Bay, western Pacific presented three seasonal groups occurring in winter, summer, and autumn (Feng et al., 2018). In Kaštela Bay, central Adriatic Sea, the dominant tintinnid species could be divided into winter, spring to autumn groups (Bojanić et al., 2001). Thus, different locations might have their own unique seasonally characterized groups of tintinnid species.
Monthly abundance variations of 96 tintinnid species have been documented in previous seasonal succession studies (Table 1). Eleven of the species in this research can be compared to those documented in the literature. Seasonal patterns appeared to be consistent for most species, although there were occasional exceptions.
As an important species in Xiangshan Bay, T. amoyensis occurred throughout the year with higher abundance during the mesothermal months (May and October, about 20.0°C). However, in Jiaozhou Bay, T. amoyensis occurred only in the first half of the year, where it was the core species in April and May at water temperatures of 10.0–15.0°C (Feng et al., 2018).
Some winter species in our study, such as T. brasiliensis and L. simples, showed similar seasonal occurrence to those in Jiaozhou Bay (Feng et al., 2018). Other winter species showed different seasonal occurrences from other sites in the literatures. Winter species T. beroidea preferred low temperatures (10.0°C), with peak abundance in February and December in this study. This temperature preference of T. beroidea was in accordance with that in Jiaozhou Bay, where its abundance was highest in April–July at temperatures of 10–20°C (Feng et al., 2018). In the Gulf of Naples, T. beroidea was also found to reach a peak of abundance in April when water temperature was >14.2°C (Modigh and Castaldo, 2002). The peak abundance of another winter species, T. tubulosoides, occurred in January when temperature was lower (10.0°C) in Xiangshan Bay. In Narragansett Bay (Hargraves, 1981), the maximum abundance (1000–5 000 ind/L) of T. tubulosoides occurred in April although the temperature was similar to those of the present study. However, in Jiaozhou Bay, T. tubulosoides was observed from July to December with a higher temperature preference of 10–25°C (Feng et al., 2018). Most notably, T. tocantinensis was considered a winter species in our study, with maximum abundance occurring at water temperatures around 10°C. In Jiaozhou Bay, however, T. tocantinensis was considered a warm-season species, with maximum abundance occurring in summer when water temperatures were >20°C (Feng et al., 2018).
Some autumn species in our study, such as A. acuta and T. primitivum, also showed the same seasonal occurrence in Jiaozhou Bay (Feng et al., 2018). Summer species L. nordqvisti, F. ehrenbergii, and T. radix in our study also occurred in the same season in Jiaozhou Bay (Feng et al., 2018) and Akkeshi Bay (Japan) (Taguchi, 1976).
Annual variation of total tintinnid abundance, species richness
In the present study, the seasonal distribution of total tintinnid abundance in Xiangshan Bay (29°N) exhibited two peaks (>75 ind/L) in spring (May) and autumn (October). The anomalous abundance peak in January 2022 may have been only a chance phenomenon related to a phytoplankton bloom (Cariou et al., 1999). This bimodal distribution pattern is consistent with some previous reports, such as in the Narragansett Bay (41°N, Hargraves, 1981), Kaštela Bay of the central Adriatic Sea (43°N, Bojanić et al., 2005), and on the northern coast of Lebanon (34°N, Saab, 2002). In other similar studies (Table 1), the total abundance of tintinnid did not show any seasonal pattern.
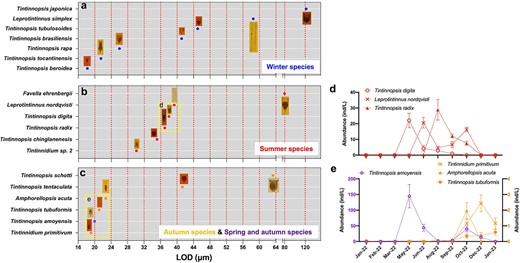
Lorica oral diameter (LOD) size-class of tintinnid species in different seasonal groups (a-c) and the abundance variations of different tintinnid species in the same LOD size-class (d, e).
Dolan et al. (2013) suggested that tintinnid species richness was typically highest during the transitional period between winter and summer. This study showed that the tintinnid community, which was composed of species from all four seasonal groups, had the highest species richness (15 species) in autumn (October). This result was the overlap of the four tintinnid seasonal groups during the transitional period between winter and summer. The tintinnid community in Narragansett Bay showed the highest species richness in late spring, late summer, and early autumn (Hargraves, 1981). Sitran et al. (2008) also found that the species richness of tintinnid in the Southern Tyrrhenian Sea was low (less than 10 species) throughout the summer and high (24 species) in autumn. Thus, our result, together with the two studies mentioned above, support the suggestion of Dolan et al. (2013). However, some studies did not show species richness peak in spring and autumn. For example, in Jiaozhou Bay, the highest richness was in summer, and the species richness was positively correlated with temperature (Feng et al., 2018).
Seasonal succession mechanism of plankton communities
In this study, we showed that the tintinnid community in Xiangshan Bay was firstly divided into four seasonal groups with different temperature preferences, and secondly, the species among each group avoided food competition by occupying different LOD sizes.
Some tintinnid species of the winter group and spring and autumn group could be observed in samples from all seasons. In contrast, tintinnid species from the summer group and spring group appeared only in the warmer months and disappeared in the colder months (Fig. 5 and Fig. S2-S5). But their abundance increased rapidly within a short period after emergence when the water warms up. This may be due to the fact that the summer group species and spring group species are high- and moderate-temperature preferring species. They produce dormant cysts under adverse low temperature conditions. And the dormant cysts germinate rapidly when the temperature is favorable (Yu et al., 2023). Our study suggests that temporally, at any given time, the tintinnid community is composed of species from the four different seasonal groups, one of which is dominant. This observation is similar to the spatial organization of tintinnid community in the subtropical and tropical oceans. At any site along the Atlantic meridional transect spanning 90 latitudes, the tintinnid community is composed of species from four spatial groups, i.e. equatorial group, gyre group, frontal group, and deep Chl a maximum group, with different dominances (Li et al., 2023).
Feeding is a direct factor affecting interspecific competition. LOD is the most important classification index of tintinnids and the basis for measuring their feeding capacity. In our study, LOD size-classes of tintinnids (Fig. 7) were classified following the existing LOD grading method (binned every 4 μm intervals) (Dolan et al., 2006). The size of LOD which was about 4 times the size of the preferred food items (Dolan et al., 2002), determines the maximum size of food particles ingested by tintinnids (Heinbokel, 1978). Therefore, each LOD size-class of tintinnids could be regarded as an ecological niche. Our result showed that the LOD of tintinnid species in each seasonal group were mostly diversified, and a few species with similar LOD in the same group also showed abundance peaks in different months. These LOD distribution patterns indicated that the tintinnid community is in a state of non-equilibrium fluctuation, maintaining species richness and food utilization through regular interspecies ecological niche.
Implication to phytoplankton community organization
Accounting for more than half of the total primary production in estuaries and coastal regions around the globe (Cloern et al., 2014), phytoplankton have similar seasonal succession patterns to tintinnids. However, the number of studies on the annual abundance variation of each phytoplankton species is very limited (Supplementary Table S2). The best dataset was at Oosterschelde, Netherlands, where Bakker et al. (1990) reported the weekly abundance variation of 139 phytoplankton species over a four-year period (1982–1984, 1986). Sabancı and Koray (2011) reported the seasonal occurrence of 115 phytoplankton species in the Izmir Bay, Eastern Aegean in three years (1998, 2000, 2001). With the exception of these two studies, most of the other studies in Supplementary Table S2 reported only the annual abundance variation of dominant phytoplankton species. For example, Schlüter et al. (2012) the long-term variation of only three phytoplankton species from 1962 to 2008 and analyzed their phenology changes. Karentz and Smayda (1984) reported 30 dominant phytoplankton species in Narragansett Bay from 1959 to 1980. Cadee (1986) reported the seasonal patterns of 23 phytoplankton species in the Wadden Sea from 1969 to 1985. Most of these studies pointed out that water mass mixing might lead to samples being collected from different water masses, and thus these results were unlikely to be a seasonal succession of a particular community. Due to the similar unicellular nature of tintinnid and phytoplankton, the organization of tintinnid community by species temperature preference from this study might also be applicable to phytoplankton communities.
CONCLUSION
In summary, the annual succession of tintinnid communities in a brackish isolated embayment exhibited an overlapping of four seasonal groups, which were influenced by temperature seasonal fluctuation. Within each group, tintinnid avoided competition by grazing on different-sized food items. The temperature preference and LOD diversification explained the year-round coexistence of tintinnid species. This study fills in the gap in the study of seasonal succession of brackish water tintinnid communities, and provides a new perspective for revealing the seasonal succession mechanism by integrating environmental factors and species characteristics.
FUNDING
National Key Research and Development Program of China (No. 2022YFC3105301), Natural Science Foundation of Zhejiang Province (LY22D060006), the CNRS-CAS International Research Project-Dynamics and Function of Marine Microorganisms (IRP-DYF2M): Insight from Physics and Remote Sensing, Project of State Key Laboratory of Satellite Ocean Environment Dynamics, Second Institute of Oceanography (SOEDZZ2202), and Project of Long-term Observation and Research Plan in the Changjiang Estuary and Adjacent East China Sea (LORCE, SZ2001).
DATA AVAILABILITY
All data were already reflected in the manuscript, figures, tables, and supplementary material. The original data that support the findings of this study are available upon reasonable request.
REFERENCES
Author notes
Jingyuan Li and Ping Du contributed equally to this work.
