


Abstract
In this study, we investigated the potential role of the karrikin receptor KARRIKIN INSENSITIVE2 (KAI2) in the response of Arabidopsis seedlings to high-temperature stress. We performed phenotypic, physiological and transcriptome analyses of Arabidopsis kai2 mutants and wild-type (WT) plants under control (kai2_C and WT_C, respectively) and 6- and 24-h heat stress conditions (kai2_H6, kai2_H24, WT_H6 and WT_H24, respectively) to understand the basis for KAI2-regulated heat stress tolerance. We discovered that the kai2 mutants exhibited hypersensitivity to high-temperature stress relative to WT plants, which might be associated with a more highly increased leaf surface temperature and cell membrane damage in kai2 mutant plants. Next, we performed comparative transcriptome analysis of kai2_C, kai2_H6, kai2_H24, WT_C, WT_H6 and WT_H24 to identify transcriptome differences between WT and kai2 mutants in response to heat stress. K-mean clustering of normalized gene expression separated the investigated genotypes into three clusters based on heat-treated and non-treated control conditions. Within each cluster, the kai2 mutants were separated from WT plants, implying that kai2 mutants exhibited distinct transcriptome profiles relative to WT plants. Gene Ontology and Kyoto Encyclopedia of Genes and Genomes enrichment analyses showed a repression in ‘misfolded protein binding’, ‘heat shock protein binding’, ‘unfolded protein binding’ and ‘protein processing in endoplasmic reticulum’ pathways, which was consistent with the downregulation of several genes encoding heat shock proteins and heat shock transcription factors in the kai2 mutant versus WT plants under control and heat stress conditions. Our findings suggest that chemical or genetic manipulation of KAI2 signaling may provide a novel way to improve heat tolerance in plants.
Introduction
Increases in growth temperature beyond an optimum range may elicit stress responses in plants, including protein misfolding and aggregation, accumulation of reactive oxygen species and alterations in the lipid membrane structure, resulting in increased membrane damage (Lippmann et al. 2019, Li et al. 2020a). Almost all plant species have developed a robust signal transduction system that allows them to sense fluctuations in ambient temperatures and consequently adjust their cellular functions and metabolism to evade heat-stress-induced damage (Abdelrahman et al. 2020a, 2020b, Losa et al. 2022). Signaling molecules, including phytohormones, are known to participate in eliciting plant responses to various biotic and abiotic stresses, including high temperatures (Wang et al. 2017a). For example, the silencing of genes associated with the biosynthesis of strigolactones (SLs), like CARTENOID CLEAVAGE DIOXYGENASE (SlCCD7 and SlCCD8) and MORE AXILLARY GROWTH 1 (SlMAX1), or their signaling, like MORE AXILLARY GROWTH 2 (SlMAX2) in tomato (Solanum lycopersicum), increased the susceptibility of transgenic plants to heat stress compared with wild-type (WT) plants (Chi et al. 2021). On the other hand, the supplementation of GR245DS, a synthetic molecule of SLs, to both WT and cdd7 mutant roots induced the accumulation of heat shock protein 70 (HSP70) and increased the transcript levels of genes involved in abscisic acid (ABA) biosynthesis [e.g. 9-CIS EPOXY CAROTENOID DIOXYGENASE 6 (NCED 6)] and responses [e.g. Lycopersicon esculentum DEHYDRIN 4 (Le4) and ABA-RESPONSIVE ELEMENT BINDING FACTOR 4 (ABF4)], as well as the activities of key antioxidant enzymes, which ultimately improved heat tolerance in tomato WT and cdd7 mutant plants (Chi et al. 2021). Likewise, Wang et al. (2018) showed that elevated temperature inhibited seed germination in both Arabidopsis WT and the karrikin (KAR, a signaling molecule) or yet-unknown endogenous ligand–receptor KARRIKIN INSENSITIVE2 (kai2) mutant plants, with the kai2 mutant being more significantly sensitive, which implies that KAI2 signaling may play an important role in plant response to heat stress (Wang et al. 2018). Therefore, investigation of the underlying molecular mechanisms of signaling-molecule-mediated heat responses may lead to the identification and/or development of heat-tolerant varieties of agriculturally important crops (Abdelrahman et al. 2017, Wang et al. 2017, Li et al. 2020b).
KARs are a group of butenolide small compounds produced from the smoke of burnt or charred plant materials and are thought to be important promoters of seed germination in many plant species, even of those not associated with fire or fire-prone environments, like Arabidopsis (Flematti et al. 2011, Nelson et al. 2012, Smith and Li 2014). The initial step of KAR signal transduction involves the binding of KARs to KAI2 protein, which is an α/β-fold hydrolase protein with conserved Ser-His-Asp catalytic triads that are important for KAI2 signaling activity (Waters et al. 2012, Guo et al. 2013). However, KARs might be modified in the plants before they can be recognized by KAI2 (Yao et al. 2021, Sepulveda et al. 2022). Activation of KAI2 by an unknown endogenous KAI2 ligand (KL) or a putative KAR metabolite recruits its association with an F-box MAX2 ubiquitin ligase, which functions as an adaptor to confer substrate specificity to the Skp1-Cullin-F-box (SCF) E3 ubiquitin ligase complex (Nelson et al. 2011, Stanga et al. 2013). The KAI2–MAX2–SCF complex interacts with transcriptional corepressors, namely SUPPRESSOR OF MAX2 1 (SMAX1) and SMAX1-LIKE (SMXL2), leading to their degradation by the 26S proteasome and releasing KAR-responsive genes and consequently resulting in KAR-regulated phenotypes, including decreased hypocotyl elongation, increased cotyledon expansion and increased root hair density and elongation (Nelson et al. 2010, Waters et al. 2012, Khosla et al. 2020). It was recently reported that the degradation of SMAX1/SMXL2 increases the expression of KARRIKIN-UPREGULATED F-BOX1 (KUF1) that positively regulates KL biosynthesis and conversion of KAR1 into a bioactive signal, producing additional ligands for KAI2 (Sepulveda et al. 2022). Likewise, the receptor of SLs, DWARF14 (D14), shows homology to KAI2 and uses a parallel signaling cascade that requires the function of the MAX2-based SCF complex for the degradation of corepressors SMXL6, 7 and 8, which belong to the same protein family as SMAX1/SMXL2 (Nelson et al. 2011, Waters et al. 2012, Guo et al. 2013, Cardinale et al. 2018).
Several studies have reported the roles of both SL and KAR pathways in regulating plant architecture and stress responses. For example, both KARs and SLs are active during photomorphogenesis and both can inhibit hypocotyl elongation in the light (Nelson et al. 2012, Waters et al. 2012). SLs suppress the development of lateral roots (LRs) in Arabidopsis (Jiang et al. 2016) and adventitious roots in pea (Pisum sativum) and Arabidopsis (Rasmussen et al. 2012). Likewise, KARs have been implicated in the regulation of root architecture such as the suppression of LRs and root–shoot junction roots in Arabidopsis (Swarbreck et al. 2020). Both D14 and KAI2 signaling pathways positively regulate Arabidopsis adaptation to drought, with KAI2 signaling showing a greater role overall (Li et al. 2020c). Despite their similarity, KARs and SLs are not interchangeable signals in plants. For example, SLs do not promote the germination of Arabidopsis seeds, while KARs cannot rescue the excess branching phenotype of SL-deficient mutants (Scaffidi et al. 2014). It is worth mentioning that KAI2 family members have undergone numerous duplication events, and D14 was found to be an ancient duplication in the KAI2 receptor in the seed plant lineage followed by subfunctionalization of the receptor, enabling SL perception (Toh et al. 2015, Xu et al. 2016, Swarbreck et al. 2019, Guercio et al. 2022).
An early study demonstrated that KAI2 plays a positive regulatory role in stomatal closure, membrane integrity, anthocyanin biosynthesis and cuticle formation, which collectively contributed to Arabidopsis adaptation to drought stress (Li et al. 2017). Transgenic Arabidopsis plants overexpressing Sapium sebiferum KAI2 (SsKAI2) gene showed increased contents of total soluble sugars and proline and upregulated expression of cold-stress-related genes, resulting in better adaptation to cold stress (Afzal Shah et al. 2021). More recently, KAI2 was reported to promote Arabidopsis root hair elongation under low-phosphate conditions by controlling the accumulation of AUXIN TRANSPORTER PROTEIN 1 and the auxin exporter PIN-FORMED 2 (Villaécija-Aguilar et al. 2021). These reports suggest that KAI2 may participate in plant responses to multiple abiotic stresses, including temperature stresses. To prove this hypothesis, in the present study, we first examined survival rates and several physiological parameters of the kai2 mutant and WT plants in response to heat stress conditions. Next, we performed comparative transcriptome analysis of WT and the kai2 mutant seedlings before and after 6- and 24-h heat stress treatments to identify transcriptome differences between WT and the kai2 mutants in response to heat stress. Our results demonstrate a positive regulatory role of KAI2 in Arabidopsis plant survival under heat stress conditions and uncover possible physiological and molecular mechanisms that underpin its function.
Results
The kai2 mutants exhibit a more severe heat-sensitive phenotype than WT plants
To compare the heat stress tolerance of 10-day-old WT and kai2 mutant plants, we first evaluated their survival rates under continuous heat stress (40°C) conditions for 5 d using the ‘same tray’ method (Fig. 1A, C). Our result revealed that after 5 d of heat stress, WT plants had a considerably higher survival rate (81.0%) than the kai2 mutant plants (15.6%) (Fig. 1A, C). Furthermore, the kai2 mutants showed higher leaf surface temperatures than WT at 6 and 24 h of heat stress treatments (Fig. 1B, D). Next, we measured the electrolyte leakage (EL) percentages to assess the cell membrane integrity in the kai2 and WT plants under heat stress. We found that the kai2 mutant plants had significantly higher (24.1%) EL than WT (17.4%) plants after 24 h of heat stress (Fig. 1E). These results collectively indicate that KAI2 acts as a positive regulator of heat stress tolerance, and the disruption of KAI2 signaling increased the heat sensitivity of Arabidopsis plants.
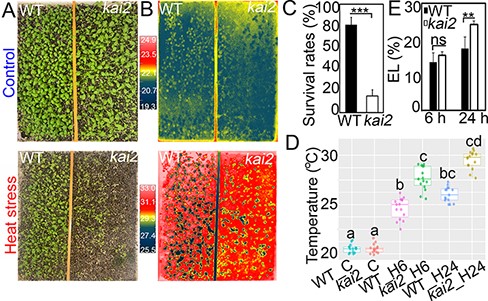
Phenotypes and survival rates of 10-day-old Arabidopsis kai2 mutant and WT plants grown for 5 d under continuous heat stress (40°C) and control (23°C) conditions. (A) Phenotypes of the investigated genotypes after 5-day exposure to control (upper panel) and heat stress (lower panel) conditions. (B) Thermography images of the two genotypes after 24-h exposure to control (upper panel) and heat stress (lower panel) conditions. (C) Survival rates (%) of the investigated genotypes after 5-day exposure to heat stress. Values represent means and SDs calculated from three independent replicates (n = 3, 45 plants per genotype per replicate). Asterisks indicate a significantly higher survival rate of WT compared with the kai2 mutant plants (***P < 0.001; Student’s t-test). (D) Leaf surface temperatures of the two genotypes under control (WT_C and kai2_C), and 6- and 24-h heat stress (WT_H6, kai2_H6, WT_H24 and kai2_H24, respectively) conditions as calculated from three replicates (n = 3, 15 plants per genotype per replicate). Different letters indicate significant differences between the kai2 and WT plants in response to heat stress at P < 0.05, using analysis of variance (ANOVA) with post hoc Tukey Honestly Significant Difference (HSD) test. (E) EL percentages of the kai2 and WT plants after 6- and 24-h heat stress treatments. Data represent the means and SDs calculated from three replicates (n = 3, 15 plants per genotype per replicate). Asterisks indicate significantly higher EL% of the kai2 mutant compared with WT plants (**P < 0.01; Student’s t-test). ns, nonsignificant.
Overview of gene expression profiles of Arabidopsis WT and kai2 mutant plants in response to heat stress
Genome-wide variations in gene expression levels in Arabidopsis WT and kai2 mutants in response to heat stress at 6 and 24 h (WT_H6, WT_H24, kai2_H6 and kai2_H24, respectively) and control conditions (WT_C and kai2_C, respectively) were assessed using microarray technology. Results of transcriptome analysis of the investigated genotypes are provided in Table S1 and deposited in Gene Expression Omnibus database (GSE200100). To obtain an overview of the main patterns of transcriptome changes, we first performed K-mean clustering algorithm using all normalized gene expression data of WT_C, WT_H6, WT_H24, kai2_C, kai2_H6 and kai2_H24 (Fig. 2A). This multivariate statistical analysis minimized multidimensional gene expression of more than 34,775 genes into a smaller set of variables and clustered genotypes according to the similarities in their expression profiles (Fig. 2A). First principal component (PC1) explains the greatest amount of variability in gene expression (55%), while lower proportion of variance (18%) was captured by PC2 (Fig. 2A). The greater amount of variability in gene expression was mainly driven by heat stress effect, and the investigated genotypes were separated into three clusters (Fig. 2A). Cluster I contained WT_C and kai2_C and cluster II contained WT_H6 and kai2_H6, whereas cluster III contained WT_H24 and kai2_H24 (Fig. 2A). Although the heat stress effect displayed profound changes in gene expression than the genotype effect, the kai2 mutant was separated from WT plants under both heat stress and control conditions in the three clusters (Fig. 2A), implying that the transcriptome changes in kai2 mutants is different from WT plants under the respective conditions. Random forest variable importance model was then conducted to identify the important transcripts that contributed to the predicted three clusters (Fig. 2B). The mean decrease accuracy is the measure of the performance of the model (Olden et al. 2004), and higher values indicate the importance of those transcripts in the model prediction (Fig. 2B). For example, RAB GTPASE-LIKE PROTEIN E1E (RABE1e), TUDOR/PWWP/MBT SUPERFMAILY PROTEIN (AT1G51745), GDSL ESTERASE LIPASE (AT5G18430), CHLOROPHYLL A/B BINDING PROTEIN 1 (CAB1), CYSTEINE-RICH RECEPTOR-LIKE PROTEIN KINASE 21 (CRK21), CYTOCHROME P450 (CYP96A5), PHOSPHOGLYCERATE MUTASE-LIKE PROTEIN (AT2G17280), 40S RIBOSOMAL PROTEIN S8-2 (AT5G59240) and DEFENSIN-LIKE PROTEIN 207 (AT5G33355) transcripts were highly associated with kai2_C, kai2_H6 and/or kai2_H24 (Fig. 2B). Hierarchical clustering also separated the investigated genotypes into three clusters similar to K-mean analysis (Fig. 2C). Finally, the genotype–genotype correlation heatmap showed high positive correlations between ‘WT_C and kai2_C’ (r = 0.87), between ‘WT_H6 and kai2_H6’ (r = 0.89) and between ‘WT_H24 and kai2_H24’ (r = 0.92) (Fig. 2D), whereas weak correlations (r = 0.43–0.67) were observed among investigated genotypes under heat stress versus control conditions (Fig. 2D).
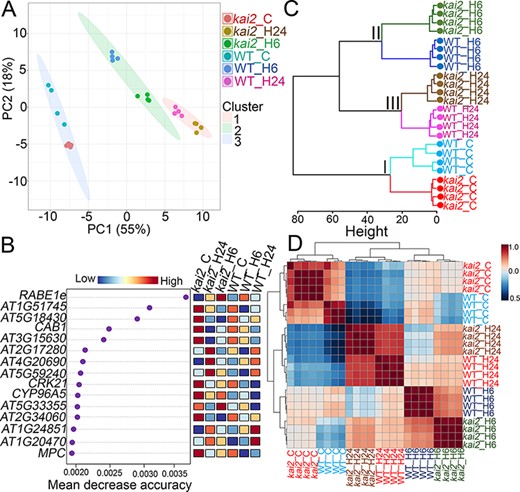
K-mean and hierarchical clustering of the interrelated effect of heat stress on the gene expression profiles of Arabidopsis WT and kai2 mutants. (A) K-mean clustering of normalized gene expression identified in the investigated WT and kai2 mutants grown under control (WT_C and kai2_C, respectively) and 6- and 24-h heat stress (WT_H6, WT_H24, kai2_H6 and kai2_H24, respectively) conditions. Principal components (PC1 and PC2) show the total variance based on differences in gene expression profiles of WT and kai2 mutants in responses to control and heat stress conditions. (B) Variable importance contributed to the dissemination of the investigated genotypes grown under control and heat stress conditions using random forest model. (C) Hierarchical clustering of the investigated genotypes grown under control and heat stress conditions using normalized gene expression. The height of the bar indicates the distance between the clusters. (D) Genotype–genotype correlations of the investigated genotypes grown under control and heat stress conditions using Pearson’s correlation coefficient. Color bar indicates positive (red) or weak/negative (blue) relationships. RAB GTPASE HOMOLOG E1E, RABE1e; CHLOROPHYLL A/B BINDING PROTEIN 1, CAB1; CYSTEINE-RICH RLK (RECEPTOR-LIKE PROTEIN KINASE) 21, CRK21; MITOCHONDRIAL PYRUVATE CARRIER, MPC.
Transcriptome dynamics in WT and kai2 mutants in response to heat stress
Log2 (fold changes) ≤−1 (downregulated) and ≥1 (upregulated) with q-values ≤ 0.05 were used as the minimum cutoffs to identify differentially expressed genes (DEGs) that are robustly regulated by KAI2 signaling in the examined genotypes under heat stress and control conditions. The analysis revealed that 751, 683 and 578 genes were upregulated and 1,115, 836 and 301 genes were downregulated in the ‘kai2-C/WT-C’, ‘kai2_H6/WT_H6’ and ‘kai2_H24/WT-H24’ comparisons, respectively (Fig. 3A; Supplementary Table S2A–C). We also identified DEGs in each genotype under heat stress versus control condition (Fig. 3B; Supplementary Table S2D–G). A total of 1,629, 2,659, 1,834 and 3,040 genes were upregulated, while 1,701, 2,641, 1,882 and 2,989 genes were downregulated in ‘WT_H6/WT_C’, ‘WT_H24/WT_C’, ‘kai2_H6/kai2_C’ and ‘kai2_H24/kai2_C’ comparisons, respectively (Fig. 3B; Supplementary Table S2D–G). The constructed Venn diagram illustrated that there were 127 overlapping DEGs (47 upregulated and 80 downregulated genes) in the ‘kai2_C/WT-C’, ‘kai2_H6/WT_H6-C’ and ‘kai2_H24/WT_H24’ comparisons (Fig. 3C, i and ii; Supplementary Table S3A) and 268 overlapping DEGs (191 upregulated and 77 downregulated genes) in ‘kai2_H6/WT_H6’ and ‘kai2_H24/WT_H24’ comparisons (Fig. 3C, i and ii; Supplementary Table S3A). Similarly, 398 overlapping DEGs (58 upregulated and 340 downregulated genes) were identified in the ‘kai2_H6/WT_H6’ and ‘kai2_C/WT_C’ comparisons and 38 overlapping DEGs (29 upregulated and 9 downregulated genes) were identified in the ‘kai2_H24/WT_H24’ and ‘kai2_C/WT_C’ comparisons (Fig. 3C, i and ii; Supplementary Table S3A). These 831 overlapping DEGs (127, 268, 398 and 38) represent the core transcriptomic changes modulated by the disruption of KAI2 signaling, which may contribute to heat-sensitive phenotype of the kai2 mutant genotype. On the other hand, 981 overlapping DEGs (550 upregulated and 431 downregulated genes) were identified in ‘WT_H6/WT_C’, ‘WT_H24/WT_C’, ‘kai2_H6/kai2_C’ and ‘kai2_H24/kai2_C’ comparisons (Fig. 3C, iii and iv; Supplementary Table S3B). These DEGs may represent common transcriptome responses to heat stress in both WT and kai2 mutant plants.
![Volcano plots and Venn diagrams of DEGs in the kai2 mutants relative to WT plants, grown under control (‘kai2_C/WT_C’) and 6-h (‘kai2_H6/WT_H6’) and 24-h (‘kai2_H24/WT_H24’) heat stress conditions, as well as for each genotype, under heat stress versus control conditions (‘WT_H6/WT_C’, ‘WT_H24/WT_C’, ‘kai2_H6/kai2_C’ and ‘kai2_H24/kai2_C’ comparisons). (A–B) Volcano plots of significantly upregulated [log2 (fold changes) ≥ 1; q-values ≤ 0.05] and downregulated [log2 (fold changes) ≤ −1; q-values ≤ 0.05] genes in ‘kai2_C/WT_C’, ‘kai2_H6/WT_H6’ and ‘kai2_H24/WT_H24’ comparisons (A) and ‘WT_H6/WT_C’, ‘WT_H24/WT_C’, ‘kai2_H6/kai2_C’ and ‘kai2_H24/kai2_C’ comparisons (B). Blue dashed lines represent the q-value and fold-change thresholds. Red and blue points highlight the upregulated and downregulated genes, respectively, in the investigated comparisons. (C) Venn diagrams of overlapping DEGs in the ‘kai2_C/WT_C’, ‘kai2_H6/WT_H6’ and ‘kai2_H24/WT_H24’ comparisons (i and ii), overlapping DEGs in the ‘WT_H6/WT_C’, ‘WT_H24/WT_C’, ‘kai2_H6/kai2_C’ and ‘kai2_H24/kai2_C’ comparisons (iii and iv).](https://oup.silverchair-cdn.com/oup/backfile/Content_public/Journal/pcp/63/12/10.1093_pcp_pcac112/1/m_pcac112f3.jpeg?Expires=1750211734&Signature=a3qgVmz5ESnP7xVIsLJX4o5WeTE4uiUDG0SEOzr6L21RHeD-dmOVAS0AdvIc11J-Z99NaV70iJpMPNn0kzKmDLjre8azgP4cLyNo7cfpDzw~fVN1ukMAjfa3Fn61IVYJkTpLRLOSpiNGCgre~1VjPZNQtj37WZKegrmSf0wjxa9wX4l-MjUH~oCo6RMlEPLLOzafSJMFTRkd-wad1FzGuGVMcVU9jgqgS~DBFJeye87XeQ69bOEtKpZ20sEp0QMkHd0GtaKz0pd6JfdvHTKybfoWZQviRFpBnPdSCMZkEbLC7EdUBahfvEqqb~vik839LSMhYMmdHsRBv~kbpCIYEQ__&Key-Pair-Id=APKAIE5G5CRDK6RD3PGA)
Volcano plots and Venn diagrams of DEGs in the kai2 mutants relative to WT plants, grown under control (‘kai2_C/WT_C’) and 6-h (‘kai2_H6/WT_H6’) and 24-h (‘kai2_H24/WT_H24’) heat stress conditions, as well as for each genotype, under heat stress versus control conditions (‘WT_H6/WT_C’, ‘WT_H24/WT_C’, ‘kai2_H6/kai2_C’ and ‘kai2_H24/kai2_C’ comparisons). (A–B) Volcano plots of significantly upregulated [log2 (fold changes) ≥ 1; q-values ≤ 0.05] and downregulated [log2 (fold changes) ≤ −1; q-values ≤ 0.05] genes in ‘kai2_C/WT_C’, ‘kai2_H6/WT_H6’ and ‘kai2_H24/WT_H24’ comparisons (A) and ‘WT_H6/WT_C’, ‘WT_H24/WT_C’, ‘kai2_H6/kai2_C’ and ‘kai2_H24/kai2_C’ comparisons (B). Blue dashed lines represent the q-value and fold-change thresholds. Red and blue points highlight the upregulated and downregulated genes, respectively, in the investigated comparisons. (C) Venn diagrams of overlapping DEGs in the ‘kai2_C/WT_C’, ‘kai2_H6/WT_H6’ and ‘kai2_H24/WT_H24’ comparisons (i and ii), overlapping DEGs in the ‘WT_H6/WT_C’, ‘WT_H24/WT_C’, ‘kai2_H6/kai2_C’ and ‘kai2_H24/kai2_C’ comparisons (iii and iv).
Gene Ontology and Kyoto Encyclopedia of Genes and Genomes enrichment analyses of identified core overlapping DEGs
A Gene Ontology (GO) enrichment analysis was conducted (Fisher’s extract test and Bonferroni corrections; q-values ≤ 0.05) to provide a further insight into biological characteristics of the 831 overlapping DEGs. The enrichment analysis classified these 831 DEGs into three GO categories: (i) biological process (BP), (ii) molecular function (MF) and (iii) cellular component (CC) (Fig. 4A, B; Supplementary Table S4). The overlapping upregulated genes in the BP category had highly enriched GO terms (fold enrichment > 2) like ‘response to water deprivation (GO:0009414)’ and ‘response to salt stress (GO:0009651)’ (Fig. 4A; Supplementary Table S4), whereas the top enriched GO terms for the overlapping upregulated genes in the MF category were ‘phosphatidylcholine binding (GO:0031210)’ and ‘4-methylthiopropyl glucosinolate S-oxygenase activity (GO:0080103)’ (Fig. 4A; Supplementary Table S4). On the other hand, the top GO terms for overlapping downregulated genes in the MF category included ‘misfolded protein binding (GO:0051787)’, ‘protease binding (GO:0002020)’, ‘heat shock protein binding (GO:0031072)’ and ‘unfolded protein binding (GO:0051082)’ (Fig. 4B; Supplementary Table S4). Finally, ‘cell wall (GO:0005618)’ and ‘external encapsulating structure (GO:0030312)’ were among the top enriched GO terms of the overlapping upregulated genes in the CC category (Fig. 4A; Supplementary Table S4), whereas ‘SMC loading complex (GO:0032116)’ and ‘Golgi transport complex (GO:0017119)’ were among the top enriched GO terms of the overlapping downregulated genes in the CC category (Fig. 4B; Supplementary Table S4).
![GO enrichment analysis. (A–B) GO-fold enrichments of the upregulated (A) and downregulated (B) overlapping genes out of the 831 DEGs derived from ‘kai2_C/WT_C’, ‘kai2_H6/WT_H6’ and/or ‘kai2_H24/WT_H24’ comparisons. Dot size represents number of genes in a particular pathway. Dot color represents −log10 [false discovery rate (FDR)].](https://oup.silverchair-cdn.com/oup/backfile/Content_public/Journal/pcp/63/12/10.1093_pcp_pcac112/1/m_pcac112f4.jpeg?Expires=1750211734&Signature=AG~WbS7kSPShTaXevNyHVj4np4OIbHw1mi1FANQhk3I-B71jfyy55sVwESTgEQpe-uTqRMS98eg0Nhv9hlQhC7KHN3xE9ZSsVASso0kGqNO9j98~0RvnJZ1sVcf~7yeNirTn6GYCwDXxz3uJTH20Fo48cvdtZ9w9OVJkYI7sYRVzc04kkmHU3DlealAUhkrrfwReDPe0t63N4c3Rtru-w83eJk9~0Qa49Ek~TRpvMhdizb5~mtvavEKJdPf52f76IUd3OGcYSJOr9WOmXMgznhN0tOwx8Ty7XrnGcGzLEyedTOmXdcxBDDk3QT7g-xg6a2SXXhhYD~CFBjypRfoJ0w__&Key-Pair-Id=APKAIE5G5CRDK6RD3PGA)
GO enrichment analysis. (A–B) GO-fold enrichments of the upregulated (A) and downregulated (B) overlapping genes out of the 831 DEGs derived from ‘kai2_C/WT_C’, ‘kai2_H6/WT_H6’ and/or ‘kai2_H24/WT_H24’ comparisons. Dot size represents number of genes in a particular pathway. Dot color represents −log10 [false discovery rate (FDR)].
Next, the 831 overlapping DEGs were mapped into the Kyoto Encyclopedia of Genes and Genomes (KEGG) database to identify the key metabolic pathways in which these DEGs were significantly (q-values ≤ 0.05) enriched (Fig. 5A). Results revealed that the overlapping DEGs were significantly (fold enrichment > 2, q-values ≤ 0.05) enriched in ‘protein processing in endoplasmic reticulum (ath04141)’, ‘plant hormone signal transduction (ath04075)’, ‘cutin, suberin, and wax biosynthesis (ath00073)’ and ‘plant-pathogen interaction (ath04626)’ pathways (Fig. 5A). Finally, a centplot network analysis was performed to depict DEGs and their linkages with the enriched KEGG pathways (Fig. 5B). For example, the ‘protein processing in endoplasmic reticulum’ pathway was tightly linked with several downregulated heat shock protein (HSP)-related genes (Fig. 5B; Supplementary Table S4). On the other hand, the ‘plant hormone signal transduction pathway’ was tightly associated with several upregulated ABA- and indole-acetic-acid-related genes identified in the 831 overlapping DEGs (Fig. 5B; Supplementary Table S4).
![KEGG enrichment analysis of the 831 overlapping DEGs derived from the ‘kai2_C/WT_C’, ‘kai2_H6/WT_H6’ and/or ‘kai2_H24/WT_H24’ comparisons. (A) KEGG enrichment pathways. Dot size represents the number of genes in a particular pathway. Dot color represents −log10 [FDR]. (B) Centplot network of significantly enriched pathways (nodes) and associated genes (edges). Node sizes indicate the numbers of genes. Color indicates fold changes in expression of pathway-associated genes.](https://oup.silverchair-cdn.com/oup/backfile/Content_public/Journal/pcp/63/12/10.1093_pcp_pcac112/1/m_pcac112f5.jpeg?Expires=1750211734&Signature=cxTuKDLij9JzAjCvKm6yj3QQGkwhSmJFPWfrLG-gxOekrEizltUGGg1YDzViZUotxUGx6wJ8A8tD-N8uDUgVNJd~1kTI4JvDTkBHMkaMkE7n46omOlbBTEGObYt8uKL748lX3-17B5qq5frql0tt19v2dGpAuKejYkySvtRhT3ikED3tEShwO1cSnjuB5WoLf5T0xf29YjVCnpJJJxm8tqqoFZNHJ30p-K3zFgwMKMpDsI4snQoFfsBfKOeEawWcL3FWe6vu8Yf23EDnk59BTkw-jQps0l~vcLJZQl-BBmUWLx9-H-rNnRjv19JXOjnRyiw8cKHeM6Nb6pnr1QCaSw__&Key-Pair-Id=APKAIE5G5CRDK6RD3PGA)
KEGG enrichment analysis of the 831 overlapping DEGs derived from the ‘kai2_C/WT_C’, ‘kai2_H6/WT_H6’ and/or ‘kai2_H24/WT_H24’ comparisons. (A) KEGG enrichment pathways. Dot size represents the number of genes in a particular pathway. Dot color represents −log10 [FDR]. (B) Centplot network of significantly enriched pathways (nodes) and associated genes (edges). Node sizes indicate the numbers of genes. Color indicates fold changes in expression of pathway-associated genes.
Expression of stress-responsive regulatory genes in kai2 mutant versus WT plants under heat stress
In support of the transcriptome data and the results of GO and KEGG analyses, reverse transcription-quantitative PCR (RT-qPCR) analysis also revealed the downregulation of several genes encoding HSPs, including HSP90, HSP70 and HSP101, as well as heat shock transcription factors (e.g. HSFA2) in the ‘kai2_C/WT-C’, ‘kai2_H6/WT_H6’ and/or ‘kai2_H24/WT_H24’ comparisons (Fig. 6A). In this study, HSP17.4, HSP20-like, MITOCHONDRION-LOCALIZED SMALL HEAT SHOCK PROTEIN 23.6 (HSP23.6-MITO), HSP70, HEAT SHOCK COGNATE PROTEIN 70.1 (HSC70.1), HSP81.3, HSP89.1, HSP90.1 and HSP101 were identified as downregulated genes in ‘kai2_C/WT-C’, ‘kai2_H6/WT_H6’ and/or ‘kai2_H24/WT_H24’ comparisons (Table S3A). In contrast, only HSP21 and HSP18.2 were upregulated in ‘kai2_C/WT-C’, ‘kai2_H6/WT_H6’ and/or ‘kai2_H24/WT_H24’ comparisons (Table S3A). In addition, several heat shock transcription factor (HSF)-encoding genes involved in heat stress responses have been identified (Table S3A). Among which, HSFA2, HSFA4a and HSF4, the master regulators of heat stress tolerance in Arabidopsis (Cheng et al. 2021), were downregulated, whereas HSFA6b was upregulated in ‘kai2_C/WT-C’, ‘kai2_H6/WT_H6’ and/or ‘kai2_H24/WT_H24’ comparisons (Table S3A). Results of the GO, KEGG, transcriptome and RT-qPCR analyses collectively revealed that several HSP- and HSF-related genes involved in ‘protein processing in endoplasmic reticulum’, ‘misfolded protein binding’ and ‘heat shock protein binding’ pathways were downregulated in the ‘kai2_C/WT-C’, ‘kai2_H6/WT_H6’ and ‘kai2_H24/WT_H24’ comparisons (Figs. 4B, 5A, B and 6A, B). Taken together, disruption of the KAI2 signaling resulted in a higher number of downregulated HSP and HSF genes in the kai2 mutants, which partially explain its increased heat stress sensitivity.
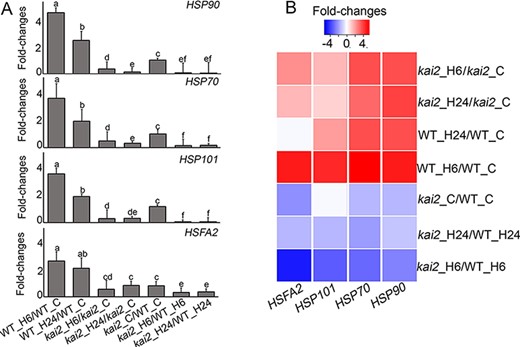
Fold changes in the expression of several HSP- and HSF-related genes as determined by RT-qPCR (A) and transcriptomics (B). Color bar indicates increased (red) and decreased (blue) expression levels (log2 fold changes). Significant letters indicate significant differences between the kai2 and WT plants in responses to control and heat stress conditions at P < 0.05, using ANOVA with post hoc Tukey HSD test.
Other regulatory genes like WRKY6, WRKY33, WRKY38, WRKY46, WRKY50, WRKY51, WRKY53, WRKY54, WRKY55, WRKY58, WRKY67 and WRKY70 encoding TFs, which are involved in regulation of heat/cold, salt and drought stress responses in plants (Li et al. 2020d, Wang et al. 2020a,b, Cheng et al. 2021), were downregulated in ‘kai2_C/WT-C’, ‘kai2_H6/WT_H6’ and/or ‘kai2_H24/WT_H24’ (Table S3A). Likewise, several NO APICAL MERISTEM ARABIDOPSIS TRANSCRIPTION ACTIVATION FACTOR CUP-SHAPED COTYLEDON (NAC) TF-encoding genes (e.g. NAC003, NAC004, NAC016 and NAC036), which are involved in the regulation of LR development (Quach et al. 2014), drought (Sakuraba et al. 2015) and heat and salinity stresses (Zhang et al. 2021), were also downregulated in ‘kai2_C/WT-C’, ‘kai2_H6/WT_H6’ and/or ‘kai2_H24/WT_H24’ comparisons (Table S3A). Genes encoding DEHYDRATION-RESPONSIVE ELEMENT BINDING (DREB) 2A and DREB5 TFs, as well as ligases like E3 UBIQUITIN-PROTEIN LIGASE ARABIDOPSIS Tóxicos en Levadura (ATL41), REALLY INTERESTING NEW GENE (RING1), PLANT-U-BOX (PUB24) and XB3 ORTHOLOG 4 in ARABIDOPSIS (XBAT34), which are involved in heat and/or drought stress tolerance in plants (Stone 2014, Wu et al. 2018, Serrano et al. 2019a, Krukowski et al. 2020), were downregulated in ‘kai2_C/WT-C’, ‘kai2_H6/WT_H6’ and/or ‘kai2_H24/WT_H24’ comparisons (Table S3A). It is also worth mentioning that several CYCLIC NUCLEOTIDE GATED CHANNEL genes (e.g. CNGC3, CNGC10 and CNGC11), which encode primary thermosensors in plants (Finka et al. 2012), were also downregulated in ‘kai2_C/WT-C’, ‘kai2_H6/WT_H6’ and/or ‘kai2_H24/WT_H24’ comparisons (Table S3A). Taken together, the disruption of KAI2 signaling resulted in a higher number of downregulated stress regulatory genes in the kai2 mutant, which might account for its increased heat stress sensitivity.
Discussion
kai2 mutants exhibit lower survival rates than WT plants under heat stress
Previous studies demonstrated that KAI2 has positive regulatory roles in Arabidopsis adaptation to drought (Li et al. 2017), osmotic stress (Wang et al. 2018) and cold stress (Afzal Shah et al. 2021). However, possible contributions of KAI2 in Arabidopsis adaptation to heat stress tolerance at the whole plant level have not been examined. First, we used survival rate and leaf surface temperature assays as a proxy to compare the responses of WT and kai2 mutant plants to heat stress (Fig. 1B, C). The time-course heat stress treatment exerted more conspicuous negative effects on the survival rates of the kai2 mutant than WT plants (Fig. 1A, C), which was concomitant with the increase in leaf surface temperature of the kai2 mutants (Fig. 1B, D). These results imply that the disruption of KAI2 signaling negatively affects Arabidopsis adaptation to heat stress. An early study by Hurkman et al. (2009) demonstrated that high-temperature stress increased leaf surface temperature of rice (Oryza sativa) plants, which was positively correlated with heat-induced oxidative stress and accumulation of malondialdehyde contents. Similarly, Deva et al. (2020) demonstrated that heat-sensitive common bean (Phaseolus vulgaris) genotypes had higher leaf surface temperatures than heat-tolerant genotypes, and the magnitude of this difference increased at higher-temperature stress. The observed differences in the leaf surface temperature between heat-tolerant and heat-sensitive common bean might be partially attributed to stomatal behavior, which might be responsible for a potential trade-off between leaf cooling and water conservation under heat stress conditions (Deva et al. 2020). The increased susceptibility of the kai2 mutants to heat stress is also supported by the inhibition of kai2 seed germination under elevated temperatures (Wang et al. 2018).
In heat-tolerant plant genotypes, the membrane integrity is usually maintained, whereas in heat-sensitive plant genotypes, a greater degree of membrane damage is usually observed due to heat-stress-induced oxidative stress (Baxter et al. 2014, Jin et al. 2020). For example, the investigation of 207 cultivated and 63 wild carrot (Daucus carota) accessions revealed that five cultivated carrot accessions were the most heat-tolerant accessions with higher cell membrane stability, while two wild accessions were the most heat-sensitive accessions with lower cell membrane stability (Bolton et al. 2019), indicating the positive relationship between cell membrane stability and heat tolerance ability. Early study by Schonherr et al. (1979) demonstrated that the permeability coefficients for the water diffusion across cuticular membranes of Citrus aurantium increased rapidly with increasing surrounding temperatures and higher water loss from the plants. Li et al. (2017) reported higher cuticular permeability in the kai2 mutant than WT plants, which could cause enhanced non-stomatal water loss under normal and drought stress conditions. Our EL assay along with the results of the above reports suggested that the kai2 mutant exhibited lower cell membrane stability and subsequently more rapid non-stomatal water loss than WT, which might be partially attributed to the observed heat-sensitivity phenotype. The differences in EL and leaf surface temperature between WT and the kai2 mutants were observed at early time points of heat stress, followed by wilting and death of the kai2 mutant plants after 5 d of heat treatment (Fig. 1A–E). Our finding is consistent with that of Gao et al. (2020), who demonstrated that the early hours of heat treatment provided the most informative insight into the differential responses of Arabidopsis WT and the hsp101 mutant to heat stress. It is worth noting that the complexity of canopy structure and the variation of leaf angle might also affect the leaf temperature by increasing the amount of absorbed solar radiation and decreasing heat dissipation ability (Prashar and Jones 2014).
Comparative transcriptome analysis revealed the downregulation of many genes encoding HSPs and HSFs in the kai2 mutants
In order to gain further insights into how KAI2 signaling contributes to heat stress tolerance in Arabidopsis at the molecular level, we performed comparative transcriptome analysis of WT and the kai2 mutants (Supplementary Tables S1 and S2). The high correlation of the transcriptome data obtained from four biological replicates of each genotype was verified by K-mean, hierarchical and Pearson’s correlation analyses (Fig. 2A–D), which supported the reproducibility of the data. GO and KEGG enrichment analyses showed that some downregulated genes identified among the 831 core DEGs were enriched in ‘misfolded protein binding’, ‘heat shock protein binding’, ‘unfolded protein binding’ and ‘protein processing in endoplasmic reticulum’ (Figs. 4B and 5A). These results indicated that pathways associated with the maintenance of protein stability and functions under heat stress were more strongly affected in the kai2 mutant than WT plants. In this study, most HSP-related genes, including HSP17.4, HSP20-like, HSP23.6-MITO, HSP70, HSC70-1, HSP81-3, HSP89.1, HSP90.1 and HSP101, were downregulated in ‘kai2_C/WT-C’, ‘kai2_H6/WT_H6’ and/or ‘kai2_H24/WT_H24’ comparisons (Table S3A). The downregulation of many HSP-related genes in the kai2 mutants is consistent with their more heat-susceptible phenotypes (Fig. 1A). It is well known that the HSP family plays an important role in Arabidopsis response to heat stress (Yamaguchi 2021). The key function of HSPs is to regulate the refolding of misfolded proteins or target ubiquitination-mediated degradation by autophagy and 26S proteasome systems, thereby helping plants to maintain their cellular homeostasis under heat stress conditions (Serrano et al. 2019b, Guihur et al. 2021, Zhao et al. 2021). For example, HSP chaperones, such as HSP20 and HSP101, prevent the aggregation of heat-labile proteins, repair protein misfolding and aggregation and stabilize the plasma membrane structure, thereby maintaining cellular functions and reducing the cell damage under heat stress conditions (Mogk and Bukau 2017, Chodasiewicz et al. 2020, Guihur et al. 2021). Transgenic Arabidopsis ectopically expressing pepper (Capsicum annuum) CaHSP16.4 showed improved heat stress tolerance relative to WT plants (Huang et al. 2019).
Heat stress induced the fluidity of the plasma membrane, resulting in the activation of CNGCs, the well-known membrane fluidity thermosensors (Tunc-Ozdemir et al. 2013). In this study, CNGC3, CNGC10 and CNGC11 were downregulated in ‘kai2_C/WT-C’ and ‘kai2_H6/WT_H6’ comparisons, implying that the thermosensor responses in the kai2 mutant were not activated (Table S3A). In Arabidopsis, the lack of AtCNGC6 led to a lower expression of HSP18.2, HSP25.3 and HSP70 at 37°C, resulting in a hyper-thermosensitive phenotype of the atcngc6 compared with WT plants (Gao et al. 2012). Heat stress activates CNGCs in Arabidopsis followed by the transient Ca2+ entry into the cytosol, which in turn activates HSFA1, a master regulator of heat stress tolerance (Liu and Charng 2013, Ohama et al. 2017, Niu et al. 2020). HSFA1 can then form a heterodimer with HSFA2, resulting in the upregulation of HSP genes, ultimately conferring acquired thermotolerance in plants (Hahn et al. 2011, Yoshida et al. 2011). Defects in Arabidopsis AtHSFA2 suppressed ABA-induced expression of AtHSP genes and ABA-mediated heat tolerance in the athsfa2 plants (Wang et al. 2017b). In this study, HSFA2 was downregulated in ‘kai2_C/WT_C’, ‘kai2_H6/WT_H6’ and/or ‘kai2_H24/WT_H24’ comparisons (Fig. 6A, B; Supplementary Table S3A), implying that the heat-susceptible phenotype of the kai2 mutant may be partially attributed to the downregulation of key HSF genes like HSFA2.
Genes encoding members of the ubiquitination system and WRKY and NAC TF families were downregulated in the kai2 mutants
Apart from genes encoding HSPs and HSFs, genes encoding E3 ubiquitin ligases, like ATL41, RING1, XBAT34 and PUB24, were downregulated in ‘kai2_C/WT-C’ and/or ‘kai2_H6/WT_H6’ (Tables S2 and S3). The ubiquitin–proteasome system (UPS), including E1, E2 and E3, is known as the central regulator that controls plant adaptation to drought, salinity and heat stresses (Stone 2014, Serrano et al. 2019a). UPS modulates protein activity by posttranslational modifications, which enables specific and rapid cellular responses to stimuli without the requirement of de novo protein synthesis (Serrano et al. 2019a). UPS is essential not only for protein modification during heat stress but also for the restoration of normal cellular activities, including the resumption of nucleocytoplasmic transport and translation and the disassembly of stress granules during the recovery phase following heat stress (Maxwell et al. 2021). Transgenic Arabidopsis ectopically expressing rice HEAT COLD INDUCED 1 (OsHCI1), coding for a member of the RING FINGER E3 LIGASE family, showed enhanced heat stress tolerance relative to WT plants, which was attributed to OsHCI1-induced nucleocytoplasmic trafficking of nuclear substrate proteins under heat stress (Lim et al. 2013). Likewise, transgenic Arabidopsis ectopically expressing rice RING FINGER PROTEIN 1 (OsHIRP1) improved the thermotolerance of transgenic plants, which was attributed to OsHIRP1-induced expression of HSFA3, HSP17.3, HSP18.2 and HSP20 genes (Kim et al. 2019). Arabidopsis atpub46 and atpub48 mutants displayed hypersensitivity to drought stress relative to WT plants (Adler et al. 2017), whereas the expression levels of AtPUB47 and AtPUB48 increased in response to heat stress (Adler et al. 2017), which suggests that these two genes might play positive roles in heat tolerance as well. The above results indicated that the downregulation of several E3 LIGASE-encoding genes in the kai2 mutant might be also attributed to the observed increased heat susceptibility of the kai2 mutant plants.
In addition, WRKY33, WRKY54 and WRKY70 were downregulated in ‘kai2_C/WT-C’, ‘kai2_H6/WT_H6’ and/or ‘kai2_H24/WT_H24’ comparisons (Tables S2, S3A). In Arabidopsis, wrky25 wrky33 double mutants and wrky25 wrky26 wrky33 triple mutants exhibited high susceptibility to heat stress as indicated by elevated EL levels and decreased survival rates compared with WT plants (Li et al. 2011). In contrast, constitutive expression of WRKY25, WRKY26 or WRKY33 enhanced the tolerance of transgenic Arabidopsis plants to heat stress (Li et al. 2011). Under heat stress conditions, the high expression of wheat (Triticum aestivum) TaWRKY70 was positively correlated with improved Puccinia striiformis pathogen resistance (Wang et al. 2017c). Additionally, several NAC TFs (e.g. NAC003, NAC004, NAC016 and NAC036) were downregulated as well in ‘kai2_C/WT-C’, ‘kai2_H6/WT_H6’ and/or ‘kai2_H24/WT_H24’ comparisons (Tables S2, S3A). Some NAC TFs were reported to be involved in the regulation of plant growth and developmental as well as plant responses to abiotic stresses, such as heat, salinity and drought (Tran et al. 2004, 2007, Hu et al. 2010, Kim et al. 2016, Zhang et al. 2021). For example, tomato SlNAC004 functions as a positive regulator of tomato fruit ripping through the induction of ethylene biosynthesis and carotenoid accumulation (Zhu et al. 2014). Transcriptome analysis of hybrid Populus simonii × Phyllostachys nigra plants showed a prominent increase in the expression levels of PsnNAC036 in response to salt and heat stress conditions (Zhang et al. 2021). Additionally, transgenic tobacco (Nicotiana tabacum) lines ectopically expressing PsnNAC036 exhibited significant salt and heat stress tolerance (Zhang et al. 2021), implying that NAC036 functions as a positive regulator for salt and heat stress tolerance. Our results indicated that these stress-responsive regulatory genes were repressed by the disruption of the KAI2 gene, which might explain the higher heat-susceptible phenotype of kai2 mutants compared with WT plants.
Conclusion
In this study, several phenotypic and physiological assays and transcriptome profiling were performed in kai2 mutant and WT plants under control and heat stress conditions (6 and 24 h) to gain insights into KAI2’s role in the responses of Arabidopsis plants to heat stress. The kai2 mutants showed an increased heat-sensitive phenotype as evidenced by their lower survival rate compared with WT plants under heat stress. Additionally, kai2 mutants also suffered from heat-induced membrane damage and heat-induced leaf surface temperature relative to WT plants. In accordance with the increased heat sensitivity of the kai2 mutants, comparative transcriptome analysis revealed the downregulation of several HSP- and HSF-encoding genes in the kai2 mutants relative to WT plants, under both control and heat stress conditions. HSPs and HSFs are involved in many heat-stress-responsive pathways, including ‘heat shock protein binding’, ‘protein folding chaperone’, ‘protein processing in endoplasmic reticulum’, ‘response to stress’ and ‘response to external stimuli’, which may partially explain the increased heat-sensitive phenotype of the kai2 mutant. Therefore, KAI2-mediated signaling positively regulates heat tolerance in Arabidopsis through the activation of the HSP-related and HSF-related pathways. Additionally, several stress-responsive regulatory WRKY- and NAC-encoding genes were downregulated in the kai2 mutants, which may also explain their increased heat-sensitive phenotype. The repression of heat-stress-responsive genes and higher cell membrane permeability in the kai2 mutant are one of the mechanistic reasons for its susceptibility to heat stress and provide a starting point for further research to gain a deeper understanding of KAI2-mediated heat tolerance in Arabidopsis plants. Transcriptome profiling of Arabidopsis plants exogenously treated with KARs and heat stress may confirm the effect of KAI2 signaling on the expression of heat-stress-response-related genes. Taken together, this study not only provides a foundation for further understanding of the molecular mechanisms underlying heat tolerance in Arabidopsis plants but it has also identified valuable and useful genes mediated by KAI2 signaling that could be utilized for genetic improvement of heat tolerance in crops.
Materials and Methods
Plant materials and heat-responsive assays
Arabidopsis thaliana Columbia ecotype (Col-0) was used as WT in all experiments. The kai2-2 mutant (SGT6839) was obtained from the Arabidopsis Biological Resource Center. The kai2-2 allele was initially screened from the Activator (Ac)/Dissociation (Ds)-transposon insertion collection generated in A. thaliana [Landsberg erecta (Ler) ecotype background] at the Institute of Molecular Agrobiology (Waters et al. 2012). The kai2-2 mutant was therefore backcrossed six times with Col-0 ecotype (Umehara et al. 2015) before using in this study. Heat-responsive phenotypes were examined in WT and the kai2-2 mutant using the ‘same tray’ method. Briefly, 10-day-old plants (45 plants from each genotype per tray) were grown on plastic trays (21 × 30 × 5 cm in width, length and height, respectively) containing dry soil (Dio Propagation Mix No.2 for Professional; Dio Chemicals Ltd., Tokyo, Japan www.dionet.jp) and saturated with water. Plant samples were divided into two groups, and each group contained three trays. The optimal temperature for growth of A. thaliana is 22–25°C, and an increase of 15°C above the optimal temperature threshold within a short time can alter Arabidopsis plant fitness and cause heat shock (Larkindale and Knight 2002, Silva-Correia et al. 2014). Therefore, one group set was subjected to continuous 40°C heat stress, while the control group was grown at 23°C using a growth chamber (Nippon Medical & Chemical Instruments Co., Ltd., Osaka, Japan, 16 h L/18 h D, 50–60% relative humidity and 65 μmol m−2 s−1 photon flux density). The surface temperature of leaves was under control, and 6 and 24-h heat stress conditions were measured using a thermal video system (TVS-8500; Nippon Avionics CO., Ltd. Yokohama, Japan). EL percentage of the detached aerial parts of WT and the kai2-2 mutant exposed to heat stress was determined according to Nishiyama et al. (2011). Survival rates were calculated using dead and survived plants in WT and the kai2 mutant after 5-d exposure to heat stress (40°C).
Microarray and bioinformatic analyses of WT and kai2-2 mutants in response to heat stress
Aerial tissues of 10-day-old WT and kai2-2 mutant plants grown on soil under control and 6 and 24-h heat stress conditions were detached and collected in four biological replicates for transcriptome analysis. The raw microarray data were deposited in the Gene Expression Omnibus database (GSE200100). Hybridization to the Arabidopsis Oligo 44K microarray (v4.0, Agilent Technologies, CA, United States) was performed as previously described (Abdelrahman et al. 2021). All arrays were scanned with a microarray scanner (G2505B, Agilent Technologies CA, United States) and analyzed using the Linear Models for Microarray Data package. Normalized gene expression data are included in Table S1. K-mean clustering, hierarchal clustering, variable importance in projection (VIP) scoring and heatmap correlation matrix analysis were performed using bioinformatic tools in MetaboAnalyst v.5 (www.metaboanalyst.ca). VIP scores were estimated using random forest classification, and the optimum number of K-mean clusters was determined by ‘Silhouette method’ (Fig. S1) using the ‘factoextra’ and FactoMineR’ packages in R v.4.0.1. The q-values ≤ 0.05, log2 (fold changes) ≤ −1 and log2 (fold changes) ≥ 1 were used as minimum cutoffs for the identification of downregulated and upregulated genes, respectively, in all comparisons. The downregulated and upregulated genes were visualized using volcano plot with the aid of the ‘EnhancedVolcano’ package in R v.4.0.1. GO enrichment of the overlapping DEGs was carried out using ShinyGO and AmiGO (Carbon et al. 2009). The Arabidopsis Genome Initiative of the overlapping DEGs were mapped into the Arabidopsis ‘ath’ KEGG reference database using the ‘clusterProfiler’ and ‘pathview’ packages in R v.4.0.1 to identify the key metabolic pathways associated with the identified DEGs.
RT-qPCR
Total RNA was extracted from aerial parts of 10-day-old WT and kai2-2 mutant plants grown under control and 6 and 24 h heat stress conditions using the RNeasy Plant Mini Kit (Qiagen, Hilden, Germany) according to the manufacturer’s instructions. Complementary DNA synthesis and RT-qPCR were performed using the ReverTra Ace qPCR RT Master Mix kit (TOYOBO, Osaka, Japan) according to the manufacturer’s instructions. The RT-qPCR was conducted on Agilent Mx3000P system (CA, USA), and the ACTIN2 (ACT2) gene was used as a reference gene as previously described (Abdelrahman et al. 2021). Primers used in the RT-qPCR analysis are listed in Table S5. Three independent biological replicates (n = 3; 15 plants per replicate) were used in the analysis.
Supplementary Data
Supplementary data are available at PCP online.
Data Availability
All raw transcriptome and normalized gene expression data are available in Gene Expression Omnibus (accession number GSE200100) National Center for Biotechnology Information and Table S1, respectively.
Funding
This study has been partially supported by Strategic Priority Research Program of the Chinese Academy of Sciences (Grant No. XDA28110100); National Key R&D Program of China (2018YFE0194000) from the Ministry of Science and Technology of the People’s Republic of China; the Key Scientific Research Projects of Institutions of Higher Education in Henan Province (22A180012).
Disclosures
The authors have no conflicts of interest to declare.
Authors’ contributions
M.A. and L.-S.P.T. conceived the study. M.A. performed the experiment. M.G.M., C.D.T., M.E. and W.L. enrolled in sample collection and RNA extraction. M.A., M.T. and M.S. performed RNA-seq data analysis with the input of M.G.M. and L.-S.P.T. M.A., S.S., M.G.M. and L.-S.P.T. contributed to the writing of the initial draft of the manuscript. All authors read and approved the final manuscript.
References
Author notes
have contributed equally to this work.
