


Abstract
Crops that exhibit symptoms of calcium (Ca) deficiency constitute a major agricultural problem. Molecular breeding of resistant cultivars is a promising method for overcoming this problem. However, the involved genes must first be identified. Here, we show that the glucan synthase-like (GSL) 1 gene is essential for low-Ca tolerance in Arabidopsis thaliana. GSL1 is homologous to GSL10, which we previously showed was essential for low-Ca tolerance. Under low-Ca conditions, gsl1 mutants exhibit reduced growth and the onset of necrosis in new leaves. These symptoms are typical of Ca-deficient crops. A grafting experiment suggested that the shoot genotype, but not the root genotype, was important for the suppression of shoot necrosis. The ectopic accumulation of callose under low-Ca conditions was significantly reduced in gsl1 mutants compared with wild-type plants. Because the corresponding single-mutant phenotypes are similar, we investigated the interaction between GSL1 and GSL10 by testing the gsl1 gsl10 double mutant for sensitivity to low-Ca conditions. The double mutant exhibited a more severe phenotype than did the single mutants, indicating that the effects of GSL1 and GSL10 on low-Ca tolerance are additive. Because GSL genes are highly conserved within the plant kingdom, the GSL loci may be useful for breeding low-Ca tolerant crops.
Introduction
Calcium (Ca) is an essential nutrient in plants; it has many functions, including the strengthening of cell walls via pectin cross-linking, stabilization of cell membranes, activation of enzymes and transmission of signals (Marschner 2011). Ca is generally transported from the root to shoot by transpiration. Therefore, it tends to accumulate in larger leaves that have high transpiration rates, whereas smaller younger tissues (e.g. growing leaves and fruits) have less Ca. However, growing tissues generally require more Ca than do older tissues. Accordingly, Ca deficiency is more detrimental in new leaves and fruits where it causes necrosis (White and Broadley 2003).
Ca deficiency is a serious agricultural problem. The symptoms of Ca deficiency, such as blossom end rot in tomato and tip burn in Chinese cabbage, may appear as necrotic lesions on fruits and leaves (White and Broadley 2003). These are the commercially important parts of plants; therefore, Ca deficiency reduces the quality of agricultural products. There are two major methods of combating Ca deficiency in plants. One method is the appropriate management of the growing environment including the provision of Ca in water, fertilizer or foliar sprays. However, this solution is problematic because freshly absorbed Ca is mainly transferred to mature, non-growing parts of the plant. The other method is to generate crops that are tolerant to Ca deficiency. There are commercially available cultivars of some vegetables (e.g. Chinese cabbage) that are generally tolerant of Ca deficiency. However, the underlying molecular mechanisms are unclear. To generate plants that are universally tolerant of Ca deficiency, there is a need to understand the molecular mechanisms involved in low-Ca tolerance and the processes underlying the development of Ca-deficiency symptoms (e.g. necrotic lesions).
Several genes have been linked to symptoms of Ca deficiency. de Freitas et al. (2012) reported that pectin de-methylesterase RNAi tomato lines showed an increase in extracellular free Ca concentrations and a reduction in the incidence of blossom end rot, probably because less Ca was trapped with pectin in the egg-box structure within the cell wall (de Freitas et al. 2012). Furthermore, overexpression of the vacuolar Ca2+/H+ antiporter CAX1 reduced the level of extracellular free Ca2+ and increased the incidence of blossom end rot (de Freitas et al. 2011). These results are consistent with the findings in early studies of CAX1, which showed that CAX1-overexpressing tobacco lines exhibited Ca-deficiency symptoms (Hirschi 1999); moreover, disruption of the CAX1 gene improved the growth of Arabidopsis thaliana seedlings when Ca concentrations were low (Cheng et al. 2003). These studies suggest that maintaining high concentrations of extracellular free Ca2+ can suppress the symptoms of Ca deficiency.
Ca concentrations within the endoplasmic reticulum may also be important for low-Ca tolerance. Disruption of the Ca2+-ATPase ECA1, which transports Ca2+ into the endoplasmic reticulum, resulted in low-Ca sensitivity (Wu et al. 2002). In addition, the overexpression of a Ca-binding protein in the endoplasmic reticulum alleviated Ca-deficiency-like symptoms in CAX1-overexpressing tobacco and tomato plants (Wu et al. 2012).
These reverse genetic analyses have provided important insights into the development of Ca-deficiency symptoms; they have also highlighted the importance of subcellular Ca distribution. However, Ca physiology is complex, and other genes must be involved in low-Ca tolerance. We conducted forward genetic analyses and identified several genes involved in low-Ca tolerance in plants (Shikanai et al. 2015, 2020, Li et al. 2017). For example, the glucan synthase-like (GSL) 10 gene encodes an enzyme that synthesizes callose (β-1,3 glucan), which is deposited in the cell wall (Shikanai et al. 2020). The gsl10-5 mutant exhibited an increase in cell death in new leaves when grown under low-Ca conditions. In addition, ectopic callose deposition decreased in the gsl10-5 mutant under low-Ca conditions. These observations suggest that callose helps to prevent cell death under low-Ca conditions.
Callose is required for many biological processes within plants, including the formation of the cell plate, regulation of the permeability of sieve plates and plasmodesmata, development of pollen and establishment of defense responses. There are 12 callose synthase genes in the Arabidopsis genome (Hong et al. 2001). Among these GSL genes, several contribute to callose accumulation in similar processes. For example, both GSL6 and GSL8 are involved in cell plate formation (Hong et al. 2001, Thiele et al. 2009). GSL1, 2, 5, 8 and 10 are reportedly involved in pollen development (Dong et al. 2005, Enns et al. 2005, Töller et al. 2008). These studies suggest that many GSL genes perform redundant roles in callose synthesis in different plant tissues. Therefore, several GSL genes may also contribute to low-Ca tolerance.
Here, we screened Arabidopsis mutants for low-Ca sensitivity and found that the GSL1 gene is essential for low-Ca tolerance. Similar to gsl10, we found that gsl1 mutants exhibited increased cell death and reduced ectopic callose accumulation under low-Ca conditions. Furthermore, the gsl1 gsl10 double mutant was more sensitive to low-Ca conditions than were the corresponding single mutants, indicating that the effects of GSL1 and GSL10 on low-Ca tolerance in Arabidopsis are additive. Therefore, the GSL loci may be useful for breeding low-Ca tolerant crops.
Results
lcs4 and lcs5 shoots exhibit low-Ca sensitivity
To identify genes that are essential for low-Ca tolerance, we screened for mutants that were sensitive to low-Ca conditions from an ethyl methanesulfonate-mutagenized population of A. thaliana. The low-Ca-sensitive mutants lcs4 and lcs5 were isolated from this screening process (Fig. 1). Under low-Ca conditions, these mutants had smaller shoots than did wild-type Col-0 plants (Fig. 1A). The fresh weights of the mutants’ shoots were significantly less than the fresh weights of Col-0 shoots under low-Ca conditions (Fig. 1B). The new leaves of these mutants exhibited increased cell death under low-Ca conditions (Fig. 1C). The primary root lengths of lcs4 and lcs5 seedlings were shorter than the primary root lengths of Col-0 seedlings, irrespective of the Ca condition; these findings suggested that the reductions in primary root length did not depend on Ca conditions (Supplementary Fig. S1). Nutrient concentrations in the shoots of these mutants were similar to nutrient concentrations measured in Col-0 shoots, suggesting that the low-Ca sensitivity of these mutants was not caused by defects in the uptake of nutrients from roots to shoots (Fig. 1D, Supplementary Fig. S2).
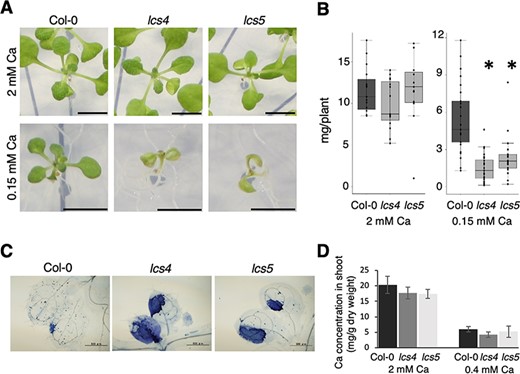
lcs4 and lcs5 are sensitive to low-Ca conditions. (A) Shoot growth of Col-0, lcs4 and lcs5. Plants were grown for 12 d under the Ca conditions. Scale bar = 5 mm. (B) Col-0, lcs4 and lcs5 shoot fresh weights. Plants were grown for 12 d under the Ca conditions. Asterisks indicate significant differences compared to Col-0 (Dunnett test, P < 0.05; n = 15–25). (C) Cell death in the first and/or second true leaves, visualized using trypan blue staining. Plants were grown in the presence of 2 mM Ca for 5 d and then transferred to 0.2 mM Ca for 3 d. Scale bar = 500 µm. (D) Ca concentrations in the shoots were determined by inductively coupled plasma mass spectrometry (mg/g dry weight). Plants were grown on media containing different concentrations of Ca for 2 weeks. Data are expressed as means ± standard deviations. No significant differences between Col-0 and each mutant (Dunnett test, P < 0.05; n = 3).
The GSL1 gene causes low-Ca sensitivity in lcs4 and lcs5
To identify the gene(s) responsible for these mutant phenotypes, we performed genetic analyses using an F2 population derived from genetic crosses with Landsberg erecta (Fig. 2). Segregation within this F2 population suggested that a single recessive locus was responsible for the phenotype; genetic mapping using simple sequence length polymorphism markers indicated that the gene(s) responsible for both the lcs4 and lcs5 phenotypes were located within a 5.6-Mbp region on Arabidopsis chromosome 4 (Fig. 2A). This suggested that the mutants may be allelic (Fig. 2A). To test this possibility, we crossed the two mutants. Similar to the parent plants, lcs4 × lcs5 F1 plants had small shoots under low-Ca conditions (Fig. 2B). This finding indicated that the same gene was responsible for both the lcs4 and lcs5 phenotypes.
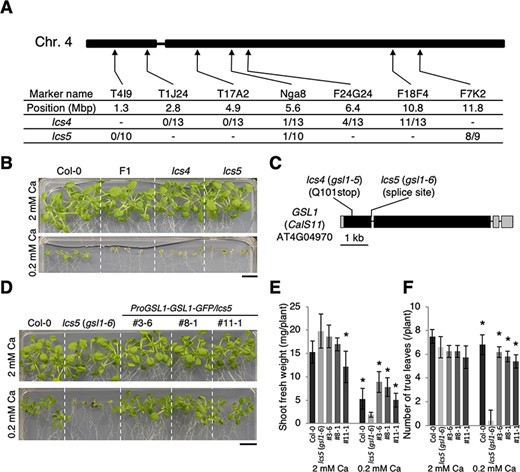
Identification of GSL 1 as the gene responsible for the lcs4 and lcs5 mutant phenotypes. (A) Map-based cloning of lcs4 and lcs5 using simple sequence length polymorphism markers. The positions of the simple sequence length polymorphism markers on chromosome 4 and the proportion of recombinant F2 plants associated with each locus are indicated. (B) Allelism test involving lcs4 and lcs5. Col-0, lcs4, lcs5 and lcs4 lcs5 F1 plants were grown for 20 d under the Ca conditions. Scale bar = 1 cm. (C) Schematic model of the GSL1 (CalS11; AT4G04970) gene, which is responsible for the lcs4 and lcs5 mutant phenotypes. The lcs4 and lcs5 mutations are shown. Filled boxes, gray boxes and thick bars indicate coding sequences, untranslated regions and introns, respectively. (D) Complementation test of lcs5. Col-0, lcs5 and GSL1-GFP/lcs5 lines were grown for 17 d under the Ca conditions. Scale bar = 1 cm. (E) Shoot fresh weights for the GSL1-GFP/lcs5 lines presented in (D). Data are expressed as means ± standard deviations. Asterisks indicate significant differences compared to lcs5 (gsl1-6; Dunnett test, P < 0.05; n = 4–5). (F) The number of true leaves in the GSL1-GFP/lcs5 lines presented in (D). Data are expressed as means ± standard deviations. Asterisks indicate significant differences compared to lcs5 (gsl1-6; Dunnett test, P < 0.05; n = 4–5).
We sequenced genomic DNA from the lcs4 and lcs5 mutants to identify the corresponding mutations. We found that lcs4 had a nonsense mutation and lcs5 had a splice site mutation in the GSL1 gene, AT4G04970 (Fig. 2C). In addition, the reduction of shoot growth in gsl1-2 (SALK_040711; Lü et al. 2011) under low-Ca conditions suggested the possibility that GSL1 is involved in low-Ca tolerance (Supplementary Fig. S3). To confirm that GSL1 was responsible for the lcs4 and lcs5 phenotypes, we introduced a wild-type copy of GSL1 into the lcs5 mutant and grew T3 plants under low-Ca conditions (Fig. 2D). Introduction of the wild-type GSL1 gene led to the recovery of low-Ca tolerance in the lcs5 mutant (Fig. 2D). The fresh weight of the shoots and the number of true leaves in these T3 plants were also phenotypically similar to those in wild-type plants (Fig. 2E, F). Therefore, mutations in the GSL1 gene cause the low-Ca-sensitivity phenotypes exhibited by lcs4 and lcs5. Because four alleles of GSL1 have already been identified (Enns et al. 2005, Lü et al. 2011), we now refer to lcs4 and lcs5 as gsl1-5 and gsl1-6, respectively. The gsl1-5 mutant has a nonsense mutation upstream of the GSL1 functional domain, which abolishes enzyme activity; therefore, GSL1 activity is presumably essential for low-Ca tolerance in Arabidopsis. Following experiments were performed mainly on Col-0 and gsl1-5.
The shoot gsl1-5 genotype is responsible for necrosis in new leaves under low-Ca conditions
Gene expression database information (eFP browser; Winter et al. 2007) showed that GSL1 transcripts were present in both shoots and roots; however, the mutant phenotype was only evident in shoots. We conducted grafting experiments involving Col-0 and gsl1-5 to determine the roles of shoots and roots in the development of the low-Ca tolerance phenotype (Fig. 3). Most of the self-grafted plants of Col-0/Col-0 did not exhibit necrosis, while most of gsl1-5/gsl1-5 (scion/rootstock) self-grafts exhibited necrosis, suggesting that grafting has little effect on mutant phenotypes. We found that necrotic lesions on new leaves were prevalent in gsl1-5/Col-0 (scion/rootstock) plants, while none of the Col-0/gsl1-5 plants exhibited necrotic lesions (Fig. 3A, B). These results suggest that local expression of GSL1 prevents necrosis in new leaves.

Grafting assay. (A) Grafting assay involving Col-0 and gsl1-5 to reveal whether the shoot or root genotype produces necrosis in the true leaves of gsl1-5 under low-Ca conditions. Plants were grown on MGRL media for 4 d. Grafting was performed on ½ × Murashige and Skoog 2% agar media; the plants were allowed to recover for 1 week. Plants were then transferred to 0.15 mM Ca for 10 days. Images show a representative plant for each combination. Scale bar = 1 cm. (B) Summary of the results of the grafting assay. Columns show the combination of genotypes for the rootstock and scion, the number of plants analyzed and the percentage of plants exhibiting necrosis in the new leaves.
GSL1 complements a yeast β-1,3 glucan synthase mutant
GSL1 is described as a β-1,3 glucan (callose) synthase gene. We tested whether GSL1 functions as a β-1,3 glucan synthase in vivo (Fig. 4). We introduced the coding sequence of GSL1 under a galactose-inducible promoter into the temperature-sensitive fks1Δfks2 mutant YOC1073 (Okada et al. 2010). The yeast strain carrying GSL1 exhibited better growth at 37°C than did a vector-only control strain (Fig. 4), suggesting that GSL1 functions as a β-1,3 glucan synthase in vivo.
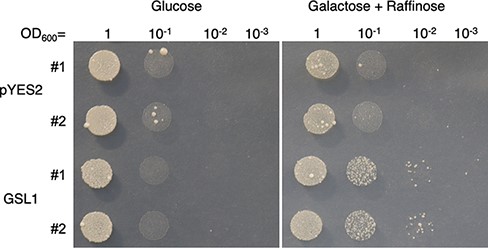
GSL1 complements a yeast β-1,3 glucan synthase mutant. Yeast complementation assay: the GSL1 gene was introduced into the temperature-sensitive yeast β-1,3 glucan synthase mutant fks1Δfks2 YOC1073, under the control of a galactose inducible promoter (Okada et al. 2010). pYES2 was the empty vector control. Two independent transformants (#1 and 2) are shown. Yeast cultures were diluted in series; 5 µl aliquots were spotted onto a Petri dish and incubated for 16 d at 37°C.
Gsl1-5 shows reduced callose accumulation under low-Ca conditions
In our previous study, we suggested that GSL10 is responsible for ectopic callose accumulation under low-Ca conditions (Shikanai et al. 2020). To investigate whether GSL1 had a similar function, we used aniline blue to stain callose in gsl1-5 cotyledons. Under normal Ca conditions, there was minimal callose in either Col-0 or gsl1-5 plants; we observed no significant difference between plants in the level of callose accumulation (Fig. 5A, B). In contrast, callose accumulated in Col-0 plants under low-Ca conditions (Fig. 5A, B). However, gsl1-5, gsl1-6 and gsl10-5 plants all exhibited less callose accumulation than did Col-0 plants under low-Ca conditions (Fig. 5A, B; Supplementary Fig. S4). Therefore, similar to GSL10, GSL1 is responsible for ectopic callose accumulation under low-Ca conditions.
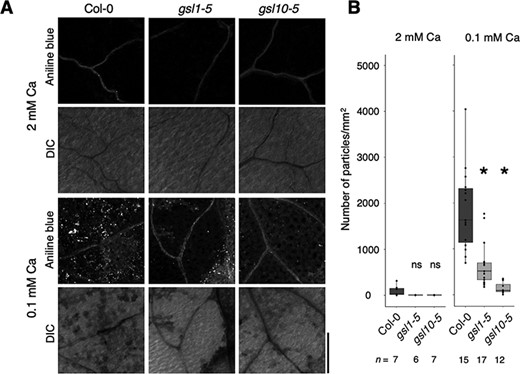
Ectopic callose accumulation under low-Ca conditions is reduced in gsl1-5. (A) Aniline blue staining for callose in Col-0, gsl1-5 and gsl10-5 cotyledons. Plants were grown for 5 d under the Ca conditions. Plants were then fixed and stained with aniline blue. Scale bar = 200 µm. (B) Quantification of callose accumulation in the cotyledons. Numbers of particles above threshold per unit area are shown. Asterisks indicate significant differences compared to Col-0 under each Ca condition (Steel test, P < 0.05). ns = no significant difference.
The gsl1 gsl10 double mutant exhibits enhanced sensitivity to low-Ca conditions
The results described above show that, similar to GSL10, GSL1 is required for low-Ca tolerance and is responsible for the accumulation of callose in the shoot under low-Ca conditions. To test whether GSL genes had additive effects on low-Ca tolerance, we investigated the effects of mildly low (0.5 and 0.4 mM) and low (0.2 mM)-Ca conditions on the gsl1-5 gsl10-5 gsl1 gsl10 double mutant. Compared with the gsl1-5 and gsl10-5 single mutants, the shoot growth in the gsl1 gsl10 double mutant was significantly reduced under mildly low-Ca conditions (Fig. 6A, B); moreover, trypan blue staining revealed that the gsl1 gsl10 double mutant exhibited increased cell death (Fig. 7A, B). These results suggest that GSL1 and GSL10 have additive effects in preventing cell death under low-Ca conditions.
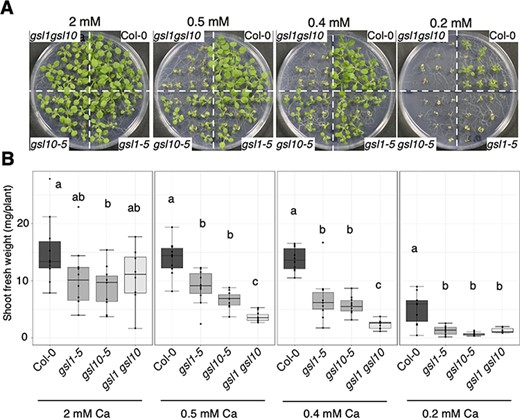
Low-Ca sensitivity of gsl1 gsl10 double mutant. (A) Shoot growth of gsl1 gsl10 double mutant. Plants were grown for 13 d under the Ca conditions. Scale bar = 1 cm. (B) Shoot fresh weights for the Col-0, gsl1-5, gsl10-5 and gsl1 gsl10 double mutant seedlings presented in (A). Different letters indicate significant differences under the Ca conditions (Tukey’s honestly significant difference test, P < 0.05; n = 7–10).
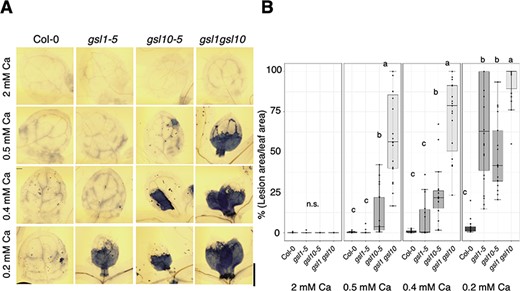
Cell death in gsl1 gsl10 double mutant under low-Ca conditions. (A) Trypan blue staining of the first or second true leaves of Col-0, gsl1-5, gsl10-5 and gsl1 gsl10 double mutant seedlings. Plants were grown under 2 mM Ca for 5 d, then transferred to 2 mM or 0.2 mM Ca for 2 d. Scale bar = 500 µm. (B) Percentage of lesion area per leaf area. In total, 11–22 individual first and second true leaves were used for quantification. Different letters indicate significant differences under each Ca condition (Steel–Dwass test, P < 0.05). ns = no significant difference.
Discussion
GSL1 and GSL10 genes have redundant functions in low-Ca tolerance
We demonstrated that the GSL1 and GSL10 genes increase low-Ca tolerance via similar mechanisms (e.g. locally control shoot low Ca tolerance: be responsible for ectopic callose accumulation under low Ca). Moreover, the corresponding double mutant showed significant cell death even under mildly low-Ca conditions that did not severely affect the single-mutant plants, suggesting that the GSL1 and GSL10 genes produce additive effects. Therefore, we propose that a threshold level of callose synthesis is required to maintain regular growth (i.e. to limit cell death); this level may be altered by the Ca condition. For example, if all GSL proteins are functional, growth may be maintained in the presence of 0.2 mM Ca. However, if one of the required GSL genes is absent, growth may be maintained only in the presence of at least 0.4 mM Ca; if two GSLs are absent, growth cannot be maintained even in the presence of 0.4 mM Ca. Our observations support this hypothesis. There are 12 GSL genes in the Arabidopsis genome (Hong et al. 2001). Enns et al. showed that GSL1 and GSL5 exhibited functional redundancy and that either GSL1 or GSL5 was essential for pollen maturation (Enns et al. 2005). GSL10 also has several functions in plant growth; it operates both independently and redundantly with GSL5 and GSL8 (Töller et al. 2008).
We constructed a phylogenetic tree based on amino acid sequences; GSL1, 5, 8 and 10 belong to the same clade (Fig. 8). In the present study, we analyzed the gsl1 gsl10 double mutant, which comprises a null allele of GSL1 (i.e. a nonsense mutation in the first exon) and a weak allele of GSL10 (i.e. a splice site mutation at intron 47; Shikanai et al. 2020). If the contribution of GSL10 to low-Ca tolerance was completely dependent on GSL1, the level of low-Ca sensitivity exhibited by the double mutant would be identical to the level of sensitivity exhibited by the gsl1-5 mutant. However, we observed an increase in low-Ca sensitivity for the double mutant, indicating that GSL1 and GSL10 (at least partially) contribute independently to low-Ca tolerance.
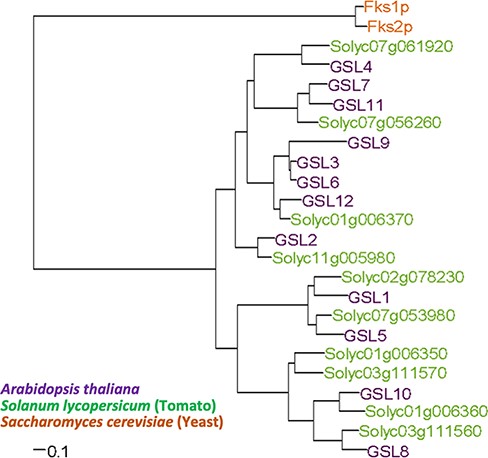
Phylogenetic tree of the β-1,3 glucan synthase family proteins in A. thaliana, S. lycopersicum and S. cerevisiae. The amino acid sequences of the β-1,3 glucan synthase protein family were compared among A. thaliana, S. lycopersicum and S. cerevisiae. Multiple sequence alignment was performed using the clustalW program based on the unweighted pair-group method with arithmetic mean.
It remains unclear how the redundant and/or independent roles of the GSL genes have evolved. The synthesis of cellulose (β-1,4 glucan) in the primary cell wall is carried out by six heterotrimers of cellulose synthase (CESA) 1, 3 and 6 (Desprez et al. 2007, Persson et al. 2007, Kumar and Turner 2015). Of these, CESA1 and 3 are essential, whereas CESA6 is partially redundant with other CESA proteins (CESA2, 5 and 9; Desprez et al. 2007, Persson et al. 2007). Notably, the GSL8 and GSL10 proteins may physically interact in a yeast system (Saatian et al. 2018); both the GSL8 and GSL10 genes have essential functions in Arabidopsis (Töller et al. 2008, Huang et al. 2009). As in cellulose synthesis, callose synthesis may involve a GSL protein complex and some GSL protein functions may be redundant, whereas other functions may be independent.
Callose accumulation and the inhibition of cell death
We found that gsl1 mutants accumulated lower levels of ectopic callose and exhibited increased cell death (Figs. 1C, 5A, B)., On the other hand, Ca concentrations in the shoot of gsl1 mutants were similar to those of Col-0 (Fig. 1D). This suggests that the low-Ca sensitivity of the gsl1 mutants is not due to lower Ca absorption than Col-0 but to a reduction of callose required to suppress cell death triggered by low-Ca conditions. We propose two potential underlying mechanisms. First, cells accumulate callose under low-Ca conditions; this may alter the distribution of Ca inside and outside the cell, thereby preventing cell death (Fig. 9A). As described above, previous studies have shown that genetic modifications leading to an increased extracellular Ca concentration may suppress the symptoms of Ca deficiency (de Freitas et al. 2011, de Freitas et al. 2012). Ca is required for the formation of a pectin-based gel structure. However, callose may allow a gel structure to form in the absence of Ca (Stone 2006). Second, the accumulation of callose may inhibit the diffusion of molecules (e.g. reactive oxygen species or cytosolic Ca2+) that propagate cell death (Fig. 9B). Runaway cell death may occur under low-Ca conditions (Figs. 1C, 7A; Jabs et al. 1996, Rustérucci et al. 2001). However, callose accumulation may inhibit the diffusion of molecules that cause these hypersensitivity reaction cascades. This explanation is consistent with the large increase in cell death observed in gsl mutants that exhibit decreased callose accumulation.
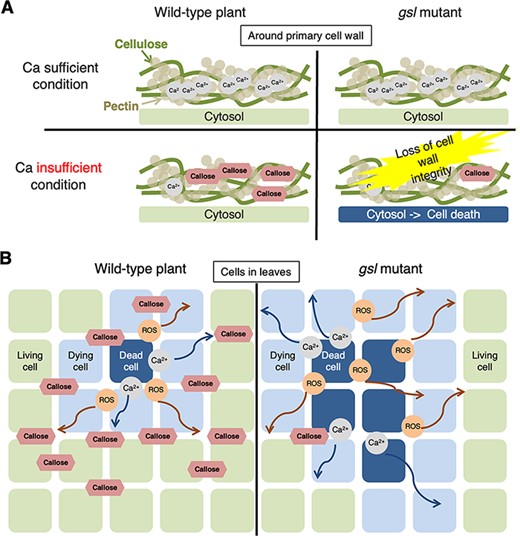
Two possible mechanisms how callose may prevent cell death under low-Ca conditions. (A) Possibility 1: Callose compensates for pectin–Ca. Callose accumulation may compensate for decreased cross-linking between pectin and Ca, thereby maintaining cell wall integrity and inhibiting cell death. (B) Possibility 2: Callose blocks cell death propagation. Callose deposition may inhibit the apoplastic and/or symplastic diffusion of signaling molecules that induce cell death, such as Ca2+ or reactive oxygen species.
In this study, we showed that the GSL1 and GSL10 genes have additive functions in promoting low-Ca tolerance in Arabidopsis. Callose is an essential component of cell walls; it also has important roles in shielding plants against their external environment, including pathogen attacks. GSL genes may vary among crops and cultivars; some of these variations may influence the level of susceptibility to Ca deficiency. Our study provides valuable insight that may be used to develop low-Ca-tolerant crops and improve agricultural productivity.
Materials and Methods
Plant and yeast growth conditions
For phenotyping analyses, surface-sterilized seeds were sown on media containing nutrients (Yamagami medium; Shikanai et al. 2015) with 1% (w/v) sucrose (84097-250G; Sigma-Aldrich Corp., St. Louis, MO, USA) and 1.5% (w/v) or 0.7% (w/v) purified agar (01056-15; Nacalai Tesque, Kyoto, Japan). After the seeds had been vernalized at 4°C for 2–7 d, the plates were positioned vertically (1.5% agar) or horizontally (0.7% agar) in a growth chamber with a 16-h light/8-h dark photoperiod at 22°C.
For the yeast (Saccharomyces cerevisiae) complementation assay, yeast strains carrying the appropriate plasmids were inoculated in 2 mL of selective acid-hydrolyzed casein (AHCW) medium with 2% (w/v) glucose (Ueoka-Nakanishi et al. 2000); they were incubated for 3 d at 27°C. Yeast cells were collected by centrifugation (6,000 rpm, 1 min), resuspended in distilled water and adjusted to an OD600 of 1. Aliquots of yeast culture (5 µl) were diluted in a 10-fold series (OD600 = 1.0, 0.1, 0.01 and 0.001) and spotted onto solid AHCW/glucose (control) or AHCW/2% galactose with 1% raffinose (galactose-inducible conditions) media for 13 d at 37°C.
Plant genotyping
The primers used in this study are listed in Supplementary Table S1. To determine the mutations responsible for the gsl1-5 (lcs4), gsl1-6 (lcs5) and gsl10-5 phenotypes, derived cleaved amplified polymorphic sequence markers were used together with the corresponding restriction enzymes (nos. 1–6) that are listed in Supplementary Table S1. To establish the homozygous line of gsl1-2 (SALK_040711), nos. 7–9 primers were used.
Nutrient concentrations
Approximately 10–20 mg of shoot tissue were excised, washed in deionized water and dried at 60°C for 2 d. After measurement of the dry weight, the samples were digested with 0.5 ml of 13 M nitric acid (Wako Pure Chemical Industries, Ltd, Osaka, Japan) for 1.5 h at 120°C. Then, 0.5 ml of hydrogen peroxide was added and pellets were digested for 1.5 h at 120°C. After complete evaporation of hydrogen peroxide, the pellets were dissolved in 0.08 M nitric acid containing 2 ppb indium. Nutrient concentrations were determined by inductively coupled plasma mass spectrometry (SPQ9700; SII NanoTechnology Seiko, Tokyo, Japan).
Introduction of GSL1 into gsl1-6
Initial attempts to clone genomic GSL1 into Escherichia coli were unsuccessful. Therefore, we cloned GSL1 into yeast using the following method. Wild-type genomic GSL1 DNA, including 2.1 kbp upstream of ATG, was amplified by polymerase chain reaction (PCR) using primers 10 and 11 (Supplementary Table S1). PrimeSTAR Max (TaKaRa Bio, Inc., Shiga, Japan) was used for PCR, in accordance with the manufacturer’s instructions. The longest amplified fragment from pSU23 (4.4 kb; Nagano et al. 2007) was linearized by EcoRI and BamHI; the longest and second longest fragments (6.6 and 4.3 kb) from pMDC107 (Curitis et al. 2003) were linearized by BlpI, MluI and AscI. These fragments were transformed into the S. cerevisiae strain W303-1A using the gap-repairing method with homologous recombination. The transformants were selected on uracil medium with AHCW/glucose (Ueoka-Nakanishi et al. 2000). After recombination had been confirmed by restriction digestion (PstI products = 8.1, 6.2 and 6.2 kb; EcoRI products = 12, 5.0 and 3.9 kb), a single colony was cultured in 200 ml of AHCW/glucose medium to prepare plasmid from yeast using the alkaline-sodium dodecyl sulfate method. The plasmid was introduced into the Agrobacterium tumefaciens strain GV3101 carrying pMP90 using the freeze/thaw method, and the plasmid prepared from A. tumefaciens was sequenced. There was one nonsynonymous mutation (V1419I) within the construct. The effect of this nonsynonymous mutation was not tested because the amino acid alteration was not conserved in the GSL family in A. thaliana or FKS in S. cerevisiae. A. thaliana was transformed using the method described by Clough et al. (1998).
Construction of the yeast expression vector pYES2::GSL1
Wild-type GSL1 coding sequences were amplified by PCR using primers 12 and 13 (Supplementary Table S1) and Col-0 cDNA as a template. pYES2 (Thermo Fisher Scientific, Waltham, MA, USA) was used as the vector. PrimeSTAR GXL (TaKaRa Bio, Inc.) was used for PCR, in accordance with the manufacturer’s instructions. The amplified fragment and vector fragment of pYES2 (digested by HindIII and EcoRI) were purified and introduced into the yeast fks1Δfks2 mutant strain YOC1073 (MATa ade2 his3 leu2 lys2 trp1 ura3 fks1::HIS3 fks2::LYS2 ade3::fks1-1082:TRP1; Okada et al. 2010) by homologous recombination. Yeast was transformed using the lithium acetate method.
Construction of a phylogenetic tree
The amino acid sequences of the β-1,3 glucan synthase protein family from A. thaliana, Solanum lycopersicum and S. cerevisiae were obtained from The Arabidopsis Information Resource (http://www.arabidopsis.org/), the Sol Genomics Network (https://solgenomics.net/) and the S. cerevisiae database (http://www.yeastgenome.org/), respectively. Multiple sequence alignment was performed using the clustalW program, based on the unweighted pair-group method with arithmetic mean. The phylogenetic tree was constructed using the ape package (Paradis and Schliep 2019) in R software.
Grafting assay
Plants were grown on MGRL media (Fujiwara et al. 1992) for 4 d before grafting. After grafting, the plants were incubated on ½ × Murashige and Skoog media for 7 d. Successfully grafted seedlings were transferred to Yamagami medium with the indicated Ca conditions for 10 d.
Trypan blue staining and cell death measurements
Trypan blue staining was performed as described previously (Koch and Slusarenko 1990, Fukuda et al. 2016). Tissue was stained using trypan blue in 24-well plates. Whole shoot tissue (10–15 shoots per well) was incubated in approximately 200 µl of lactophenol trypan blue solution (5 ml lactic acid, 5 g phenol, 5 mg trypan blue, 5 ml glycerol, 20 ml ethanol and 5 ml distilled water) on a heating block at 90°C for 5–10 min. Next, the lactophenol trypan blue solution was removed from the wells and approximately 200 µl of chloral hydrate [chloral hydrate:distilled water = 5:2 (w/w)] was added to each well. The samples were incubated at 27°C overnight, mounted on glass slides and photographed using fluorescence microscopy under bright-field mode. Fiji software was used for quantitative analyses (Schindelin et al. 2012; https://fiji.sc/). The Fiji color-threshold function was used to measure leaf areas and distinguish stained areas; these measurements were used for statistical analyses and to quantify cell death.
Aniline blue staining and callose quantification
Shoots from 5-day-old A. thaliana seedlings were excised and incubated overnight at 4°C in a 24-well plate (15–20 shoots per well) with approximately 200 µl of fixative solution (methanol:water:acetic acid = 5:4:1; Truernit et al. 2008). After removal of the fixative solution, 200–400 µl of 80% ethanol was added to each well and the plates were incubated on a heating block at 80°C for 5–10 min (until the samples were colorless). Next, the ethanol was removed from each well and approximately 200 µl of chloral hydrate [chloral hydrate:distilled water = 5:2 (w/w)] was added. The samples were incubated at 27°C overnight. After removal of the chloral hydrate solution, the samples were incubated with 1 M glycine (pH 9.5) at 4°C for at least 3 h. The samples were then incubated with 0.1 mg/ml aniline blue (016-21302; Wako Pure Chemical Industries, Ltd.) in 1 M glycine (pH 9.5) for 2 h. Finally, the samples were mounted on glass slides with a 1:1 mixture of glycerol and 1 M glycine (pH 9.5) and then photographed using a Fluoview 1000 confocal laser scanning microscope (Olympus, Tokyo, Japan). Square images were acquired; each image was centered on the target cotyledon at an optical depth that showed the vascular bundles. The excitation wavelength was 405 nm, and emission wavelengths were monitored from 480 to 530 nm. Each image was quantified using Fiji software (Schindelin et al. 2012; https://fiji.sc/); the number of particles above the threshold level in the center of each image (i.e. the center square of a 3 × 3 grid) was counted using the ‘analyze particles’ function. The threshold was set to ignore autofluorescence from dead cells, which was assessed using the samples that were treated in the absence of aniline blue. The number of particles was equivalent to the number of callose spots. The number of callose spots per 1-mm2 leaf area was quantified for subsequent analyses.
Statistical analyses
Statistical analyses were performed using R software (ver. 4.0; R Core Team 2020). To analyze the fresh weight data, Dunnett’s test or Tukey’s honestly significant difference test was used. To analyze cell death and callose staining data, the nonparametric Steel test or the Steel–Dwass test was used.
Supplementary Data
Supplementary data are available at PCP online.
Data Availability
The data supporting the findings of this study are available from the corresponding author, T.F., upon reasonable request.
Funding
JSPS KAKENHI (17J06965 to Y.S., 17H03782 to T.K.,15H01224, 18H05490, 19H05637 and 25221202 to T.F.).
Acknowledgements
We thank Arabidopsis Biological Resource Center for providing us with plant materials (SALK_040711). We thank Yuko Kawara and Emiko Yokota for excellent technical assistance. We thank Functional Genomics Facility, NIBB Core Research Facilities, for technical support.
Author Contributions
M.Y., T.K. and T.F.: conceptualization; K.Y., S.S. and T.K.: formal analysis; Y.S., T.K. and T.F.: funding acquisition; Y.S., S.T., Y.E., M.Y. and T.K.: investigation; T.K. and T.F.: project administration; M.Y. and T.K.: resources; T.F.: supervision; Y.S., T.K. and T.F.: validation; Y.S., T.K. and T.F.: visualization; Y.S., T.K. and T.F.: writing—original draft.
Disclosures
The authors have no conflicts of interest to declare.
