


Abstract
We present measurements of the soft X-ray background emission for 130 Suzaku observations at 75° < l < 285° and |b| > 15° obtained from 2005 to 2015, covering nearly one solar cycle. In addition to the standard soft X-ray background model consisting of the local hot bubble and the Milky Way Halo (MWH), we include a hot collisional-ionization-equilibrium component with a temperature of ∼0.8 keV to reproduce spectra of a significant fraction of the lines of sight. Then, the scatter in the relation between the emission measure vs. temperature of the MWH component is reduced. Here, we exclude time ranges with high count rates to minimize the effect of the solar wind charge exchange (SWCX). However, the spectra of almost the same lines of sight are inconsistent. The heliospheric SWCX emissions likely contaminate and give a bias in measurements of temperature and the emission measure of the MWH. Excluding the data around the solar maximum and using the data taken before the end of 2009, at |b| > 35° and 105° < l < 255°, the temperature (0.22 keV) and emission measure (2 × 10⁻³ cm−6 pc) of the MWH are fairly uniform. The increase of the emission measure toward the lower Galactic latitude at |b| < 35° indicates the presence of a disk-like morphology component. A composite model which consists of disk-like and spherical-morphology components also reproduces the observed emission measure distribution of MWH. In this case, the hydrostatic mass at a few tens of kiloparsec from the Galactic center agrees with the gravitational mass of the Milky Way. The plasma with the virial temperature likely fills the Milky Way halo in nearly hydrostatic equilibrium. Assuming a gas metallicity of 0.3 solar, the upper limit of the gas mass of the spherical component out to 250 kpc, or the virial radius, is ∼ a few × 1010 M⊙.
1 Introduction
Galaxies are thought to be surrounded by an extended gaseous halo, the circumgalactic medium (CGM), which is expected to contain a significant fraction of the baryonic mass (e.g., Tumlinson et al. 2017 and references therein). Under the cold dark matter cosmology, galaxies grow by accretion of matter from their surroundings. The accreting gas is expected to be heated to the virial temperature by shock waves generated by mass accretion (e.g., Rees & Ostriker 1977) and fills the halo of galaxies in nearly hydrostatic equilibrium. In addition, supernovae (SNe) heat the interstellar medium and sometimes cause an outflow toward intergalactic space. Therefore, the observations of hot gas in galaxies are essential to study the structure formation of the Universe and feedback from galaxies to intergalactic space. Suzaku, Japan’s X-ray astronomy satellite, is characterized by its low background, enabling us to detect low-surface brightness X-ray emissions from hot gas in the Milky Way.
The soft X-ray background detected below ∼1 keV is thought to come mainly from the hot gas in and around the Milky Way (e.g., Snowden et al. 1998, Kuntz & Snowden 2000). The X-ray spectrum of the soft X-ray background is usually modeled with a sum of collisional-ionization-equilibrium (CIE) plasmas of 0.1 keV and 0.2–0.3 keV. A cavity surrounding the sun filled with CIE plasma with a temperature of 0.1 keV is called the Local Hot Bubble (LHB). The Milky Way Halo (MWH) component, hot gas with a temperature of 0.2–0.3 keV, probably comes from a more extended, diffuse plasma. The emission measure of the MWH component varies by over an order of magnitude, even toward the Galactic anticenter (Henley & Shelton 2013; Nakashima et al. 2018). The detection of absorption lines of O vii and O viii in the X-ray spectra of active galactic nuclei (e.g., Nicastro et al. 2002; Fang et al. 2003; Hagihara et al. 2010) confirmed the presence of 0.2–0.3 keV plasma around the Milky Way. In addition, Yoshino et al. (2009), Henley and Shelton (2013), Sekiya et al. (2014a), Nakashima et al. (2018), and Gupta et al. (2021, 2022) reported “excess” emissions which can be modeled by a plasma with a supersolar Ne|$/$|Fe ratio or a higher temperature component (0.5–0.9 keV) from some lines of sight.
Heliospheric and geocoronal solar wind charge exchange (SWCX) emissions sometimes contaminate the soft X-ray emissions from outside the solar system. The SWCX emission is caused by interaction between the solar wind ions and neutral atoms (e.g., Cravens et al. 2001; Koutroumpa et al. 2007). In some cases, highly time-variable strong emission lines of C, O, Ne, and Mg possibly caused by geocoronal SWCX were detected with XMM-Newton (e.g., Carter et al. 2010) and Suzaku (e.g., Fujimoto et al. 2007; Ishi et al. 2019). These emissions can be filtered using light curves in the soft energy band and ion flux measurements of the solar wind. The time variation of the heliospheric SWCX should be much slower, and its intensity is expected to relate to the solar cycle. Yoshitake et al. (2013) studied O vii line intensity toward the Lockman hole observed with Suzaku from 2006 and 2011. After screening the geocoronal SWCX emissions using the soft-band light curve and proton flux of the solar wind, they found an O vii line enhancement possibly related to the heliospheric SWCX. Qu et al. (2022) measured the O vii and O viii line strengths using the XMM data from 2000 to 2010 and studied the correlation with the solar activity. They concluded that the heliospheric SWCX emissions significantly (|$30\%$|–|$50\%$|) contaminate these O lines on average.
In addition to the SWCX components, Suzaku data was contaminated with the strong O i Kα line scattered by the Earth’s atmosphere around the solar maximum (Sekiya et al. 2014b).
In this study, we present data analysis of 130 observations with Suzaku at 75° < l < 285° and at |b| > 15°, excluding the Galactic center and the Galactic plane, to study the distribution of the hot gas which fills the Milky Way halo. Here, l is the Galactic longitude and b is the Galactic latitude. These data were obtained from 2005 to 2015, covering nearly one solar cycle. Some regions are observed multiple times and therefore suitable for studying the contaminations by SWCX. In section 2, we describe the observations and data reduction. The spectral analysis and results are presented in section 3. We present the results of spectral fittings with an extra hot CIE component with a temperature of 0.8 keV. This paper mainly shows the temperatures and emission measures of the MWH component. Those of the 0.8 keV component will be presented in another paper (H. Sugiyama et al. in preparation). We discuss and summarize the results in sections 4 and 5, respectively. This paper uses the solar abundance table by Lodders (2003). Errors are reported at the |$68\%$| confidence level unless otherwise stated.
2 Observations and data reduction
We analyzed archival Suzaku/XIS data of 130 observations toward 75° < l < 285° and |b| > 15°. The observation log is shown in the Appendix. Here, we excluded regions around extended objects, such as clusters of galaxies and supernova remnants. The observations around very bright point sources are also excluded. The sample includes 10 data toward Lockman Hole from 2005 to 2014, six data toward the North ecliptic pole (NEP) obtained in 2005, 2006, and 2009, and four data toward the South ecliptic pole (SEP) observed in 2009. The pointing position of the Lockman Hole observation in 2005 is offset by 0|${_{.}^{\circ}} $|5 from the other Lockman Hole observations. Those of the NEP in 2005 and 2006 are nearly identical, but the other four are offset by ∼1|${_{.}^{\circ}} $|2. These observations with almost the same sightlines are suitable to constrain contaminating emissions caused by solar activity.
The XIS has four CCD sensors: XIS 0, 2, and 3 contain front-illuminated (FI) CCDs and XIS 1 has a back-illuminated (BI) CCD (Koyama et al. 2007). The Suzaku/XIS detectors are sensitive in the 0.4–10 keV energy band with a field of view (FOV) of ∼18′ × 18′. We analyzed the data of the four CCDs taken before the loss of XIS2 in 2006 November. After the loss, we analyzed the data of the three remaining CCDs. We used data with normal clocking mode with no window option. Data obtained with 3 × 3 and 5 × 5 editing modes were merged, and the standard filtering procedures (Earth elevation > 10°, cutoff rigidity > 6 GeV c−1) were applied. Additional flickering pixels were removed.1
To remove point sources in the XIS FOVs, we created images in the 0.5–2.0 keV and 2.0–5.0 keV energy bands and applied the wavdetect tool in the CIAO package. From the subsequent analysis, we excised circular regions around the point source candidates with a significance of >3σ. For sources with a flux lower than 5.0 × 10⁻¹⁴ erg s−1 cm−2 in the energy band of 0.5–5.0 keV, we excised the circular region centered on each source with a radius of 1′. For brighter sources, this radius is not sufficient to exclude scattered photons by the X-ray telescopes of Suzaku. For example, two stars emit strong Fe-L lines, numbered 8 and 10 in figure 1, in the FOV of the Lockman hole observation in 2005. Scattered photons from these stars strongly contaminate the spectra when the exclusion radius is 1′. Therefore, for each brighter source, we determined the exclusion radius based on its flux in the 0.5–5.0 keV band. For example, the exclusion radii for the flux of 1.0 × 10⁻¹³ erg s−1 cm−2 and 5.0 × 10⁻¹² erg s−1 cm−2 are |${1{^{\prime }_{.}}5}$| and |${4{^{\prime }_{.}}5}$|, respectively. For sources with a power-law spectrum of a photon index of 1.7, these radii correspond to a flux level of scattered photons from the point source that is half of the background. Further increasing the exclusion radii did not change the results.
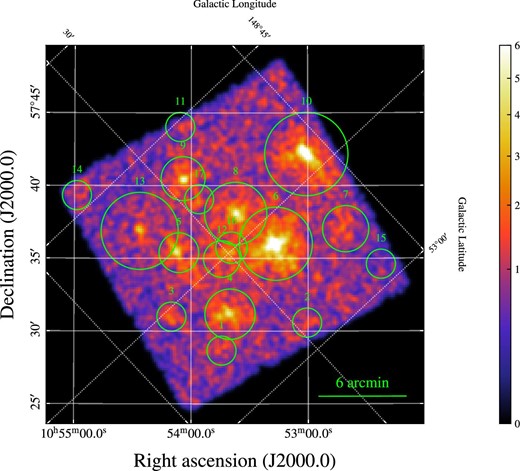
XIS 1 image (0.5–5.0 keV) of Lockman Hole (OBSID:100046010) observed in 2005. The circular regions with numbers are excluded from the spectral analysis.
To decrease the contamination caused by the SWCX and other background fluctuations, we created light curves and excluded the time ranges when the count rate exceeded 3σ. To increase the available exposure time, we have not adopted any further filtering using the proton flux of the solar wind to reduce the effect of the SWCX or using the elevation angle from the sunlit Earth’s limb to suppress contamination by the O i emission from the Earth’s atmosphere. The screening criteria used in this work are similar to those used to study low-surface brightness targets and, therefore, suitable to study the effects of the systematic uncertainties in other data obtained with Suzaku.
3 Spectral analysis and results
We extracted a spectrum over the FOV of each XIS detector of each observation. To create ancillary response files (ARFs), we used the xissimarfgen ftools task (Ishisaki et al. 2007) assuming uniform emission from a circular region with a radius of 20′. The effects of contaminants and the optical blocking filter of XISs were included in the ARFs. We used the xisrmfgen ftools task to create the redistribution matrix files (RMFs). The instrumental background, or non-X-ray background (NXB), was estimated from the night-Earth database using the xisnxbgen ftools task (Tawa et al. 2008). We used XSPEC version 12.10.1b to model the NXB-subtracted spectra. Unless otherwise stated, we used energy ranges of 0.4–7.0 keV for the BI spectra, and 0.5–7.0 keV for the FI spectra. We rebinned each spectrum to a minimum of one count per bin and employed the extended C-statistic (Cash 1979). We used APEC (Astrophysical Plasma Emission Code; Smith et al. 2001; Foster et al. 2012) with AtomDB version 3.0.9 to model a CIE plasma.
3.1 Stacked spectra of the 130 observations
To study possible emission components of the soft X-ray background, we created stacked XIS-FI (XIS 0, 2, 3) and XIS-BI (XIS 1) spectra of the 130 observations. We first tried a spectral fitting with a model which consists of four components: the cosmic X-ray background (CXB), two CIE components (apec model in XSPEC) to model the LHB (and SWCX) and MWH, and the O i Kα line for the scattered photon from the sunlit atmosphere of the Earth. Hereafter, we denote this model as Model-s. We adopted a power-law model with a photon index of 1.4 to model the CXB component. The emission from the heliospheric SWCX and LHB are empirically modeled with an unabsorbed CIE component of kT ∼ 0.1 keV with the solar metallicity (e.g., Fujimoto et al. 2007; Yoshino et al. 2009; Henley & Shelton 2013; Nakashima et al. 2018). We also fixed the temperature of the LHB component at 0.1 keV and the abundances of the LHB and MWH components at 1 solar. The CXB and the MWH components are subject to photoelectric absorption due to cold gas, and we modeled this absorption using the phabs model in the XSPEC spectral fitting tool. A Gaussian at a fixed central energy of 0.525 keV was used to model the O i line. The normalization of each component was allowed to vary. Hereafter, we call the temperature and emission measure (∫nenHds) of the MWH component as kThalo and EMhalo, respectively. Here, |$n_{\rm e}$|, |$n_{\rm H}$|, and s are electron density, hydrogen density, and the distance along the line of sight, respectively.
We fitted the stacked BI and FI spectra simultaneously with Model-s. Here, we used energy ranges of 0.5–7.0 keV and 0.6–7.0 keV for the BI and FI spectra, respectively, since stacking may cause some problems in the lower energy band due to stacking spectra with different column densities of the contamination and the Galactic absorption. Since there is a slight discrepancy between the stacked FI and BI spectra in the lower energy band, we allowed the NH for the two spectra to vary separately. The result of the spectral fitting with Model-s is shown in table 1, and the stacked BI spectrum and the best-fitting model are shown in figure 2. This fit cannot reproduce the spectra with a C-statistics|$/$|d.o.f of 6843/3524 and there remain clear residual structures at 0.7–1 keV.
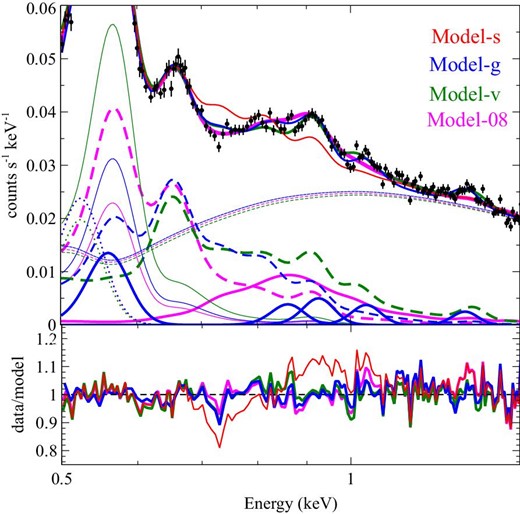
Stacked XIS 1 spectra (top) and data-to-model ratio (bottom) fitted with Model-s (red), Model-g (blue), Mosel-v (green), and Model-08 (magenta). The contributions of MWH (thick dashed lines), LHB (thin solid lines), CXB (thin dashed lines), and O i (thin dotted lines) components for Model-g, Model-v, and Model-08 are shown. The thick magenta solid line corresponds to the 0.8 keV component for Model-08, and the thick blue solid lines are additional Gaussians for Model-g.
Fitting results of the stacked spectra.
| Model-s | Model-g | Model-v | Model-08 | |
|---|---|---|---|---|
| EMLHB* | 2.3 × 10⁻² | (1.3 ± 0.2) × 10−2 | (2.7 ± 0.1) × 10−2 | (1.1 ± 0.1) × 10−2 |
| kThalo (keV) | 0.24 | |$0.219^{+0.001}_{-0.001}$| | 0.333 ± 0.007 | 0.175 ± 0.003 |
| EMhalo* | 2.9 × 10⁻³ | (3.4 ± 0.1) × 10−3 | (3.6 ± 0.5) × 10−3 | (5.7 ± 0.3) × 10−3 |
| MWH: O (solar) | 1.0 (fix) | 1.0 (fix) | |$0.91^{+0.19}_{-0.14}$| | 1.0 (fix) |
| MWH: Ne (solar) | 1.0 (fix) | 1.0 (fix) | |$0.81^{+0.15}_{-0.11}$| | 1.0 (fix) |
| MWH: Mg (solar) | 1.0 (fix) | 1.0 (fix) | |$0.78^{+0.13}_{-0.10}$| | 1.0 (fix) |
| MWH: Fe (solar) | 1.0 (fix) | 1.0 (fix) | |$0.21^{+0.04}_{-0.03}$| | 1.0 (fix) |
| O i Normalization† | 1.7 | 1.72 ± 0.05 | 1.50 ± 0.07 | 1.80 ± 0.05 |
| NH (1020cm−2) for FI | 0.0 | 0.0 (<0.1) | 0.0 (<0.1) | 0.0 (<0.1) |
| NH (1020cm−2) for BI | 2.6 | 2.4 ± 0.3 | 3.3 ± 0.3 | 2.6 ± 0.3 |
| CXB norm‡ | 8.7 | 8.55 ± 0.03 | 8.44 ± 0.03 | 8.46 ± 0.03 |
| kT0.8 keV (keV) | — | — | — | 0.76 ± 0.01 |
| EM0.8 keV* | — | — | — | (4.6 ± 0.2) × 10−4 |
| Gaussian energy (keV) | — | 0.561 (fix) | — | — |
| Normalization† of O vii Heα | — | 1.95 ± 0.36 | — | — |
| Gaussian energy (keV) | — | 0.863 ± 0.007 | — | — |
| Normalization† of O viii 6p to 1s? Fe? | — | 0.14 ± 0.01 | — | — |
| Gaussian energy (keV) | — | 0.929 ± 0.005 | — | — |
| Normalization† of Ne ix Heα? Fe? | — | 0.16 ± 0.01 | — | — |
| Gaussian energy (keV) | — | 1.040 ± 0.003 | — | — |
| Normalization† of Ne x Lyα? | — | 0.11 ± 0.01 | — | — |
| Gaussian energy (keV) | — | 1.315 ± 0.006 | — | — |
| Normalization† of Mg xi Heα? | — | 0.063 ± 0.004 | — | — |
| C-Statistics|$/$|d.o.f | 6843/3524 | 5608/3515 | 5421/3520 | 5511/3522 |
Emission measure (integrated over the line of sight, ∫nenHds) in units of cm−6 pc.
Normalization of Gaussian in units of photons cm−2 s−1 sr−1 (LU).
Normalizations at 1 keV for the CXB component in units of photons cm−2 s−1 keV−1 sr−1.
To reproduce the residual structures, we added five Gaussians to Model-s. Here, the line widths of these Gaussians were fixed at 0. We fixed the line energy of a Gaussian at 0.561 keV, which corresponds to the forbidden line of O vii Heα. Hereafter, we call this model Model-g. The derived C-statistics, 5608, is significantly better than that for Model-s. This model can reproduce the observed line-like structures relatively well (table 1, figure 2). The best-fitting kThalo, 0.22 keV, is close to those derived with Model-s. The best-fitting energies of the other additional Gaussians are 0.86 keV, 0.93 keV, 1.04 keV, and 1.31 keV. These energies are close to those of O viii 6p to 1s line at 0.847 keV, the forbidden line of Ne ix Heα at 0.905 keV, Ne x Lyα at 1.022 keV, and the forbidden line of Mg xi Heα line at 1.331 keV, respectively.
Yoshino et al. (2009) and Nakashima et al. (2018) tried a variable abundance CIE model for the MWH component. They sometimes got a very high Ne abundance to explain the 0.9 keV peak in some spectra. We then replaced the apec model for the MWH component of the Model-s with vapec model (hereafter Model-v) and fitted the stacked spectra in the same way. The abundances of O, Ne, Mg, and Fe were allowed to vary, and those of the other elements were fixed at 1 solar. The result is shown in table 1 and figure 2. The derived C-statistics, 5421, is slightly better than that with Model-g. kThalo increased to 0.33 keV, and the abundances of O, Ne, and Mg are around 0.8–0.9 solar, while the Fe abundance is only 0.2 solar.
Yoshino et al. (2009) also tried a spectral fitting model with an additional CIE component with a temperature of 0.6–1 keV to reproduce the 0.9 keV peak. Therefore, we added another apec component (hereafter the 0.8 keV component) modified by the photoelectric absorption to Model-s and fitted the spectrum. Hereafter, we call this model Model-08. Here, the metal abundance was fixed at 1 solar. The derived C-statistics, 5511, is also much smaller than that with Model-s. The best-fitting temperature of the additional apec component is 0.76 keV, and kThalo decreases to 0.18 keV. As shown in figure 2, Model-08 gives a better fit than Model-v below 1 keV, although it fails to produce the line-like structures at 1.0 keV and 1.3 keV, which correspond to the energy of Ne Lyα and Mg Heα, respectively.
3.2 Spectral fitting of the individual observations
We then fitted the XIS spectra of the individual observations with Model-s and Model-08. Since the Model-v fits for the individual observations give similar results to those obtained by Nakashima et al. (2018), we do not present the results in this paper.
3.2.1 The standard model
We fitted the XIS spectra of the individual observations with Model-s. Photoelectric absorption by cold gas in our Galaxy was modeled using phabs with a fixed hydrogen column density at the value by Kalberla et al. (2005). The left-hand panel of figure 3 shows the scatter plot of EMhalo vs. kThalo. In most cases, kThalo and EMhalo are in the range 0.15–0.3 keV and (1–30) × 10−3 cm−6 pc, respectively, and inversely correlated. As reported by Yoshino et al. (2009), Sekiya et al. (2014a), and Nakashima et al. (2018), some observations show significantly higher kThalo around 0.5–0.8 keV. We find that observations with almost the same or nearby pointings show significantly different kThalo and EMhalo. For example, the nine Lockman Hole data obtained from 2006 to 2014 have almost the same sightlines. However, their kThalo and EMhalo are not consistent with each other and span similar ranges to those of the other observations. The EMhalo of the NEP observations in 2009, which point |$-{1{_{.}^{\circ}}2}$| offset from those in 2005 and 2006, are significantly lower than those derived for NEP in 2005 and 2006.
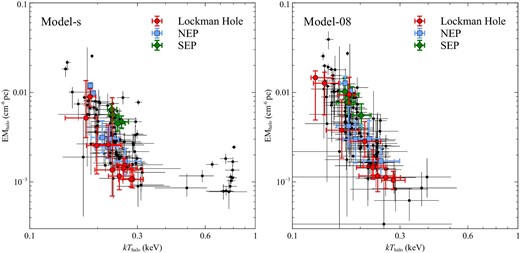
EMhalo against kThalo with Model-s (left) and Model-08 (right). The filled circles, filled squares, and filled diamonds correspond to the Lockman hole, NEP, and SEP, respectively.
3.2.2 The spectral model with a hot component
We then fitted the spectra of each observation with Model-08 but fixed the temperature of the hottest apec component at 0.8 keV. As shown in figure 4, Model-08 gives consistent or better fits than Model-s. With Model-08, among 130 observations, 56 of them got |$\Delta \rm {C}<-9$| compared to those with Model-s. Here, |$\Delta \rm {C}$| is the difference in C statistic between the two models. The results of the emission measure of the 0.8 keV component will be presented in H. Sugiyama et al. (in preparation). With Model-08, as shown in the right-hand panel of figure 3 and table 2, EMhalo spans an order of magnitude: the median value is 4.0 × 10⁻³ cm−6 pc and the 16th–84th percentile range is (1.6–10) × 10−3 cm−6 pc. The median and the 16th–84th percentile range of kThalo are 0.19 keV and 0.15–0.23 keV, respectively. kThalo and EMhalo show a clear inverse correlation with a much smaller scatter than that for Model-s. When we divide the sample into two subsamples with kThalo = 0.19 keV, the median values of EMhalo differ by a factor of ∼4 (table 2). Again, those of the Lockman Hole observations with almost the same sightline span similar ranges to the other observations and are inconsistent with each other.
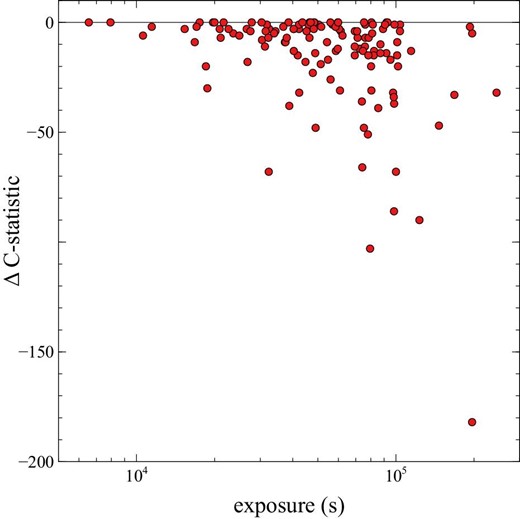
C-statistics for each observation derived from Model-08 subtracted by that from Model-s,Δ C-statistic, plotted against exposure time.
Medians and 16th–84th percentile ranges of MWH component with Model-08.
| kThalo | EMhalo | ||||
|---|---|---|---|---|---|
| Selection | N* | Median | 16th–84th percentile | Median | 16th–84th percentile |
| (keV) | (keV) | (10−3 cm−6 pc) | (10−3 cm−6 pc) | ||
| All | 130 | 0.19 | 0.15–0.23 | 4.0 | 1.6–10 |
| kThalo† ≥ 0.19 keV | 63 | — | — | 2.1 | 1.1–3.8 |
| kThalo† < 0.19 keV | 67 | — | — | 7.9 | 3.9–13 |
| 2005–2009 | 64 | 0.22 | 0.18–0.25 | 2.4 | 1.4–5.5 |
| 2010–2015 | 66 | 0.17 | 0.15–0.23 | 6.8 | 2.9–13 |
| SSN‡ < 20 | 49 | 0.22 | 0.18–0.25 | 2.1 | 1.2–4.8 |
| 20 ≤ SSN‡ ≤ 50 | 30 | 0.18 | 0.16–0.25 | 3.2 | 1.4–10 |
| SSN‡ ≥ 50 | 51 | 0.17 | 0.15–0.22 | 7.7 | 3.1–15 |
Number of observations.
Temperature of the MWH component.
13-month-averaged sunspot number.
3.3 Correlations with the solar activity
Suzaku was operated from 2005 to 2015, covering nearly one solar cycle, including the solar minimum around 2009 and the solar maximum around 2014. Yoshitake et al. (2013) found that the MWH emission measure depends on the solar activity using the Lockman hole data from 2006 to 2011 obtained with Suzaku. The discrepancy among the observations with almost the same lines of sight indicates the existence of time-variable emission. In figure 5, we plot kThalo, EMhalo, emission measures of LHB, and normalizations of the O i line with Model-08 against observation date with the 13-month smoothed sunspot number from the World Data Center SILSO, Royal Observatory of Belgium, Brussels (SILSO 2005–2015).2 kThalo tend to be higher than 0.2 keV (the median value is 0.22 keV) before the end of 2009, while most of them are lower than 0.2 keV (the median value is 0.17 keV) after 2010. As shown in figure 5, the Lockman Hole data obtained in 2012–2015 also show much higher EMhalo than those obtained in 2006–2010. Most EMhalo values of the 130 observations show a similar trend to those of the Lockman Hole. When we divide the data taken before and after the end of 2009 (hereafter 2005–2009 data and 2010–2015 data, respectively), the scatters are relatively small, as shown in table 2.
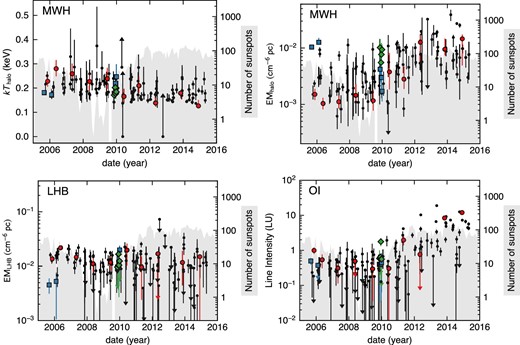
kThalo and EMhalo, the emission measures of the LHB and the normalization of O i, plotted against observation date. Filled circles, filled squares, and filled diamonds correspond to the Lockman Hole, NEP, and SEP, respectively. The gray shaded areas represent the 13-month averaged sunspot number.
The time dependence of EMhalo resembles the 13-month smoothed sunspot number. Therefore, in figure 6, we plot kThalo, EMhalo, emission measures of LHB, and normalizations of the O i line with Model-08 against the 13-month smoothed sunspot number. The medians and the 16th–84th percentile ranges of different sunspot numbers are summarized in table 2. For the data taken at the sunspot number of less than 20, kThalo and EMhalo are rather uniform, with their median values being 0.22 keV and 2.1 × 10⁻³ cm−6 pc, respectively. In contrast, for data taken at the sunspot numbers larger than several tens, EMhalo increases dramatically.
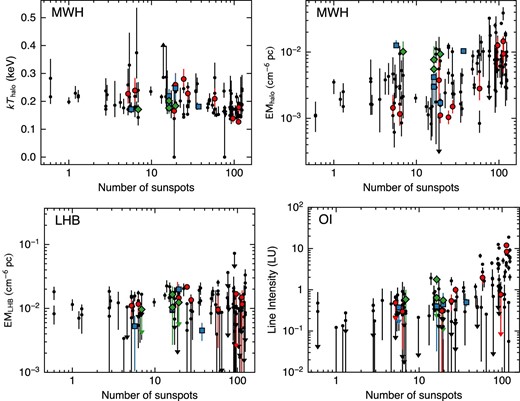
Same as figure 5, but plotted against 13-month averaged sunspot number.
As found by Sekiya et al. (2014b), the brightness of the O i line increases after the solar minimum around 2009 (figure 5). In contrast, the emission measure of the LHB does not show a significant dependence on the observation date or 13-month smoothed sunspot number (figures 5 and 6).
3.4 Time variable emission components with the Lockman Hole observations
Figure 7 shows the ratios of the XIS 1 spectra of the Lockman Hole obtained from 2009 to 2014 to the best-fitting model of the 2009 observation with Model-08. After the solar minimum around 2009, there is an enhancement at 0.56 keV which corresponds to O vii Heα. There is a weaker peak at O viii Lyα (0.65 keV) in the 2013 spectrum. In addition, a strong peak at 0.525 keV of the O i line is seen in the spectra obtained in 2013 and 2014.
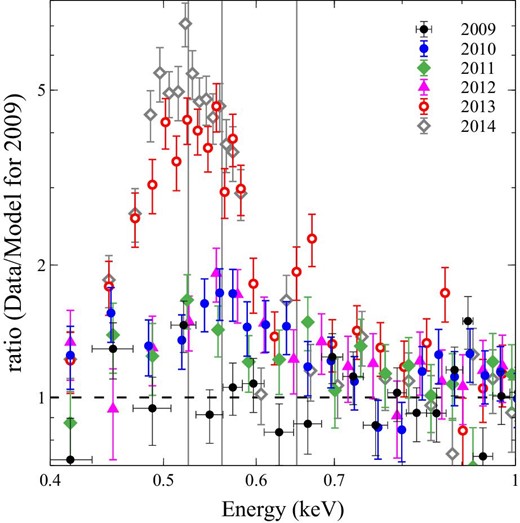
Ratios of the XIS 1 spectra of the Lockman Hole obtained from 2009 to 2014 to the best-fitting model for the 2009 observation with Model-08. The three vertical lines indicate the line energies of O i, O vii He α and O viii Lyα.
We fitted the XIS 1 spectra of Lockman Hole obtained from 2006 to 2014 simultaneously with Model-08, but we added two Gaussians at the fixed energies at O vii Heα (0.56 keV) and O viii Lyα (0.65 keV). The normalizations of the additional Gaussians are fixed at zero for the 2009 spectrum while allowed to vary for the others. The temperature of the MWH and 0.8 keV components were fixed at 0.22 keV and 0.80 keV, respectively, and the normalizations of LHB, MWH, and the 0.8 keV component were assumed to have the same values. This model yields a good fit with a C-statistic|$/$|d.o.f of 11937/11305. Although there is a hint of excess at 0.85 keV (O viii 6p to 1s) in the spectra of 2013, when we added one more Gaussian to the model, its significance is less than 2σ.
Figure 8 shows the excess line intensities of the O vii Heα, O viii Lyα, and O i compared to the 2009 spectrum plotted against the observation date. The intensities of the excess O vii line increased from the solar minimum in 2009 to the solar maximum in 2014. Figure 8 also compares the excess line strengths of the O vii line compared to the 2009 data obtained by Yoshitake et al. (2013). Our excess O vii line strength for the 2010 observation agrees well with the value derived by Yoshitake et al. (2013), although our screening criteria are not severe. In contrast, our excess O vii line strength for the 2011 data is lower than that obtained by Yoshitake et al. (2013), since their model did not include the O i line component. The excess O viii line strengths are much weaker than those of the O vii line. We detected the O viii line with >3σ significance only in 2013, where its intensity is about |$20\%$| of that of the O vii line. As found by Sekiya et al. (2014a), the O i line is very bright around the solar maximum in 2014.
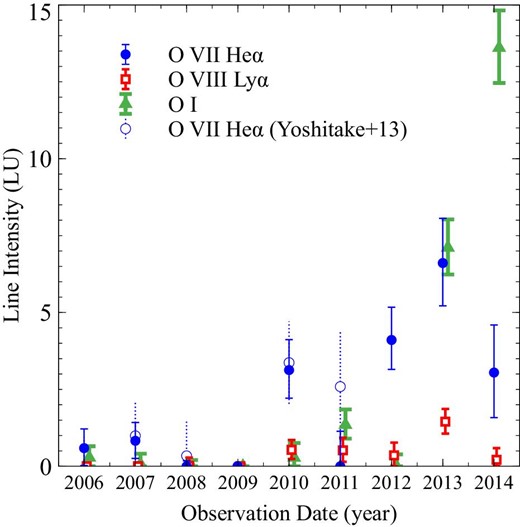
Normalizations of the Gaussians in units of LU (photons s−1 cm−2 str−1) for the excess emissions of the Lockman Hole data compared to the 2009 data at 0.56 keV (filled circles, O vii Heα), 0.65 keV (open squares, O viii Lyα), and 0.525 keV (filled triangles O i). The open circles with dotted error bars correspond to the excess O vii Heα line strengths compared to the 2009 data obtained by Yoshitake et al. (2013).
4 Discussion
4.1 Emission related to the solar activity
To study the soft X-ray background emission, we analyzed 130 Suzaku observations, covering nearly one solar cycle, including the solar minimum around 2009 and the solar maximum around 2014. The overall trend of kThalo and EMhalo with Model-08 for the 130 observations seems to depend on the solar activity (figures 5 and 6). At a given epoch, the scatter in these values is relatively small, and most of the derived values are close to those obtained from the Lockman Hole observations. Although we screened the possible geocoronal SWCX emissions using the light curve of each observation, screening the heliospheric one is challenging since the variation time scale is expected to be longer. From the Lockman Hole data with almost the same sightlines, an excess in the O vii Heα emissions of 3–7 LU (photon s−1 cm−2 str−1) is detected in 2010 and 2012–2014 compared to the 2009 data. The intensities of the excess O viii Lyα line are |$20\%$| at most of those of O vii Heα. The O vii/O viii line ratios of the excess emission are significantly different from those of the geocoronal SWCX where the strengths of the O viii line are comparable to those of the O vii line (e.g., Fujimoto et al. 2007; Ishi et al. 2019). Yoshitake et al. (2013) estimated the heliospheric SWCX emission based on the model by Koutroumpa et al. (2006). The predicted intensities of O vii and O viii lines around the solar maximum are 2.5 LU and 0.8 LU, respectively, and those around the solar minimum are 1.7 LU and 0.4 LU, respectively. With the XMM data covering 10 years, Qu et al. (2022) concluded that the average MWH fluxes are reduced from 10 LU to 5.4 LU for O vii and from 2.5 LU to 1.7 LU for O viii. These reductions are consistent with the excess O vii and O viii line strengths obtained from the Lockman Hole data around the solar maximum. These results indicate that the heliospheric SWCX emission, mainly the O vii Heα line, significantly contaminates the spectra obtained around the solar maximum.
Figure 9 shows EMhalo of the 130 observations plotted against the absolute value of the ecliptic latitude, with the color scale of the 13-month averaged sunspot number. The heliospheric SWCX is expected to be stronger near the ecliptic plane (Robertson & Cravens 2003; Koutroumpa et al. 2006). When the 13-month averaged sunspot number is larger than several tens, EMhalo tends to be high. However, no clear dependence on the ecliptic latitude is seen. Probably, the time variation of the SWCX is much larger than the spatial variation along the ecliptic latitude.
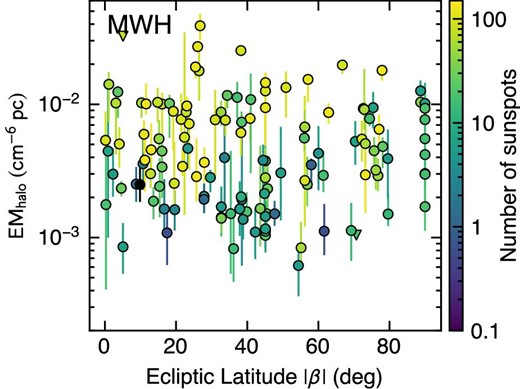
EMhalo plotted against the absolute value of the ecliptic latitude, β. The color scale indicates to the 13-month averaged sunspot number.
4.2 Correlation between temperature and emission measure of the Milky Way halo
The plot of EMhalo–kThalo shows a negative correlation as shown in figure 10. Most of the 2010–2015 data give higher EMhalo and lower kThalo compared to the 2005–2009 data. A CIE component with a temperature of ∼0.1 keV has been empirically used to represent the emissions from LHB and heliospheric SWCX (e.g., Yoshino et al. 2009; Nakashima et al. 2018). However, contaminations of the emissions related to the solar activity, mainly O vii Heα, sometimes cause overestimation of EMhalo and underestimation of kThalo, especially around the solar maximum.
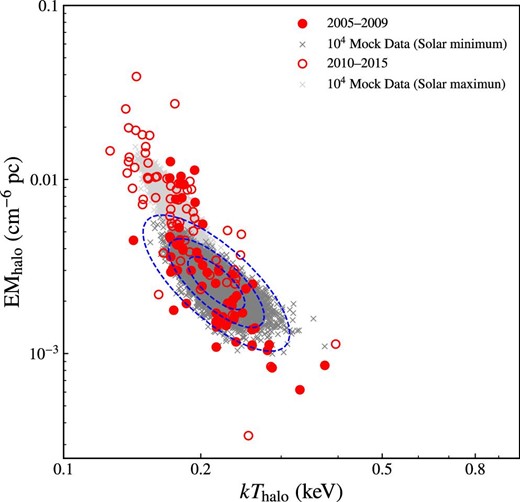
kThalo plotted against EMhalo (closed circles and open circles for the data of 2005–2009 and 2010–2015, respectively) with Model-08. The crosses (dark gray: 2005–2009; light gray: 2010–2015) shows the best-fitting values from the Mock spectra. The contours indicate the |$68\%$|, |$90\%$|, and |$99\%$| ranges from the mock spectra using the median values for the 2005–2009 data.
Since the emissivity of O viii depends on the plasma temperature, to reproduce the observed O viii line strengths, there may be some artificial negative correlation between EMhalo–kThalo. To check this effect, we created 104 mock XIS spectra with an exposure time of 50 ks and the median values for the 2005–2009 and 2010–2015 data shown in table 2 with Model-08. Figure 10 also shows the best-fitting values from the mock spectra with statistical contours. Most of the best-fitting values from the 2005–2009 data resemble the distribution from the mock spectra using their median values. In contrast, the scatter for the 2010–2015 data points is larger than that from the corresponding simulations. These results suggest that the negative correlation between EMhalo and kThalo is likely artifacts and most of EMhalo and kThalo values of the 2005–2009 data are consistent with their median values.
4.3 Comparison with previous results
Figure 11 compares our kThalo vs. EMhalo with those by Henley and Shelton (2013) and Nakashima et al. (2018). In order to minimize the contamination by SWCX, Henley and Shelton (2013) analyzed only data after 2005 and |β| > 20°. They also excluded data around the Orion–Eridanus superbubble (Reynolds & Ogden 1979; Burrows et al. 1993). As a result, their data do not include the highest emission measures which are possibly caused by the contamination of SWCX and by the emission from the bubble. A significant fraction of our data, especially those obtained before the end of 2009, is consistent with that of Henley and Shelton (2013). With the HaloSat survey data toward the southern halo (b < −30°) obtained around the solar minimum, Kaaret et al. (2020) studied the MWH halo. Their median temperature, 0.225 keV, agrees with our median value. Toward the Galactic anticenter, and high Galactic latitude, their measured emission, 4–8 × 10⁻³cm−6 pc (for 0.3 solar gas metallicity) agrees with our median values for the 2005–2009 data, considering the difference in the adopted abundance.
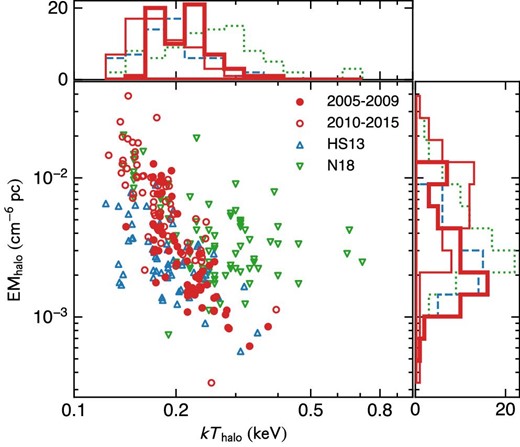
kThalo plotted against EMhalo. The histograms show the distributions of kThalo and EMhalo. Closed circles and thick lines are for the 2005–2009 data and open circles and thin lines for the 2010–2015 data with Model-08, open upward triangles and dashed lines are for the data by Henley and Shelton (2013), and open downward triangles and dotted lines are for the data by Nakashima et al. (2018). Here, the effect of the difference in the adopted solar abundance table is corrected.
In our analysis, the screening criteria to minimize the SWCX is not as strict as in Nakashima et al. (2018). Nakashima et al. (2018) used a similar variable abundance model with Model-v. Over half of the data are consistent with our work. The other data by Nakashima et al. (2018) show higher kThalo and [O/Fe] ∼0.5 to reproduce the residual structure at 0.7–1 keV, while we added the 0.8 keV component to the standard soft X-ray background model. Then, the scatter in kThalo vs. EMhalo is significantly reduced from those obtained by Nakashima et al. (2018).
It is reasonable to assume that the MWH component extends over the Milky Way considering the small scatter in the kThalo and EMhalo of 2005–2009 data, and the residual structure at 0.7–1 keV seen in some regions may be caused by some additional component. The larger C-statistic from the Model-08 fit for the stacked spectra than the Model-v fit is caused by the excess Ne and Mg line emissions at 1 keV and 1.3 keV. There may be another higher temperature component (>1 keV) or the abundance pattern of the 0.8 keV component may deviate from the solar ratio. We will discuss these possibilities in a different paper (H. Sugiyama et al. in preparation).
4.4 Spatial distribution of the Milky Way halo: the disk-like component
Figure 12 shows the sky map of the EMhalo with Model-08. Figure 13 shows kThalo and EMhalo with the same model fits, plotted against |l| and |b| Here, |l| is defined as l for 0° ≤ l < 180° and 360° − l for 180° ≤ l < 360°. The brightest regions around l ∼ 200° and b ∼ −20°, −30°, and −50° correspond to the Orion–Eridanus superbubble. Except for the regions with |l| < 105° and |b| < 35°, kThalo and EMhalo are fairly uniform when we adopt the data with a sunspot number of less than several tens. Figure 14 shows EMhalo for the 2005–2009 data, separated into four |l| ranges. For the data at |l| > 105°, the distribution of EMhalo is rather smooth, while there is a significant scatter for the data at |l| < 105°. For |b| < 35° data, there is an increase of EMhalo toward the lower Galactic latitude.
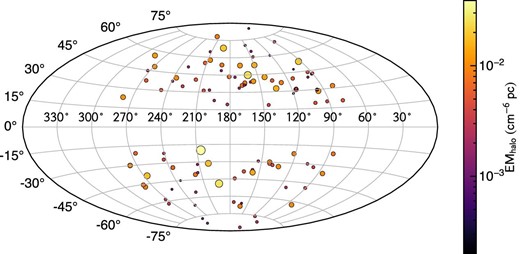
EMhalo across the sky with the galactic coordinates. The size of circles indicate EMhalo.
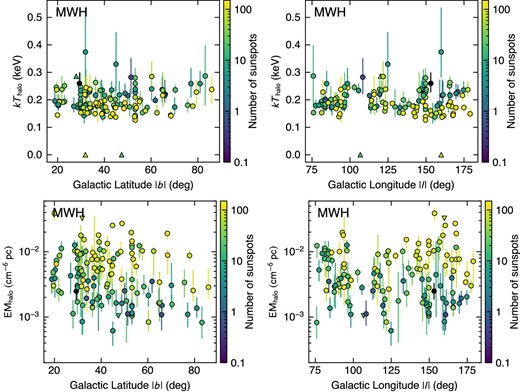
kThalo and EMhalo plotted against the absolute values of the Galactic latitude, |l| and the Galactic longitude, |b|. The color scale corresponds to the 13-month smoothed sunspot number.
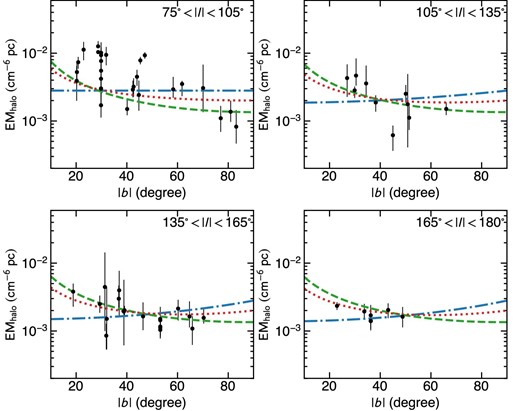
EMhalo for the 2005–2009 data, plotted against the Galactic latitude, |b| (filled circles with error bars). Each panel shows a different range of |l|. The dashed, dot–dashed, and dotted lines represent the best-fitting disk-like, spherical, and composite models, respectively, at |l| = 90°, 120°, 150°, and 180°.
Fitting results of the density distribution models for MWH.
| Disk | Spherical | |||||||
|---|---|---|---|---|---|---|---|---|
| Selection | Model | N* | |${n_{{\rm e}_0}}$|† | z0 | M(<30 kpc)‡ | nec§ | M(<250 kpc)‖ | χ2/d.o.f |
| (10−3 cm−3) | (kpc) | (108 M⊙) | (10−3 cm−3) | (1010 M⊙) | ||||
| 2005–2009 | Disk | 64 | 3.9 ± 0.2 | 2.7 | 5.6 ± 0.3 | — | — | 389/63 |
| 2005–2009, |l| > 105° | Disk | 36 | 3.4 ± 0.1 | 2.7 | 4.9 ± 0.2 | — | — | 36/35 |
| kThalo > 0.2 keV | Disk | 52 | 3.4 ± 0.1 | 2.7 | 4.9 ± 0.2 | — | — | 57/51 |
| 2005–2009 | Sphere | 64 | — | — | — | 4.1 ± 0.2 | 4.2 ± 0.2 | 439/63 |
| 2005–2009, |l| > 105° | Sphere | 36 | — | — | — | 3.6 ± 0.2 | 3.7 ± 0.2 | 59/35 |
| kThalo > 0.2 keV | Sphere | 52 | — | — | — | 3.5 ± 0.1 | 3.6 ± 0.1 | 94/51 |
| 2005–2009 | Comp | 64 | 5.9 ± 2.4 | 0.3 | 1.0 ± 0.4 | 2.6 ± 0.9 | 2.7 ± 0.9 | 408/62 |
| 2005–2009, |l| > 105° | Comp | 36 | 7.8 ± 1.7 | 0.3 | 1.3 ± 0.3 | 0.9 < 2.1 | 0.9 < 2.2 | 32/34 |
| kThalo > 0.2 keV | Comp | 52 | 7.5 ± 1.2 | 0.3 | 1.2 ± 0.2 | 1.1 ± 0.8 | 1.1 ± 0.8 | 52/50 |
Number of observations.
Cental electron density and scale height of the disk model, assuming the metal abundance of 1 solar.
Integrated gas mass of the disk component within 30 kpc, assuming the metal abundance of 0.3 solar.
Cental electron density of the spherical model, assuming the metal abundance of 1 solar.
Integrated gas mass of the spherical component within 250 kpc, assuming the metal abundance of 0.3 solar.
This component may be related to the gas heated by supernovae explosions in the stellar disk. Then, the hot gas may relate to star-forming regions, and the emission measures have some scatter. The high EMhalo regions at |l| < 105° may be caused by recent stellar feedback. However, the scale height of the SN-driven hot gas (T > 105.5 K) from a numerical simulation by Hill et al. (2012), about 0.3–0.5 kpc, is significantly lower than the scale height of 2–9 kpc obtained from the absorption line studies.
4.5 Spatial distribution of the Milky Way halo: the spherical component
Galaxies are thought to be surrounded by a gaseous corona, the CGM. The CGM is expected to consist of mostly hot diffuse gas and contain a significant fraction of baryonic mass. This gas is expected to be heated to the virial temperature and fills the MWH in nearly hydrostatic equilibrium. Numerical simulations indicate that the mass of the CGM is around several percent of the total mass and for the Milky Way, where the expected CGM mass is about (3–10) × 1010M⊙ (e.g., Hani et al. 2019; Cautun et al. 2020; Faerman et al. 2022).
4.6 Spatial distribution of the Milky Way halo: the composite model
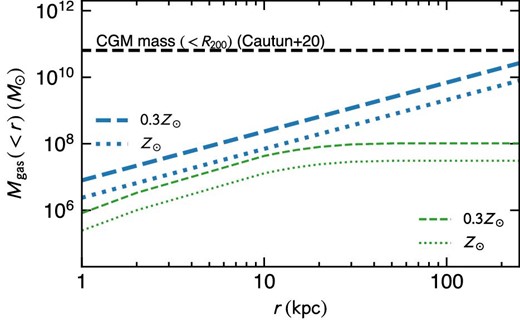
Integrated gas mass (thick: spherical; thin: disk-like) with the best-fitting composite model using the 2005–2009 data. The dashed and dotted lines correspond to the 0.3 solar and 1 solar abundances, respectively. The horizontal dashed line shows the expected CGM mass within R200.
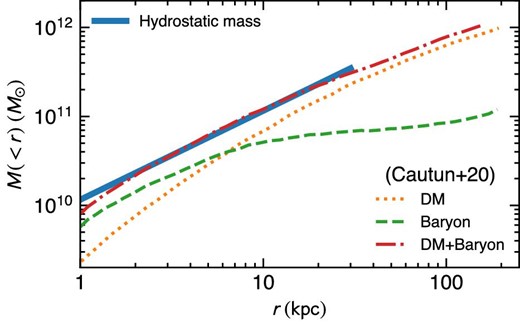
Integrated hydrostatic mass from the spherical component (solid line). The integrated dark matter (dotted), baryon (dashed), and the sum of dark matter and baryon (dot–dashed) obtained by the Gaia observations (Cautun et al. 2020) are also shown.
The accreting gas from outside galaxies is likely in hydrostatic equilibrium, since the expected accretion velocity is low (e.g., Bregman et al. 2018). Our kThalo is fairly uniform at the virial temperature. The smooth distribution of EMhalo toward the Galactic anticenter and the consistency of the hydrostatic mass and gravitational mass indicate that the hot gas with the virial temperature smoothly fills the halo of the Milky Way, possibly in hydrostatic equilibrium as theoretically expected. However, because of the presence of the disk-like morphology component, it is challenging to constrain the contribution of the spherical component.
5 Summary
We analyzed data of 130 Suzaku observations at 75° < l < 285° and |b| > 15° obtained from 2005 to 2015, covering nearly one solar cycle. We exclude time ranges with high count rates to minimize the effect of the geocoronal SWCX. The standard soft X-ray background model consisting of the local hot bubble and the MWH fails to reproduce a significant fraction of the spectra. We include an additional hot CIE component with a temperature of ∼0.8 keV to reproduce spectra of a significant fraction of the lines of sight. Then, the scatter in the relation between EMhalo vs. kThalo is reduced. However, the spectra of almost the same lines of sight, for example, the Lockman Hole data, are inconsistent. We simultaneously fitted the nine Lockman Hole spectra obtained from 2006 to 2014 and found an excess O vii Heα emission after the solar minimum around 2009. Excess O viii Lyα is also detected at the solar maximum. These results indicate that the heliospheric SWCX emission likely contaminates the spectra and causes underestimation of kThalo and overestimation of EMhalo. Adopting the data taken before the end of 2009, at |b| > 35° and |l| > 105°, the temperature (∼0.22 keV) and emission measure (2 × 10⁻³ cm−6 pc) of the MWH are fairly uniform, while at |b| < 35° the emission measure increases toward the lower Galactic latitude. Toward the Galactic anticenter region (|l| > 105°), the 2005–2009 data are well represented with a disk-like morphology model and a composite model consisting of a disk and spherical morphology components. The temperature, 0.22 keV, agrees with the virial temperature of the Milky Way. The hydrostatic mass of the spherical component at a few tens of kpc from the Galactic center agrees with the gravitational mass of the Milky Way. These results indicate that the plasma with the virial temperature fills the Milky Way halo with nearly hydrostatic equilibrium. Integrating the density profile of the spherical component out to 250 kpc, or the virial radius, the upper limit of the gas mass reaches a few ×1010M⊙, assuming 0.3 solar metallicity of the gas. This value is comparable to the lower limit of the expected mass of CGM.
Acknowledgements
We acknowledge all members who contributed to the Suzaku project. We acknowledge support from JSPS/MEXT KAKENHI grant numbers, 16K05300 (KM), 17K05393 (KS), 18H01260 (NY).
Appendix. Observation log
Suzaku observations used are listed in table 4.
Suzaku observation log.
| Sequence* | Target name | l† | b‡ | NH§ | Date‖ | Exposure time (ks) |
|---|---|---|---|---|---|---|
| 100018010 | NEP | 95.74 | 28.67 | 4.0 | 2005/09/02 | 93.8 |
| 100030020 | A2218offset | 97.71 | 40.11 | 2.4 | 2005/10/02 | 43.1 |
| 100046010 | LOCKMANHOLE | 148.97 | 53.13 | 0.6 | 2005/11/14 | 68.1 |
| 101002010 | LOCKMANHOLE | 149.71 | 53.22 | 0.6 | 2006/05/17 | 72.9 |
| 102018010 | LOCKMANHOLE | 149.73 | 53.20 | 0.6 | 2007/05/03 | 88.3 |
| 103009010 | LOCKMANHOLE | 149.71 | 53.22 | 0.6 | 2008/05/18 | 83.4 |
| 104002010 | LOCKMANHOLE | 149.71 | 53.22 | 0.6 | 2009/06/12 | 92.8 |
| 105003010 | LOCKMANHOLE | 149.72 | 53.22 | 0.6 | 2010/06/11 | 71.3 |
| 106001010 | LOCKMANHOLE | 149.73 | 53.21 | 0.6 | 2011/05/04 | 40.3 |
| 107001010 | LOCKMANHOLE | 149.74 | 53.20 | 0.6 | 2012/05/05 | 32.2 |
| 108001010 | LOCKMANHOLE | 149.66 | 53.18 | 0.6 | 2013/11/06 | 36.0 |
| 109014010 | LOCKMANHOLE | 149.66 | 53.17 | 0.6 | 2014/11/30 | 30.2 |
| 402044010 | SW UMA | 164.79 | 36.95 | 4.1 | 2007/11/06 | 16.8 |
| 402046010 | BZ UMA | 159.03 | 38.83 | 4.8 | 2008/03/24 | 25.1 |
| 402089020 | TW HYA | 278.66 | 22.96 | 6.8 | 2007/11/25 | 19.3 |
| 403008010 | AM HERCULES BGD | 77.40 | 20.27 | 6.5 | 2008/11/01 | 40.5 |
| 403039010 | ASAS J002511+1217.2 | 112.94 | −50.08 | 5.7 | 2009/01/10 | 28.9 |
| 404035010 | HD 72779 | 205.49 | 31.34 | 2.9 | 2009/11/06 | 65.2 |
| 405014010 | PSR J0614−33 | 240.49 | −21.83 | 3.9 | 2010/10/29 | 27.6 |
| 405034010 | EG AND | 121.56 | −22.18 | 13.0 | 2011/02/05 | 90.7 |
| 406007010 | 1FGL J2339.7−0531 | 81.33 | −62.46 | 3.2 | 2011/06/29 | 95.2 |
| 407039010 | EUVE J1439+75.0 | 114.11 | 40.15 | 3.3 | 2012/05/20 | 28.3 |
| 407043010 | CH UMA | 142.92 | 42.67 | 4.7 | 2012/05/01 | 45.2 |
| 407045010 | BF ERI | 201.05 | −31.29 | 5.8 | 2013/02/27 | 30.7 |
| 408029010 | V1159 ORI | 206.54 | −19.93 | 27.6 | 2014/03/16 | 192.0 |
| 408030010 | SWIFT J2319.4+2619 | 98.49 | −32.24 | 6.8 | 2013/12/07 | 38.2 |
| 409029010 | 1RXS J032540.0−08144 | 192.85 | −48.96 | 5.9 | 2014/07/31 | 37.3 |
| 409030010 | IW ERIDANI | 216.42 | −40.63 | 2.8 | 2014/08/01 | 39.8 |
| 500026010 | NEP | 95.81 | 28.67 | 4.0 | 2006/02/10 | 80.5 |
| 500027020 | HIGH LAT. DIFFUSE B | 272.41 | −58.26 | 3.3 | 2006/02/17 | 103.6 |
| 501001010 | SKY50.0-62.4 | 278.68 | −47.07 | 2.4 | 2006/03/01 | 79.1 |
| 501002010 | SKY53.3-63.4 | 278.63 | −45.3 | 5.8 | 2006/03/03 | 101.5 |
| 501004010 | DRACO HVC REGION A | 91.22 | 42.39 | 1.8 | 2006/03/20 | 57.3 |
| 501005010 | DRACO HVC REGION B | 90.09 | 42.69 | 1.5 | 2006/03/22 | 57.3 |
| 501101010 | DRACO ENHANCEMENT | 93.99 | 43.97 | 1.1 | 2006/11/09 | 68.7 |
| 501104010 | MBM12 OFF-CLOUD | 157.36 | −36.82 | 9.0 | 2006/02/06 | 72.1 |
| 502047010 | LOWLATITUDE86-21 | 86.00 | −20.77 | 7.9 | 2007/05/09 | 79.6 |
| 502076010 | ERIDANUS HOLE | 213.42 | −39.10 | 2.6 | 2007/07/30 | 95.8 |
| 503104010 | ARCBACKGROUND | 240.49 | −66.01 | 4.1 | 2008/12/30 | 176.4 |
| 504062010 | VICINITY OF NGC 4051 | 150.12 | 70.29 | 1.2 | 2009/12/19 | 84.0 |
| 504069010 | SEP #1 | 276.39 | −29.82 | 5.8 | 2009/11/14 | 51.9 |
| 504070010 | NEP #1 | 96.38 | 29.78 | 4.5 | 2009/11/15 | 52.2 |
| 504071010 | SEP #2 | 276.38 | −29.82 | 5.8 | 2009/12/05 | 58.0 |
| 504072010 | NEP #2 | 96.40 | 29.78 | 4.5 | 2009/12/07 | 43.6 |
| 504073010 | SEP #3 | 276.38 | −29.82 | 5.8 | 2009/12/14 | 44.4 |
| 504074010 | NEP #3 | 96.40 | 29.78 | 4.5 | 2009/12/15 | 45.7 |
| 504075010 | SEP #4 | 276.38 | −29.81 | 5.8 | 2009/12/27 | 49.7 |
| 504076010 | NEP #4 | 96.42 | 29.79 | 4.5 | 2009/12/28 | 49.6 |
| 505044010 | L139B-32 | 138.78 | −32.31 | 6.9 | 2011/01/08 | 78.9 |
| 505058010 | L168B53 | 167.63 | 53.18 | 0.9 | 2010/11/19 | 77.7 |
| 506024010 | 3C 59 VICINITY 1 | 142.15 | −29.91 | 7.2 | 2012/01/14 | 48.9 |
| 506025010 | 3C 59 VICINITY 2 | 141.97 | −31.19 | 6.6 | 2012/01/26 | 156.6 |
| 506056010 | G236+38 OFF | 237.09 | 41.12 | 2.1 | 2011/06/07 | 68.0 |
| 508073010 | MBM16-OFF | 165.84 | −38.39 | 19.0 | 2013/08/09 | 77.4 |
| 509008010 | HOT BLOB 2 | 164.91 | 38.21 | 3.2 | 2015/04/25 | 72.9 |
| 509009010 | HOT BLOB 3 | 167.90 | 36.02 | 5.0 | 2015/04/27 | 75.9 |
| 700011010 | SWIFT J0746.3+2548 | 194.50 | 22.91 | 5.1 | 2005/11/04 | 88.8 |
| 701008010 | IRAS F11223−1244 | 272.53 | 44.75 | 4.8 | 2006/11/25 | 33.5 |
| 701057010 | APM 08279+5255 | 165.73 | 36.24 | 4.7 | 2006/10/12 | 92.4 |
| 701057020 | APM 08279+5255 | 165.73 | 36.23 | 4.7 | 2006/11/01 | 90.9 |
| 701057030 | APM 08279+5255 | 165.78 | 36.24 | 4.7 | 2007/03/24 | 105.8 |
| 702031010 | MRK 1239 | 239.29 | 38.22 | 4.4 | 2007/05/06 | 57.9 |
| 702062010 | Q0450−1310 | 211.76 | −32.06 | 10.3 | 2008/03/10 | 15.3 |
| 702064010 | Q1017+1055 | 230.34 | 50.84 | 3.4 | 2007/11/27 | 17.5 |
| 702076010 | SWIFT J0918.5+0425 | 227.08 | 34.42 | 3.8 | 2007/11/04 | 54.4 |
| 702115010 | IRAS 10565+2448 | 212.31 | 64.73 | 1.1 | 2007/11/06 | 36.6 |
| 703002010 | PKS 0208-512 | 276.08 | −61.77 | 1.9 | 2008/12/14 | 48.7 |
| 703003010 | Q0827+243 | 200.00 | 31.88 | 3.3 | 2008/10/27 | 44.8 |
| 703008010 | SWIFT J0911.2+4533 | 174.69 | 43.11 | 1.3 | 2008/10/25 | 85.9 |
| 703016010 | SWIFT J0134.1-3625 | 261.76 | −77.07 | 2.1 | 2008/05/20 | 34.9 |
| 703036020 | Q0551−3637 | 242.39 | −26.93 | 3.6 | 2008/05/14 | 21.6 |
| 703037010 | Q0109−3518 | 275.54 | −80.97 | 2.0 | 2008/05/20 | 30.0 |
| 703040010 | Q0940−1050 | 246.41 | 30.44 | 4.6 | 2008/05/30 | 29.9 |
| 703042010 | J081618.99+482328.4 | 171.04 | 33.70 | 5.8 | 2009/03/27 | 80.5 |
| 703062010 | NGC 1448 | 251.61 | −51.36 | 1.0 | 2009/02/17 | 45.2 |
| 703065010 | IRAS F01475−0740 | 160.66 | −65.86 | 2.2 | 2008/07/14 | 53.8 |
| 704008010 | 1739+518 | 79.52 | 31.87 | 3.1 | 2009/06/03 | 22.5 |
| 704013010 | 2MASX J02485937+2630 | 153.12 | −29.32 | 15.2 | 2009/07/18 | 37.1 |
| 704014010 | UGC 12741 | 105.64 | −29.87 | 7.9 | 2009/06/07 | 45.7 |
| 704039010 | PKS 0326-288 | 224.92 | −55.38 | 1.0 | 2010/01/30 | 52.2 |
| 704048010 | NGC 3718 | 146.85 | 60.20 | 1.1 | 2009/10/24 | 42.9 |
| 704050010 | SDSS J1352+4239 | 88.09 | 70.11 | 1.0 | 2009/06/02 | 29.5 |
| 704052010 | SDSS J0943+5417 | 161.24 | 46.43 | 1.5 | 2009/05/24 | 32.1 |
| 704053010 | IC 2497 | 190.29 | 48.82 | 1.1 | 2009/04/18 | 74.4 |
| 705001010 | MRK 18 | 155.88 | 39.41 | 5.0 | 2010/05/14 | 35.5 |
| 705003010 | 1150+497 | 145.50 | 64.96 | 2.2 | 2010/11/12 | 99.7 |
| 705012010 | EMS1160 | 120.04 | 27.95 | 8.6 | 2010/04/26 | 20.3 |
| 705023010 | LEDA 84274 | 106.76 | 47.41 | 1.3 | 2010/05/15 | 49.5 |
| 705024010 | IRAS 01250+2832 | 132.53 | −33.41 | 8.2 | 2011/01/10 | 51.2 |
| 705027010 | EMS1341 | 102.86 | 19.43 | 21.0 | 2010/11/27 | 21.3 |
| 705045010 | IRAS 12072−0444 | 283.96 | 56.33 | 3.5 | 2010/12/04 | 56.3 |
| 705046010 | IRAS 00397−1312 | 113.94 | −75.67 | 1.8 | 2010/12/28 | 78.4 |
| 705054010 | NGC 3147 | 136.30 | 39.49 | 3.3 | 2010/05/24 | 132.5 |
| 706004010 | NGC6251LOBEBGD1 | 116.19 | 31.06 | 7.9 | 2011/04/16 | 17.5 |
| 706005010 | NGC6251LOBEBGD2 | 115.83 | 31.62 | 6.0 | 2011/04/16 | 10.9 |
| 706005020 | NGC6251LOBEBGD2 | 115.77 | 31.62 | 6.0 | 2011/08/16 | 11.2 |
| 706013010 | 3C78 | 174.83 | −44.51 | 14.6 | 2011/08/20 | 91.2 |
| 706037010 | MRK 231 | 121.78 | 60.27 | 1.0 | 2011/04/27 | 192.1 |
| 706038010 | IRAS 09104+4109 | 180.98 | 43.54 | 1.5 | 2011/11/18 | 77.4 |
| 707006010 | 3C 236 BACKGROUND | 190.38 | 53.69 | 1.0 | 2012/05/08 | 42.2 |
| 707007010 | 2FGL J0923.5+1508 | 215.99 | 40.48 | 3.2 | 2012/04/29 | 86.0 |
| 707008010 | 2FGL J1502.1+5548 | 92.72 | 52.92 | 1.4 | 2012/05/22 | 60.5 |
| 707009010 | 2FGL J0022.2−1853 | 82.11 | −79.36 | 2.1 | 2012/05/30 | 34.3 |
| 707012010 | NGC 3431 | 266.05 | 37.09 | 4.8 | 2012/06/11 | 54.7 |
| 707021010 | AO 0235+164 | 156.79 | −39.11 | 10.3 | 2013/01/18 | 39.4 |
| 707041010 | 0827+243 | 200.00 | 31.87 | 3.3 | 2012/10/13 | 7.9 |
| 708002010 | NGC 3997 | 218.79 | 77.83 | 7.1 | 2013/05/27 | 80.6 |
| 708004010 | ESO 119−G008 | 266.69 | −38.88 | 1.3 | 2013/04/29 | 97.2 |
| 708023010 | MRK533 | 90.64 | −48.80 | 5.2 | 2013/12/08 | 50.2 |
| 708026010 | NGC 235A | 94.33 | −85.93 | 1.5 | 2013/12/10 | 19.6 |
| 708038010 | IRAS F11119+3257 | 192.25 | 68.36 | 2.2 | 2013/05/13 | 241.3 |
| 708039010 | VII ZW 403 | 127.83 | 37.30 | 3.9 | 2013/12/01 | 81.8 |
| 708043010 | NGC 3660 | 269.08 | 48.37 | 4.0 | 2013/11/28 | 121.8 |
| 708044010 | B2 1023+25 | 207.08 | 57.61 | 1.7 | 2013/05/30 | 93.7 |
| 709003010 | NGC 2655 | 134.95 | 32.71 | 2.4 | 2014/05/12 | 72.2 |
| 709004010 | SWIFT J2248.8+1725 | 85.73 | −36.43 | 7.7 | 2014/12/06 | 73.0 |
| 709007010 | SWIFT J0714.2+3518 | 182.51 | 19.57 | 6.7 | 2015/04/04 | 72.9 |
| 709009010 | ARP 318 | 173.93 | −64.98 | 2.8 | 2014/08/04 | 74.0 |
| 709019010 | Q0142−100 | 161.6 | −68.48 | 3.2 | 2014/07/16 | 56.7 |
| 709020010 | HE0512−3329 | 236.62 | −33.86 | 2.6 | 2014/10/02 | 6.5 |
| 709020020 | HE0512−3329 | 236.62 | −33.86 | 2.6 | 2014/10/03 | 26.5 |
| 709020030 | HE0512−3329 | 236.63 | −33.84 | 2.6 | 2015/02/18 | 24.7 |
| 709021010 | I ZW 18 | 160.55 | 44.86 | 2.7 | 2014/05/15 | 16.5 |
| 709021020 | I ZW 18 | 160.49 | 44.84 | 2.7 | 2014/10/04 | 72.9 |
| 802083010 | COMABKG | 75.61 | 83.17 | 1.0 | 2007/06/21 | 29.8 |
| 803041010 | NGC1961BACKGROUND | 145.24 | 18.80 | 13.1 | 2008/10/09 | 23.1 |
| 808057010 | BULLET-BKG | 266.17 | −20.77 | 6.8 | 2013/05/10 | 48.9 |
| 809052010 | OFF-FIELD1 | 212.28 | 55.01 | 2.1 | 2014/05/05 | 36.6 |
| 901005010 | GRB 070328 | 235.21 | −44.99 | 2.9 | 2007/03/28 | 50.4 |
| 904001010 | GRB 090709A | 91.78 | 20.22 | 8.5 | 2009/07/09 | 58.4 |
Sequence numbers of the Suzaku archive.
Galactic longitude in units of degrees.
Galactic latitude in units of degrees.
Galactic hydrogen column density in units of 1020 cm−2.
Observation start date.
Footnotes
SILSO, World Data Center—Sunspot Number and Long-term Solar Observations, Royal Observatory of Belgium, on-line Sunspot Number catalogue (2005–2015) 〈http://www.sidc.be/SILSO/〉.
