


Abstract
We report results of an analysis of the black hole (BH) candidate source X1755−338 made in 1989, 1990, and 1991 with Ginga, and in 1995 with ASCA. The spectra were well represented by a model consisting of a soft thermal emission from an accretion disk and a hard X-ray tail. The normalization of the multi-color disk, related to the inner disk radius, was similar to each other. The unabsorbed X-ray fluxes from the disk component in the 0.01–10 keV band were estimated to be 1.3 × 10⁻⁹, 3.0 × 10⁻⁹, 9.8 × 10⁻¹⁰, and 2.4 × 10⁻⁹ erg s−1 cm−2 in 1989, 1990, 1991, and 1995, respectively, and are proportional to |$kT_{\rm in}^4$|, where kTin is a temperature at the inner disk radius. Based on the standard accretion disk model for a non-rotating BH, our results suggest either a small BH mass or a large inclination angle. Otherwise, X1755−338 is a rotating BH. The hard X-ray intensity was found to be variable, while the soft X-ray intensity was stable. Although previous work showed the existence of an iron line at 6.7 keV, no clear iron line feature was found in any of the spectra. We infer that most of the iron line flux reported in the previous work was due to contamination of the Galactic diffuse X-ray emission.
1 Introduction
X1755−338 is an X-ray binary source located in the direction of the Galactic bulge, exhibiting an ultrasoft spectrum and a recurrent dip with a period of 4.4 hr (Jones 1977; White & Marshall 1984; White et al. 1984; Mason et al. 1985). The spectrum was well represented by a model consisting of a soft thermal emission and a hard X-ray tail (Pan et al. 1995; Seon et al. 1995), which is well consistent with those commonly found in black hole binaries (BHBs) in the high/soft state (e.g., Tanaka & Lewin 1995). Thus, X1755−338 is classified as a BHB candidate (White & Marshall 1984; White et al. 1984; Tanaka & Lewin 1995). The optical counterpart was identified with a star of V = 18 mag and the distance, D, is thought to be less than 9 kpc (Mason et al. 1985), while Wachter and Smale (1998) indicated that D is larger than 4 kpc. Assuming that X1755−338 is a non-rotating black hole (BH; Schwarzschild BH), Pan et al. (1995) and Seon et al. (1995) pointed out that the derived inner disk radius is small compared with typical BHBs. Pan et al. (1995) argued that if X1755−338 is a BHB accompanied with an accretion disk that has an inner disk radius of 9 km, the inclination angle should be >70°. However, this is inconsistent with the inclination angle of <70° suggested to avoid eclipses by the companion (White et al. 1984).
Seon et al. (1995) reported that an emission line at ∼6.7 keV was detected in 1991. The authors argued that the emission region was close to the central source because the line energy (6.7 keV) is higher than that of the fluorescence line from the cold matter (6.4 keV). It is known that Galactic diffuse X-ray emission (GDXE), unresolved X-ray emission in the Galaxy, has an intense 6.7 keV line from highly ionized iron and is located not only along the Galactic plane and in the Galactic center but also in the Galactic bulge region (Yamauchi & Koyama 1993; Yamauchi et al. 2016). Thus, whether the iron line exists or not should be carefully examined.
Although X1755−338 has been a persistent bright X-ray source since its discovery, it suddenly turned off in 1996 (Roberts & Michelson 1996). During the low state, a filamentary structure around X1755−338 was discovered (Angeline & White 2003). This is thought to be a jet from X1755−338, indicating a BHB. Recently, it was reported that X1755−338 entered an outburst phase (Moreminsky et al. 2020; Draghis et al. 2020).
The nature of X1755−338 has not been well understood. In this paper, we present results of the spectral and timing analyses using data obtained with Ginga and ASCA in 1989–1995, before X1755−338 entered the low state, and discuss the properties.
2 Data analysis and results
2.1 Ginga data
Ginga observations were carried out with the Large Area Counters (LAC). The total effective area and the energy range of the LAC were 4000 cm2 and 1–37 keV, respectively. The FWHM of the LAC field of view (FOV) was about 1° and 2° along and perpendicular to the scan path, respectively. The accuracy of the satellite attitude determination was better than |${0{_{.}^{\circ}}1}$|. Details concerning Ginga and the LAC were given in Makino and The Astro-C team (1987) and Turner et al. (1989), respectively.
We excluded data obtained at the South Atlantic Anomaly, during Earth occultation, at the low elevation angle from the Earth rim of <5°, and in the high background regions at low geomagnetic cut-off rigidity of <9 GV. The non-X-ray background (NXB) was subtracted using a method given by Awaki et al. (1991).
2.1.1 Scanning observations in 1989
The scanning observations in the Galactic bulge region were carried out on 1989 April 7–8. The scan path was along the Galactic plane (|$b\sim -{6{_{.}^{\circ}}2}$|) and the scan speed was 0.95 deg min−1. Data were taken in MPC-1 mode. Scan data with high background counts were excluded. Although multiple scans were carried out around X1755−338 in the l = 355°–0° region, two scan data, in which X1755−338 was clearly detected, were picked up and were added in order to get a high signal-to-noise ratio.
Figure 1 shows the scan profiles in the 1.2–2.9, 2.9–6.4, 6.4–18.5, and 1.2–18.5 keV energy bands. A soft X-ray source was clearly found at the scan angle of ∼ −3°. In order to determine the source position, we applied the same procedure as that described in Yamauchi (2005). We fitted the scan profile with a model consisting of a contribution of point sources and the sky background, the Cosmic X-ray background (CXB) and the GDXE. The sky background was assumed to be constant along the scan path. We applied the scan fitting to the 1.2–18.5 keV energy band data. Since positive residuals were seen at the scan angle of ∼ −4°, we added another point source. As a result, the scan angles of the sources were determined to be |${-2{.}^{\circ}6}\pm {0{_{.}^{\circ}}10}$| and |${-3{.}^{\circ}77}\pm {0{_{.}^{\circ}}22}$|: the former was identified with X1755−338.
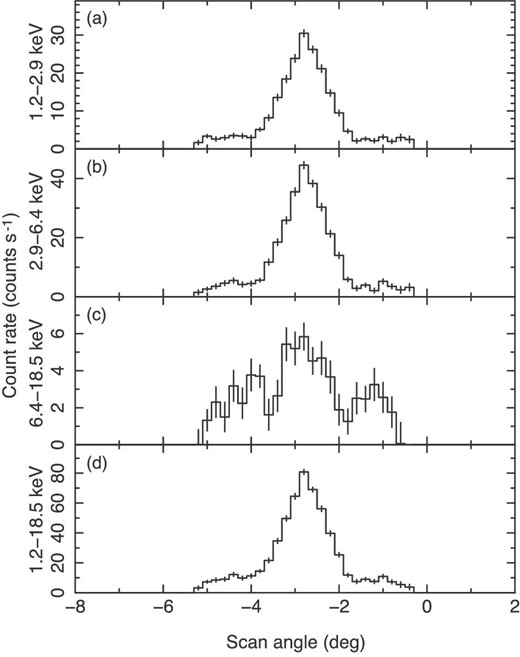
Scan profile obtained with the Ginga LAC in 1989 April. (a) 1.2–2.9 keV, (b) 2.9–6.4 keV, and (c) 6.4–18.5, and (d)1.2–18.5 keV energy bands. The scan angle of 0° refers to |$l = {0{_{.}^{\circ}}0}$|. Errors of the data points are at the 1σ level.
Taking into account the calibration uncertainty of the collimator response function (|$\le\! 3\%$|, Kondo 1988), the intensity variation of point sources during the scanning observation, the contribution of unresolved faint sources on the Galactic plane, and the local structure of the GDXE, the model represented the global profile (χ2/d.o.f. = 22.5/16) and the source positions were determined well.
We next made a scan profile in each energy channel and fitted them with the same model function, fixing the scan angles of the sources and freeing the intensity. Using the peak intensities of X1755−338 derived from the scan fitting, we made the X-ray spectrum. Figure 2a shows the X-ray spectrum obtained in 1989 using this method. Taking into account the elevation angle of X1755−338 from the scan path, we made the aspect correction.
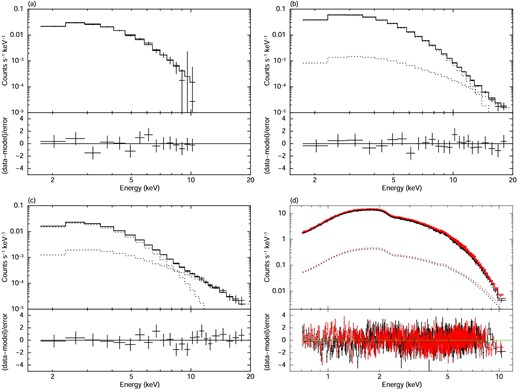
Spectra of X1755−338, (a) 1989 April 7–8 (Ginga), (b) 1990 April 24–25 (Ginga), (c) 1991 September 22–23 (Ginga), and (d) 1995 March 14–15 (ASCA; black: GIS2, red: GIS3). Crosses and histograms in the upper part of each panel are data points and the best-fitting model, respectively. The lower part of each panel shows the residuals from the best-fitting multi-color disk and thermal Comptonized continuum model. Errors of the data points are at the 1σ level. (Color online)
2.1.2 Pointed observations in 1990 and 1991
The pointed observations of X1755−338 were made on 1990 April 24–25 and 1991 September 22–23. Data were taken in MPC-2 and MPC-1 mode in the 1990 and 1991 observations, respectively. The time resolution was 0.5 s (medium bit rate) or 2.0 s (low bit rate) in 1990 and 16 s (low bit rate) in 1991. The data were the same as those used in Seon et al. (1995).
As reported by Seon et al. (1995), the dip feature was seen in the 1990 and 1991 observations. Here, we made spectra only in the non-dip period. In order to obtain a high signal-to-noise ratio, we made a spectrum from the data with a collimator transmission of |$>\!90\%$| in the 1990 observation. The satellite attitude during the pointed observation in 1991 was unstable, and hence we picked up the data with a collimator transmission of |$>\!80\%$|. The averaged pointed positions were |$(l,\:b) = ({357{_{.}^{\circ}}3},\: {-4{.}^{\circ}9})$| and |$(l,\:b) = ({357{_{.}^{\circ}}4},\:{-4{.}^{\circ}7})$| in the 1990 and 1991 observations, respectively, while the exposure times are 9.3 ks and 6.4 ks, respectively.
The sky background data were taken at the pointed position of |$(l,\: b) = ({358{_{.}^{\circ}}7},\: {-4{.}^{\circ}3})$|, close to X1755−338, in 1990 April 24 and the NXB was subtracted from the data. Figures 2b and 2c show X-ray spectra after the NXB and sky-background subtraction obtained in the 1990 and 1991 observations, respectively. Using the averaged satellite attitude, we made the aspect correction.
In order to examine timing property, we made light curves. After the subtraction of the NXB and the sky background, the aspect correction was made.
2.2 ASCA data
The field centered on |$(l,\:b) = ({357{_{.}^{\circ}}282},\:{-4{.}^{\circ}896})$| was observed on 1995 March 14–15 with the two solid-state imaging spectrometers (SIS0, SIS1) and the two gas-imaging spectrometers (GIS2, GIS3) placed at the focal plane of the thin foil X-ray Telescope (XRT) onboard ASCA. Details of ASCA and the instruments are given in separate papers (ASCA satellite: Tanaka et al. 1994; XRT: Serlemitsos et al. 1995; SIS: Burke et al. 1991; GIS: Makishima et al. 1996; Ohashi et al. 1996). Since X1755−338 was bright, pile-up phenomena and telemetry overflow occurred. To avoid these data, we used only the GIS data with a high bit rate.
The GIS was operated in PH (pulse height) mode and 64 pixel mode. The FOV was ∼50′ in diameter. We excluded the data obtained at the South Atlantic Anomaly, during the Earth occultation, at the low elevation angle from the Earth rim of <5°, and in the high background regions at low geomagnetic cut-off rigidities of <6 GV. We also applied a rise-time discrimination technique to reject particle events. After the selection, the exposure time is 19.6 ks. The source spectrum was extracted from a circle with a radius of ∼4′, while the background spectrum was accumulated from the outer region in the same FOV. Figure 2d shows the X-ray spectrum after the background subtraction.
In order to examine the timing property, we made light curves. After the subtraction of the NXB and the sky background, the data obtained with GIS2 and GIS3 were added.
2.3 Spectrum
The best-fitting photon index was in the range of 2.4–2.6, but was not well constrained, and hence the photon index was fixed at 2.5. The best-fitting parameters are listed in table 1.
Best-fitting parameters of spectral analysis for the non-dip period.
| Component | Parameter | Value* | |||
|---|---|---|---|---|---|
| Ginga 1989 | Ginga 1990 | Ginga 1991 | ASCA 1995 | ||
| Model 1: (multi-color disk+power-law) × absorption | |||||
| phabs | NH (× 1021 cm−2) | <3.1 | 5.6 ± 0.6 | 3.8 ± 1.0 | 3.6|$^{+0.1}_{-0.2}$| |
| diskbb | kTin† (keV) | 1.09|$^{+0.04}_{-0.07}$| | 1.24|$^{+0.02}_{-0.01}$| | 0.99 ± 0.02 | 1.19 ± 0.01 |
| (rin|$/$|d10)2 cos θ‡ | 42|$^{+14}_{-7}$| | 57 ± 4 | 46 ± 5 | 55 ± 2 | |
| Power law | Γ | 2.5 (fixed) | 2.5 (fixed) | 2.5 (fixed) | 2.5 (fixed) |
| Normalization§ | <0.09 | 0.065 ± 0.07 | 0.068|$^{+0.006}_{-0.005}$| | 0.064|$^{+0.012}_{-0.014}$| | |
| χ2/d.o.f. | 8.3/11 | 14/22 | 16/22 | 1147/1068 | |
| Model 2: (multi-color disk+thermal Comptonized continuum) × absorption | |||||
| phabs | NH (× 1021 cm−2) | <2.4 | 5.0 ± 0.6 | 2.6 ± 1.1 | 3.2 ± 0.1 |
| diskbb | kTin† (keV) | 1.10|$^{+0.03}_{-0.09}$| | 1.24 ± 0.01 | 0.98 ± 0.02 | 1.18 ± 0.01 |
| (rin|$/$|d10)2 cos θ‡ | 42|$^{+16}_{-7}$| | 58 ± 4 | 48 ± 6 | 58 ± 2 | |
| Flux♯ (× 10−9 erg s−1 cm−2) | 1.3 | 3.0 | 0.98 | 2.4 | |
| nthcomp | kT0 (keV) | Link to kTin | Link to kTin | Link to kTin | Link to kTin |
| Γ | 2.5 (fixed) | 2.5 (fixed) | 2.5 (fixed) | 2.5 (fixed) | |
| kTe (keV) | 100 (fixed) | 100 (fixed) | 100 (fixed) | 100 (fixed) | |
| Normalization | <0.02 | 0.009 ± 0.002 | 0.013 ± 0.002 | 0.012 ± 0.003 | |
| Flux♯ (× 10−10 erg s−1 cm−2) | <1.5 | 0.87 | 1.1 | 1.1 | |
| χ2/d.o.f. | 8.4/11 | 14/22 | 17/22 | 1151/1068 | |
The quoted errors are in the |$90\%$| confidence limits.
Temperature at an inner-disk radius of the accretion disk (rin).
d10 is the distance to the source in unit of 10 kpc and θ is an inclination angle.
The unit is photons s−1 cm−2 keV−1 arcmin−2 at 1 keV.
Unabsorbed flux in the 0.01–10 keV band.
The temperature of seed photons was linked to the temperature at the inner-disk radius, kTin, while the electron temperature and asymptotic power-law photon index were assumed to be 100 keV and 2.5, respectively. This model also gave acceptable fits. The best-fitting parameters and the observed X-ray flux for each component are listed in table 1, while the best-fitting models are plotted in figure 2. Figure 3 is a correlation plot between kTin and the unabsorbed energy flux of the disk component, which clearly shows that the flux of the disk component is proportional to |$kT_{\rm in}^4$|.
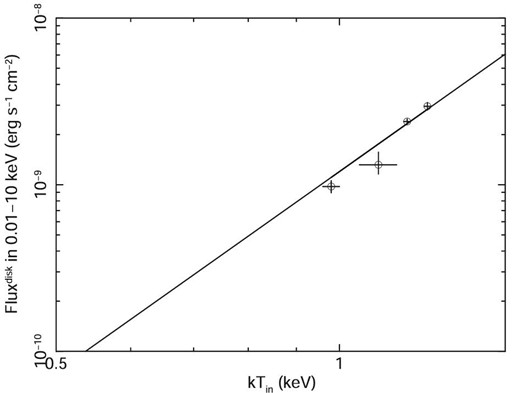
Correlation plot between temperature at the inner disk radius and an unabsorbed energy flux of the disk component in the 0.01–10 keV band. The solid line shows the |$\mbox{Flux}\propto kT_{\rm in}^4$| relation. Errors of the data points are at the 1σ level.
We also examined the electron temperature of 40 keV, but the parameters of the multi-color disk model were the same within the statistical errors.
2.4 Iron line feature
Seon et al. (1995) reported that an emission line at ∼6.7 keV was detected in the 1991 observation: the iron line flux derived from the multi-color disk + Comptonized blackbody + Gaussian model was |$(2.05^{+0.74}_{-0.71}) \times 10^{-4}\:$|photons s−1 cm−2. However, in our spectra, no clear line feature is seen (see figure 2). We re-fitted the spectrum with model 2, adding a Gaussian line at 6.7 keV, and obtained upper limits of the line flux (|$90\%$| confidence level) of 1.0 × 10⁻³, 1.6 × 10⁻⁴, 1.7 × 10⁻⁴, and 2.5 × 10⁻⁴ photons s−1 cm−2 in 1989, 1990, 1991, and 1995, respectively.
We infer that the iron line flux previously reported in Seon et al. (1995) was mainly due to contamination of the GDXE. Although Seon et al. (1995) stated that the sky background data obtained seven days after the observation in 1991 were used (the position of the sky background was not shown), no data with the position close to X1755−338 were found in 1991 September–October in the Ginga observation logs. The GDXE in the Galactic bulge region also has an intense 6.7 keV line from highly ionized iron (Yamauchi & Koyama 1993; Yamauchi et al. 2016). If the position of the sky background data was not close to X1755−338, the GDXE contamination is not negligible.
The iron line flux in the nearby sky, from which the sky background for this analysis was extracted, was determined to be (1.4 ± 0.5) × 10−4 photons s−1 cm−2, which is well consistent with those in Yamauchi and Koyama (1993). Furthermore, the Suzaku results show that the flux of the iron emission line around |$(l,\:b) \sim ({0{^\circ }},\:{-5{^\circ }})$| is (1–2) × 10−8 photons s−1 cm−2 arcmin−2 (Yamauchi et al. 2016), which corresponds to ∼(0.7–1.4) × 10−4 photons s−1 cm−2 in the Ginga LAC FOV. Thus, the iron line flux of the GDXE is comparable to that reported in Seon et al. (1995).
2.5 Timing property
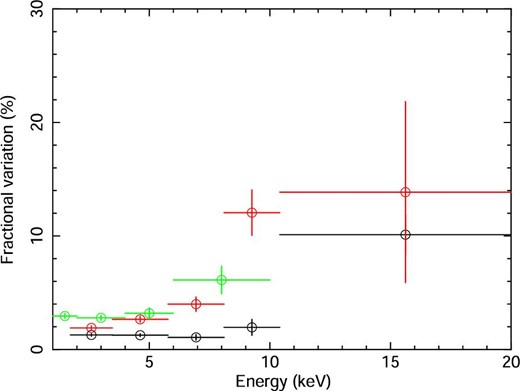
Fractional variation as a function of the photon energy. The black, red, and green colors show the Ginga data in 1990 and 1991, and the ASCA data in 1995, respectively. The time-bin-width is 64 s. Errors of the data points are at the 1σ level. (Color online)
3 Discussion and conclusion
X-ray spectra observed with Ginga and ASCA in 1989–1995 were well represented by a soft thermal emission from the accretion disk and a hard tail component. The temperature of the inner disk radius kTin is ∼1 keV, which is very similar to those of BHBs (e.g., Tanaka & Lewin 1995). Furthermore, kTin is consistent with those of the previous works (Pan et al. 1995; Seon et al. 1995). Figure 3 shows that the flux of the disk component is proportional to |$kT_{\rm in}^4$|, which is in agreement with that of the standard disk model of BHBs in the high/soft state (e.g., Makishima et al. 2000; Kubota et al. 2001). The results in Pan et al. (1995) also show the same tendency. In addition, the intensity variation shows that the harder X-ray photons are variable (figure 4), which suggests that X-rays from an accretion disk are stable and those from a hard X-ray tail are variable (see also figure 2). This is also similar to those found in BHBs (e.g., Ebisawa 1991). Thus, X1755−338 is most likely to be a BHB.
The luminosity of the disk component, Ldisk, is estimated to be Ldisk = (1.3–4.2) × 1037(D/9 kpc)2(cos i/cos 70°)−1. This corresponds to ∼0.03–0.1(cos i/cos 70°)−1LEdd at a distance of 9 kpc or ∼0.006–0.02(cos i/cos 70°)−1LEdd at a distance of 4 kpc by assuming a 3 M⊙ BH, where LEdd is the Eddington luminosity. The spectral and timing properties are similar to those of BHBs in the high/soft state, and the spectrum in 1991 (the lowest luminosity case) seems to be that in the critical luminosity level for the high to low state. Adopting the critical luminosity of L/LEdd = 0.01–0.04 (e.g., Maccarone 2003), it supports the idea that X1755−338 is a low-mass BH at a long distance.
If X1755−338 is a BHB with MBH ≥ 3 M⊙, an inclination angle of <70°, and at a distance of 4–9 kpc, another possible scenario is that X1755−338 is a rotating BH (a Kerr BH) because the last stable orbit around the rotating BH is thought to be smaller than the Schwarzschild radius (e.g., McClintock & Remillard 2006). In fact, we fitted the spectra with a model consisting of an emission from the accretion disk for the Kerr BH (kerrbb in XSPEC, Li et al. 2005) and a thermal Comptonized continuum (nthcomp) assuming MBH = 3 M⊙, κ = 1.7, a temperature of seed photon of 1 keV , and an electron temperature of the nthcomp model of 100 keV. Consequently, we found that the model can represent the spectra with the specific angular momentum, a (−1 ≤ a < 1), of 0.55–0.84 for an inclination angle of 70°–60° at the distance of 9 kpc, and a = 0.93–0.99 for 70°–60° at 4 kpc, respectively.
Acknowledgements
We thank Prof. Ken Ebisawa for helpful comments. This research has made use of the DARTS system provided by ISAS/JAXA.
