


Abstract
Collisions and interactions between gas-rich galaxies are thought to be pivotal stages in their formation and evolution, causing the rapid production of new stars, and possibly serving as a mechanism for fueling supermassive black holes (BHs). Harnessing the exquisite spatial resolution (∼0|${^{\prime\prime}_{.}}$|5) afforded by the first ∼170 deg2 of the Hyper Suprime-Cam (HSC) survey, we present our new constraints on the importance of galaxy–galaxy major mergers (1 : 4) in growing BHs throughout the last ∼8 Gyr. Utilizing mid-infrared observations in the WISE all-sky survey, we robustly select active galactic nuclei (AGN) and mass-matched control galaxy samples, totaling ∼140000 spectroscopically confirmed systems at i < 22 mag. We identify galaxy interaction signatures using a novel machine-learning random forest decision tree technique allowing us to select statistically significant samples of major mergers, minor mergers / irregular systems, and non-interacting galaxies. We use these samples to show that galaxies undergoing mergers are a factor of ∼2–7 more likely to contain luminous obscured AGN than non-interacting galaxies, and this is independent of both stellar mass and redshift to z < 0.9. Furthermore, based on our comparison of AGN fractions in mass-matched samples, we determine that the most luminous AGN population (LAGN ≳ 1045 erg s−1) systematically reside in merging systems over non-interacting galaxies. Our findings show that galaxy–galaxy interactions do, on average, trigger luminous AGN activity substantially more often than in secularly evolving non-interacting galaxies, and we further suggest that the BH growth rate may be closely tied to the dynamical time of the merger system.
1 Introduction
The connections between galaxy–galaxy interactions and the triggering and/or presence of accreting supermassive black holes (hereafter, active galactic nuclei; AGN) are a matter of significant ongoing debate. In the broad scope of galaxy evolution, there are many compelling theoretical reasons to expect a connection between the encounters of two (or more) gas-rich galaxies with similar (1 : <4–5) stellar masses, and the accretion of material onto at least one of the black holes (BHs) present in these systems (e.g., Volonteri et al. 2003; Hopkins et al. 2005; Di Matteo et al. 2005; Springel et al. 2005). Concurrent BH growth and the rapid production of new stars (e.g., Somerville et al. 2008; Anglés-Alcázar et al. 2013) can naturally give rise to known correlations between the BH mass and galaxy properties, such as the bulge mass and stellar velocity dispersion (e.g., Magorrian et al. 1998; Ferrarese & Merritt 2000; Tremaine et al. 2002; Gültekin et al. 2009; McConnell & Ma 2013). Furthermore, self-regulation of the AGN activity, due to so-called “quasar mode” feedback processes, can serve as a violent mechanism capable of disrupting the ongoing star formation by depositing energy back into the galaxy merger, heating the gas and/or even expelling material out into the wider dark matter halo. Indeed, AGN feedback is a widely accepted solution for the formation of massive quiescent early-type galaxies, and the build-up of the red sequence, in cosmological simulations.
A particularly persuasive argument for a connection between the most rapidly growing BHs and major mergers is that galaxy interactions provide a simple solution to the “angular momentum problem.” In principle, growing a BH requires only a source of cool gas to fuel the nucleus, supplies of which are typically plentiful in the host galaxy. However, continuously transporting significant quantities of this material from the gas reservoirs in the host down to scales in which it can accrete onto the BH, while simultaneously dissipating the specific angular momentum of the gas, is a non-trivial issue. Models of galaxy–galaxy mergers show that tidal forces between the galaxies can cause gas to be subject to substantial gravitational torques, resulting in the efficient loss of angular momentum, ultimately causing substantial gas flow towards the BH, and igniting a powerful AGN (e.g., Barnes & Hernquist 1991; Mihos & Hernquist 1996; Di Matteo et al. 2008; Anglés-Alcázar et al. 2017). Despite the theoretical successes of AGN–galaxy co-evolution models, observational evidence for a connection between merging galaxies, galaxy instabilities, and the enhanced presence of AGN activity is still inconclusive.
Recent observations of luminous (LAGN > 1046 erg s−1) dust-reddened z ∼ 1–2 quasars have revealed these AGN to
be overwhelmingly hosted by galaxy mergers (e.g., Urrutia et al. 2008; Glikman et al. 2012, 2015), possibly suggesting that the most luminous BH growth is increasingly likely to be triggered by galaxy interactions (e.g., Treister et al. 2012; Fan et al. 2016). However, others do not observe a rise in the incidence of mergers at the highest AGN luminosities (e.g., Schawinski et al. 2012; Villforth et al. 2014). Furthermore, at similar redshifts, AGN with more moderate luminosities (LAGN ∼ 1043–1044 erg s−1) also appear no more likely to show interaction signatures than non-AGN systems (e.g., Cisternas et al. 2011; Schawinski et al. 2011; Kocevski et al. 2012). Similarly, at z < 1, large-scale galaxy interaction signatures such as mergers, and galaxy-scale bars and instabilities, do not appear to significantly boost the likelihood of hosting a lower-luminosity AGN (LAGN ≲ 1043 erg s−1; Athanassoula 1992; Ho et al. 1997; Regan & Mulchaey 1999; Cisternas et al. 2015; Cheung et al. 2015; Goulding et al. 2017). By contrast, others find evidence supporting a correlation between merging and AGN in some more nearby galaxies (e.g., Koss et al. 2010; Silverman et al. 2011; Ellison et al. 2011b, 2013; Satyapal et al. 2014a; Hong et al. 2015; Weston et al. 2017).
Typically, studies have focused on selecting large samples of AGN, and then comparing the host galaxies of these AGN to non-AGN systems. However, AGN activity is a stochastic process that is believed to vary on timescales far shorter than changes related to galaxy-wide processes (e.g., morphology, star formation). Active galactic nuclei variability may therefore cause dilution of would-be significant correlations between average BH accretion and ongoing star formation (e.g., Chen et al. 2013; Hickox et al. 2014) and/or stellar mass (Yang et al. 2017). Further complicating the observational viewpoint, the importance of galaxy interactions for triggering AGN may also be obscuration dependent, as well as merger-stage dependent (e.g., Kocevski et al. 2015; Koss et al. 2016; Weston et al. 2017; Ricci et al. 2017). More often than not, these previous investigations were hampered by the ability to sample significant numbers of AGN and mergers that cover large dynamic ranges in AGN luminosity, and for the more high-redshift studies, the ability to accurately identify AGN or robustly detect the presence of galaxy interaction signatures. Progress in the field can therefore be made by bridging the gap between the low- and high-redshift studies, through the construction of large samples of merging and non-merging galaxies with deep high-resolution imaging to z ∼ 1, which simultaneously encompass statistically significant populations of moderate to extremely luminous AGN.
Using dedicated telescopes, wide-format surveys such as the Sloan Digital Sky Survey (SDSS) carried out comprehensive multi-band imaging surveys of significant fractions of the sky. These surveys have been incredibly successful in characterizing the properties of extremely large galaxy/AGN samples (e.g., Strateva et al. 2001; Vanden Berk et al. 2001; Strauss et al. 2002; Eisenstein et al. 2005; Ross et al. 2013). Owing to mirror size and total integration times these surveys were necessarily limited to the relatively nearby Universe (z < 0.2), while still encompassing large survey volumes of V ∼ 0.2 (h−1 Gpc)3. Following in the footsteps of SDSS, the next generation of wide-format imaging surveys, capable of providing SDSS-like volumes and imaging quality out to z = 1, are beginning to take shape. The ongoing Hyper Suprime-Cam (HSC) survey (Aihara et al. 2018a) is now providing an unprecedented new view of the Universe. The combination of the wide field of view and large 8.2 m mirror diameter provided by the Subaru Telescope gives the HSC survey exquisite sensitivity and resolving power. Upon completion, the Wide survey layer of HSC will image ∼1400 deg2 in grizy to a depth of i ∼ 26 mag and with a typical i-band seeing of ∼ 0|${^{\prime\prime}_{.}}$|5, less than half that of the median seeing in SDSS ( ∼ 1|${^{\prime\prime}_{.}}$|4). Given that the angular diameter increases by only a factor of ∼2.5 from z = 0.2 to z = 1, HSC is now allowing the exploration of galaxy morphologies with SDSS-like precision in SDSS-like survey volumes out to z ∼ 1.
Here we harness the unprecedented sensitivity of the first 170 deg2 of the HSC survey combined with complementary all-sky data available from Wide-field Infrared Survey Explorer (WISE: Wright et al. 2010) to explore the incidence of mid-infrared (mid-IR; λ ∼ 3–100 μm) identified AGN in merging galaxies out to z ∼ 0.9 as a function of the AGN host galaxy properties. In section 2 we define our spectroscopic sample of massive galaxies that have been observed as part of the HSC survey. In section 3, we outline the modeling of the spectral energy distributions for the sample to determine their rest-frame photometry and intrinsic properties, in order to match our galaxy sample in color and stellar mass, and we utilize the ALLWISE catalog to identify those galaxies containing luminous AGN. In section 4, we describe our novel implementation of a machine-learning algorithm to identify interacting and non-interacting galaxies by harnessing the HSC imaging. In section 5 we present the incidence of AGN in interacting and non-interacting galaxies, finding that AGN are, on average, at least a factor ≳ 3 more abundant in merging systems, and the most luminous AGN at fixed stellar mass are preferentially found in merging galaxies. In section 6 we discuss the implication of our results, and outline a framework linking the observed AGN fractions to the dynamical time of the merger system. Our concluding remarks are presented in section 7. All magnitudes are in the AB system, unless otherwise stated. Throughout we assume a standard flat ΛCDM cosmology with H0 = 70 km s−1 Mpc−1 and ΩM = 0.3.
2 Sample selection in the HSC survey
2.1 The Hyper Suprime-Cam survey
The Hyper Suprime-Cam (HSC) survey is an ambitious 300 night imaging survey undertaken as part of the Subaru Strategic Program (SSP: Aihara et al. 2018a). The HSC survey is designed to provide nested wide-field multi-band imaging over a total of ∼1400 deg2 using the HSC instrument on the Subaru 8.2 m telescope on Mauna Kea in Hawai’i. The Hyper Suprime-Cam is constructed of 116 (104 science detectors) Hamamatsu Deep Depletion 2 K × 4 K CCDs, with a 1.77 deg2 field of view (FOV) and has an instrumental point-spread function (PSF) of D80 < 0|${^{\prime\prime}_{.}}$|2 (80% enclosed light fraction) over the entire FOV across all imaging filters.
The HSC survey consists of three survey layers: the Wide layer covers a solid angle of 1400 deg2 in grizy filters to a depth of r ≈ 26 mag (5 σ, point source). The 27 deg2 Deep layer reaches r ≈ 27 mag, with the addition of three narrow-band filters at λ ∼ 3870, 8160, and 9210 Å, and the 3.5 deg2 Ultradeep layer is a further ∼1 mag fainter than Deep, allowing detection of Lyα emitters to z ≈ 7. In addition, the HSC survey fields were carefully constructed to overlap with existing multi-wavelength survey fields, e.g., millimeter data from the Atacama Cosmology Telescope (ACT); X-ray data from multiple XMM-Newton and Chandra; near-/mid-infrared imaging surveys such as VIKING/VIDEO; UKIDSS; Spitzer and WISE; and optical spectroscopic surveys such as SDSS Legacy/BOSS, PRIMUS (Coil et al. 2011), VIPERS (Guzzo et al. 2014), GAMA (Liske et al. 2015), Wiggle-Z (Drinkwater et al. 2010), COSMOS (Lilly et al. 2009), and DEEP2 (Newman et al. 2013). For the specific region centers of the three layers that make up the HSC-SSP survey, we refer the reader to Aihara et al. (2018a).
The data used throughout this manuscript is based on an internal release of the Wide layer data, release S16A, and covers ∼170 deg2. Basic data processing, including bias and background subtraction, flat-fielding, astrometric calibration, individual exposure co-addition, and object detection was performed using hscPipe v4.0.1, which is an HSC-specific derivative of the Large Synoptic Survey Telescope (LSST) processing pipeline. For further details regarding hscPipe and the HSC-SSP data releases, see Bosch et al. (2018) and Aihara et al. (2018b). For our analyses we use the source catalogs, images, and other relevant data derived from the co-added HSC images produced by hscPipe. The image co-adds are shifted to a common World Coordinate System (WCS), and have a pixel scale of 0|${^{\prime\prime}_{.}}$|168.
2.2 Outline of this manuscript
Our primary goal is to constrain the effects of gas-rich merging of galaxies on the growth of BHs out to z ≲ 1. To achieve this we require:
Deep, high-spatial-resolution optical imaging (from HSC) of a large parent sample of galaxies spectroscopically confirmed to be in the redshift range 0.1 < z < 0.9, from which we can robustly identify large subsamples of interacting and non-interacting galaxies. See subsection 2.3.
The intrinsic properties of the parent galaxy sample, such as rest-frame colors, stellar masses, star-formation rates, derived using SED fitting (see subsection 3.1). These measurements allow us to perform property-matched tests between different interaction-state systems, such as stellar mass matching, and rest-frame color matching, using diagnostics such as the UVJ diagram (see subsection 3.2).
A homogeneous obscuration-independent selection of AGN within our parent sample. We achieve this through the use of mid-infrared color diagnostics performed on photometry obtained from the WISE all-sky survey. See subsection 3.3.
An accurate automated method for classifying signatures of recent/ongoing merger events. We achieve this through a novel implementation of a random forest machine-learning algorithm, trained on a large sample of visually identified mergers and non-mergers within the HSC i-band imaging. See subsection 4.2.
In section 5, we present the results of our investigation, and show conclusive statistical evidence that BHs hosted by merging galaxies are at least three times more likely to be rapidly growing at high Eddington ratios than a mass-matched sample of non-interacting galaxies. This suggests not only that AGN are triggered by merging, but also that the rapid growth of the BH(s) can be sustained during the merger event.
2.3 Selecting bright (i < 22 mag) galaxies in HSC
In this section we describe our selection techniques in order to construct samples of interacting and non-interacting galaxies with firm spectroscopic redshifts. In section 5, we use these galaxy samples to assess the importance of galaxy interactions on the growth of BHs to z < 1. Our parent galaxy sample contains all objects with i < 22.3 Kron magnitudes in the S16A data release of the HSC survey. We set the detect_is_tract_inner, detect_is_patch_inner, detect_is_primary, and is_extended data flags on the sample, as we require the most complete galaxy sample available within the HSC database.1 Our choice of flux limit derives from our ability to (1) recover the source morphologies and robustly identify interacting galaxy features such as disturbances, irregular morphologies, tidal tails, and bridges out to z < 0.9 (a detailed analysis of the HSC galaxy morphologies and comparison to Hubble Space Telescope data will be presented in a future publication: A. D. Goulding et al. in preparation), (2) the completeness of spectroscopic catalogs within the survey regions, and (3) the addition of a systematic uncertainty of ±0.3 mag due to difficulty in measuring the photometry of merging systems.
Each source extracted from the HSC database is then cross-matched to within <1″ with the publicly available spectroscopic redshift (spec-z) catalogs pertaining to the survey sky regions. The median separation between the HSC and the spec-z position is ∼ 0|${^{\prime\prime}_{.}}$|13. Specifically, we harness spec-z measurements from the SDSS Legacy Catalog (complete to r < 17.77), the SDSS-DR12 BOSS survey (color-selected galaxies, and approximately stellar mass limited; see Dawson et al. 2013; Maraston et al. 2013; Reid et al. 2016; Leauthaud et al. 2016), the GAMA-DR2 survey (complete to r < 19.0), the PRIMUS survey (complete to i < 22.5: Coil et al. 2011), the WiggleZ Dark Energy survey (20.0 < r < 22.5: Drinkwater et al. 2009) and the first data release of the VIMOS Public Extragalactic Redshift Survey (VIPERs: i < 22.5; Garilli et al. 2014; Guzzo et al. 2014).
Our requirement of a detected i < 22.3 mag source in HSC-S16A WIDE, as well as a publicly available spectroscopic redshift (within at least one of the aforementioned surveys), and HSC imaging with a well characterized PSF, results in a combined area of ∼170 deg2, and a galaxy catalog containing 140158 unique galaxies at 0.1 < z < 0.9. Similar to our brightness limit, the imposed redshift limits are based on the bright photometry limit for HSC (see Bosch et al. 2018), the targeted completeness limits for the spectroscopic redshift surveys, and our ability to accurately determine the morphological classifications, and identify low-surface brightness tidal tails of the systems from the WIDE-depth (i < 25.9 mag) HSC imaging at higher redshifts.
In figure 1 we present the breakdown of the spectroscopic redshift distributions for our parent sample as a function of the redshift survey from which the spec-z originated, and as a function of the source brightness in the i band. It is clear that at any given redshift our total sample is dominated by 2–3 of the redshift surveys. For example, at lower redshifts (z < 0.3), our sample is mainly composed of objects selected from the SDSS-Legacy and GAMA surveys, while at redshifts 0.4 < z < 0.6, the sample is driven by SDSS-BOSS systems, with roughly equal subdominant contributions from VIPERs and PRIMUS galaxies.2 While our sample is by selection heterogeneous, and contains a range of selection functions for the different surveys, we will demonstrate directly in subsection 5.2 that our results are not sensitive to the details of the different samples.
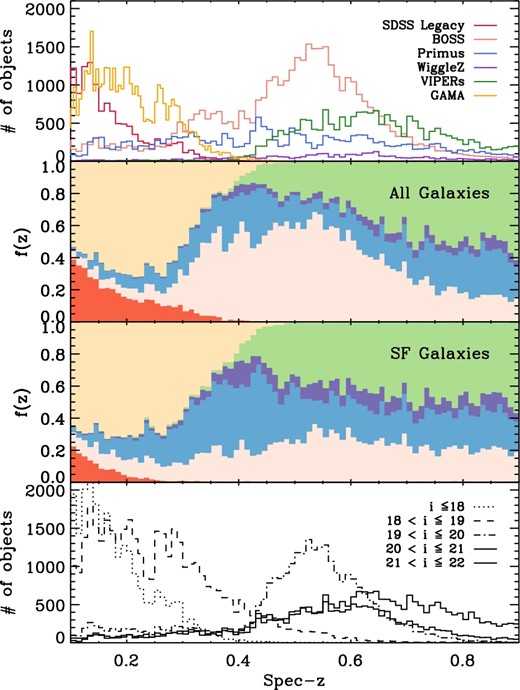
Top: Distribution of spectroscopically identified galaxies in our parent sample as a function of spectroscopic survey (SDSS-II Legacy, SDSS-III BOSS, PRIMUS, VIPERs, GAMA, and Wiggle-Z). Middle: Fractional contribution of a given spectroscopic survey to our parent galaxy sample as a function of redshift for all galaxies within our parent sample, and for the star-forming galaxy sample after applying the UVJ cut shown in figure 3. Bottom: Spectroscopic sample as a function of i-band magnitude. (Color online)
3 Sample properties
3.1 SED modeling using FAST
In this section, we use a suite of available photometry in conjunction with the spectroscopic redshifts to derive the UV to IR spectral energy distributions (SEDs) for the galaxies in our spec-z sample, defined in subsection 2.3. We use SED modeling to derive physical properties such as the stellar mass (M*), star-formation rate (SFR), and dust extinction (AV). We use these derived measurements in section 5 to produce M*-matched samples of interacting and non-interacting galaxies.
In order to accurately constrain the galaxy light blueward of the 4000 Å break, for objects in our lowest redshift bin z < 0.3, we require u-band photometric measurements. For this purpose we choose to harness the available Petrosian magnitude ugriz photometry from the 12th data release (DR12) of the SDSS survey, which is complete to r ≲ 22.4 mag. All of the galaxies in our main spec-z galaxy sample are detected in at least the g, r, and i bands in SDSS-DR12. At faint magnitudes (iSDSS, Petro > 20.5), the uncertainties in the SDSS photometry become large, due to the sensitivity limit of the SDSS observations. Given the depth of the HSC data, the inclusion of HSC photometry will serve to increase the precision of our SED modeling for faint systems. Hence, for sources with iSDSS, Petro > 20.5 magnitudes, we supplement the observed-frame optical data with HSC grizy Kron-magnitude photometry.
Typically, extended sources with i ≳ 20.5 mag have HSC i-band photometry that is consistent (±0.05 mag) with the photometry from SDSS. However, some sources with iSDSS, Petro > 20.5 mag still have significantly discrepant photometric measurements between SDSS and HSC (|iHSC, kron − iSDSS, Petro| > 0.15 mag). Such a difference between the SDSS and HSC photometry is well beyond the typical statistical uncertainty quoted for the photometry in either survey (σSDSS ∼ 0.09; σHSC ∼ 0.04), and points towards a photometric measurement issue for a given object in the HSC pipeline.3 Hence, we choose not to include the additional HSC photometry for these objects. We note that the exclusion of the HSC photometry for some objects does not significantly affect our SED fitting procedure or its derived measurements, as we show in figure 2.
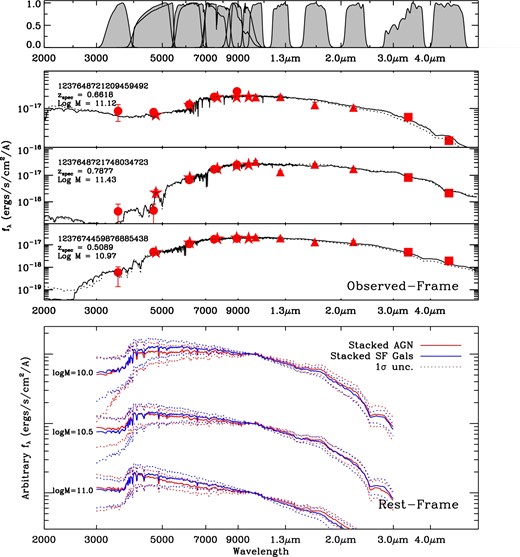
Examples of FAST-produced SED fits while harnessing available photometry: SDSS (ugriz: filled circles), HSC (grizy: filled stars), UKIDSS LAS (YJHK: filled triangles), and WISE (W1W2: filled squares); and spectral redshifts. SED fits are shown with (solid line) and without (dashed line) the inclusion of the HSC grizy photometry. The top panel provides the normalized filter response used throughout our analysis. The lower panel provides the stacked rest-frame SEDs (solid lines) and the 1 σ spread in the SED models (dotted lines) for the obscured-AGN (red) and the star-forming galaxies (blue) in three bins of stellar mass: log(M*/M⊙) ∼ 10, 10.5, and 11.0. (Color online)
To place more stringent constraints on the stellar mass of our galaxy sample, it is prudent to measure the stellar light centered around the rest-frame near infrared, hence we include available YJHK photometry from the Deep Extragalactic Survey (DES) and the Large Area Survey (LAS), which are part of the 10th data release of the UKIRT InfraRed Deep Sky Surveys (UKIDSS), which covers the spec-z surveys considered throughout this manuscript. Specifically, we use the Petrosian magnitudes available within UKIDSS-DES and LAS, which we correct for aperture biases between SDSS/HSC and UKIDSS. Based upon our comparison of the UKIDSS-DR10 catalog photometry with our own SDSS/HSC aperture-matched photometry, which we extracted directly from the UKIDSS imaging for a random subset of the sources in our spec-z catalog, we determined that a flux-dependent correction to the UKIDSS Petro photometry of +0.02–0.05 magnitudes, produces adequately matched photometric measurements between the three catalogs. We further confirmed our aperture corrections by harnessing the aperture-matched catalog of GAMA/SDSS and UKIDSS sources (Hill et al. 2011), finding a similar systematic average offset between the UKIDSS-DR10 Petro measurements and GAMA/SDSS–UKIDSS Petro-mag of ∼+0.03 mag.
At higher redshifts (z > 0.65), the rest-frame near-IR moves into the mid-IR, hence, we also include the four-band W1–4 mid-infrared photometry from the WISE all-sky survey, where AGN emission may also be prominent. In subsection 3.3 we use the WISE mid-IR photometry to build our AGN subsamples using WISE color–color diagnostics.
We use the publicly available idl code FAST (Kriek et al. 2011) to model the optical–IR SED of each object to derive physical properties, as well as the appropriate K corrections required to produce rest-frame photometry for each galaxy. FAST searches over a grid of models and uses χ2 statistics to determine the best solution. Throughout the fitting we assume an exponentially declining star-formation history with SFR ∼ exp[−t/τ] and a characteristic timescale of log(τ) = 7.0–10.0 yr, a Chabrier initial mass function, assuming stellar ages in the range log(age) = 8–10.1, and the high-resolution stellar population synthesis (SPS) models of Bruzual and Charlot (2003). Furthermore, we use a Calzetti et al. (2000) dust reddening curve, allow for extinction in the range AV = 0.2–4.0, and derive templates for metallicities of {0.008, 0.02 (solar), 0.05}. To determine the uncertainties for the fitted parameters we perform 500 Monte Carlo realizations of this FAST setup, and quote the 67th percentile of the simulations.
The Bruzual and Charlot SPS templates do not include contributions from AGN. Hence, to further ensure that we do not overestimate the stellar mass of sources containing a mid-IR detected AGN, for known AGN (see subsection 3.3) we fit the WISE photometry with a power law, and following Azadi et al. (2017), we subtract this AGN continuum from the WISE photometry to estimate the galaxy-only continuum. In figure 2 we show examples of the two best-fit SED templates to our suite of photometry assuming the inclusion (solid line) or exclusion (dotted line) of the HSC photometry.4 Qualitatively, the best-fit templates appear extremely similar across a large wavelength range (λ ∼ 3000 Å–4 μm). Indeed, we find that the difference between the derived M*, SFR, and AV measurements between the two photometry sets are all consistent at the 1 σ uncertainty level determined directly from our Monte Carlo realizations. In turn, this suggests that for the subset of significantly extended and/or well-resolved galaxies currently lacking reliable photometry in HSC, the exclusion of these photometric points does not affect our ability to measure the galaxy properties using FAST. Furthermore, we assessed systematic bias towards the M* measurements between the (obscured) AGN and non-AGN galaxies. In the lower panel of figure 2 we provide the rest-frame stacked SED templates for sources predicted to have M* ∼ 1010, 1010.5, and 1011 M⊙ for AGN and non-AGN. We show that in each instance the stacked SED templates are similar for AGN and non-AGN systems in each individual mass bin. This suggests that scattered light from the obscured AGN is not present or not adversely affecting the stellar mass estimates in these systems. Hence, we conclude that there is no significant systematic bias between the stellar mass estimates for AGN and non-AGN galaxies.
3.2 Rest-frame photometry and UVJ selection
As well as matching our interacting and non-interacting galaxy samples based on their stellar masses, it is also prudent to consider matching on galaxy color. In this section we use the derived rest-frame photometric information to separate our spec-z galaxy sample using a typical star-forming/quiescent classification diagram, which harnesses the apparent rest-frame color bimodality between star-forming and non-star-forming galaxies.
Following the procedure outlined in the previous section, we determine rest-frame photometry directly from the best-fit SPS template. We apply a simple Gaussian noise model to the best-fit template with the noise amplitude matched to the average 1 σ uncertainty of the measured photometric data, and use the known spec-z to produce a rest-frame simulated SED. The addition of the Gaussian noise provides a more realistic estimate of the measurement of the photometry that would be found from real observations, and that may otherwise not be captured in the discretized SPS models. We convolve the simulated SED with rest-frame U, V, and J filters, as well as determining appropriate K corrections for all of the input photometry, to produce rest-frame measurements.
In figure 3, we show the rest-frame U − V vs. V − J color–color diagram (hereafter, UVJ diagram) for our spec-z galaxy sample. We separate quiescent and star-forming (SF) galaxies using the proposed boundaries computed by Williams et al. (2009). The implementation of this two-color cut allows us to identify dust-reddened star-forming galaxies, i.e., those with U − V > 1.6 that may otherwise be tagged as quiescent using typical rest-frame color-magnitude diagrams. We confirm that in three separate and distinct redshift bins, z ∼ 0.1–0.3, 0.3–0.6, and 0.6–0.9, the SF galaxies are typically less massive systems (with M* < 3 × 10¹⁰ M⊙) than their quiescent counterparts. At these lower masses, our sample is overwhelmingly dominated by SF systems by factors of ∼6–10 at z > 0.3, while in the lowest redshift bin, the samples of quiescent and SF galaxies are more comparable, owing mainly to the spectroscopic coverage from GAMA-DR2. Of the more massive galaxies with M* > 3 × 10¹⁰ M⊙, our spec-z sample is dominated by quiescent galaxies by factors of ∼2–5, driven mainly by the abundance of massive “red” galaxies targeted for spectroscopic follow-up in SDSS-BOSS. The more massive population of SF galaxies, that reside outside of the quiescent boundary in the UVJ diagram, have systematically higher U − V and V − J colors than the lower-mass star-forming galaxies. This suggests at least one magnitude of optical extinction towards the galaxy continuum in these objects. Our final spec-z sample contains 75886 and 62657 quiescent and SF galaxies, respectively.
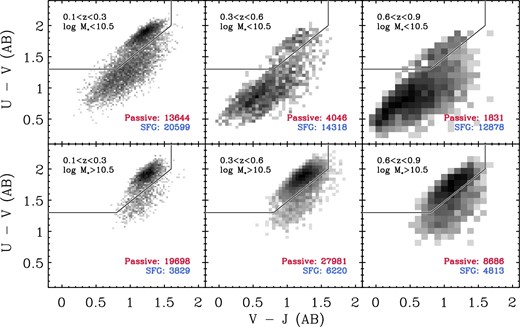
Rest-frame U − V versus V − J diagrams for all spec-z galaxies in our parent sample. Rest-frame AB photometry is derived from best-fit SED templates produced from FAST. Column panels: galaxy sample split in three redshift bins, 0.1 < z < 0.3, 0.3 < z < 0.6, and 0.6 < z < 0.9. Rows: redshift bins separated by two stellar mass bins, logM*/M⊙ < 10.5 and logM*/M⊙ ≳ 10.5. (Color online)
3.3 Mid-IR AGN selection using the (ALLWISE) WISE all-sky survey
While most AGN are intrinsically luminous in any given wavelength band, the homogeneous selection of an unbiased population of AGN from survey data is not straightforward. Intervening gas and dust, as well as dilution of the AGN signatures by host galaxy light, are the most common sources of observation selection bias. Indeed, many studies have now shown that no one waveband can identify all AGN (Alexander et al. 2008; Donley et al. 2008; Hickox et al. 2009; Juneau et al. 2011; Mendez et al. 2013; Goulding et al. 2014; Trump et al. 2015; Azadi et al. 2017). Moreover, in the previous section we determined that the most massive SF galaxies in our spec-z sample are likely obscured by AV > 1 mag, further hampering AGN detections. However, even in the presence of significant dust attenuation, relatively unbiased detections of luminous AGN may be made at mid-IR wavelengths. AGN emission produced directly from the optical/UV luminous accretion disk or from the X-ray-emitting corona may be absorbed and reprocessed by dust which surrounds the central BH. This dust-rich torus isotropically re-emits at mid-IR wavelengths, which is relatively insensitive to further absorption at larger radial distances from the AGN.
Mid-IR AGN identifications can be made either through the detection of high-ionization emission lines in mid-IR spectroscopy (e.g., Diamond-Stanic et al. 2009; Goulding & Alexander 2009), or through the establishment of the presence of an AGN-produced power-law continuum using mid-IR photometry. More specifically, a wide variety of AGN selection techniques have been proposed that harness color–color diagrams developed using two, three, or four-band mid-IR photometry taken using the IRAC instrument on the NASA Spitzer Space Telescope (e.g., Lacy et al. 2004; Stern et al. 2005; Alonso-Herrero et al. 2006; Donley et al. 2012), or more recently using WISE (e.g., Jarrett et al. 2011; Stern et al. 2012; Mateos et al. 2012), which we harness here. Mid-IR color–color selection is particularly effective at identifying high-luminosity AGN (LAGN ≳ 1043 erg s−1), where the contrast between the AGN and the host galaxy is high. However, IR color–color diagrams may fail to readily identify AGN accreting at low Eddington ratios (e.g., Donley et al. 2012; Mateos et al. 2012; Hainline et al. 2016).
3.3.1 Identifying WISE counterparts to galaxies in HSC
Due to the all-sky nature of the WISE survey, HSC is covered in its entirety by four-band cryogenic mid-IR observations at 3.4, 4.6, 12, and 22 μm. We matched the positions of our HSC spec-z sample to the objects present in the the ALLWISE release using the same method outlined in D’Abrusco et al. (2013) and Goulding et al. (2014), which we briefly outline here. We used expanding radial apertures of Δr = 0|${^{\prime\prime}_{.}}$|1 to search for all WISE counterparts to HSC sources to a distance of r = 4″. By randomly shifting the centroid of the HSC source by ±20″, we computed the likelihood of spurious counterparts as a function of radial distance from the true HSC source position. We determined that the optimal maximum matching radius for HSC and WISE is r( < R) ∼ 1|${^{\prime\prime}_{.}}$|6. At r > 1|${^{\prime\prime}_{.}}$|6 the probability of including spurious counterparts into our sample exceeds that of a real HSC–WISE match.
We identified 103406 HSC galaxies in our spec-z sample that have at least one counterpart in WISE. For the ∼0.6% of HSC sources with multiple WISE counterparts within 1|${^{\prime\prime}_{.}}$|6, we chose the WISE source with the smallest separation to the HSC galaxy. Over 97% of the HSC–WISE matches are at separations of r < 1″, and the distribution of the matching radii are characterized by a log-normal, peaked at 0|${^{\prime\prime}_{.}}$|18, and with an FWHM of ∼0.35 dex. The peak at 0|${^{\prime\prime}_{.}}$|18 is consistent with the astrometric precision of the WISE sources (Wright et al. 2010).
3.3.2 AGN identification using mid-IR color selection
In figure 4 we use the [3.4] − [4.6], [4.6] − [12.0] mid-IR color–color diagram to identify galaxies with a significant contribution from a central AGN. Specifically, we include all galaxies that are detected in the WISE [3.4], [4.6], and [12.0] bands, with a signal-to-noise (S/N) ≳ 4 for the [3.4] and [4.6] bands. The longer-wavelength bands in WISE are significantly less sensitive (by at least a factor of two) than the [3.4] and [4.6] bands. Hence, we marginally relax our S/N threshold to S/N > 2.5 in order to consider a source detected in the [12.0] band. We note that this cut is still more conservative than the S/N > 2 used to identify objects throughout the ALLWISE catalog. From our HSC spec-z sample, 41990 galaxies are detected in three bands using WISE with our S/N cuts, and an additional 44389 galaxies are detected in only [3.4] and [4.6] WISE bands.
![WISE infrared [3.4] − [4.6] versus [4.6] − [12.0] Vega magnitude color–color diagram of HSC galaxies with WISE counterparts. All objects have detections in the [3.4] and [4.6] bands with S/N ≳ 4 and in the [12.0] band with S/N ≳ 2.5. The green dotted box shows the two-color AGN selection region of Mateos et al. (2012) and the black dashed line the one-color AGN selection cut of Stern et al. (2012). The panel columns are split by redshift, using the same cuts as in figure 3; rows indicate galaxies separated according to their position in the UVJ diagram. In the 0.1 < z < 0.3 panels, simulated color–color tracks derived from SED templates (Polletta et al. 2007) are shown. These tracks begin at z = 0.1 (filled symbols) and finish at z = 0.9 (open symbols). Individual templates are for a 13 Gyr elliptical (star), an ultra-luminous infrared galaxy (downward triangle), a starburst (diamond), and S0 (upward triangle), Sb (square), and Sd (circle) spiral galaxies. (Color online)](https://oup.silverchair-cdn.com/oup/backfile/Content_public/Journal/pasj/70/SP1/10.1093_pasj_psx135/2/m_pasj_70_sp1_s37_f7.jpeg?Expires=1749138339&Signature=CaRXW-N1qC3kJSiOR2Vll9uxhzz9JwKWD~6P7DO~~3QrF73f1S~hbpEF0p8RddiA-TzADjtaUlTM23evCOULVxQtM8abVRN1Hs8XyHY1AEkZh8JaaGIfRo80pl7ziPHcju7hB1IXqaTQ3YGhgbs4r1W94UENe3haxJGs3JMx57dMENs2FTl3ST1-VZT9C8FRun5xjy387eEHJhmUW-rh3q~jEiIQX8QWAga8iK~KI42N~lk0j6MqvGKzwKcnZ9nOpQ~uoGXI6L0ZZZ1MnW169c9YZm8ytuJui9hAy1KC0r9oLDwK3T7AYi-3KYbXwkJBFAxW4zMe3re7rF7x5pxkcA__&Key-Pair-Id=APKAIE5G5CRDK6RD3PGA)
WISE infrared [3.4] − [4.6] versus [4.6] − [12.0] Vega magnitude color–color diagram of HSC galaxies with WISE counterparts. All objects have detections in the [3.4] and [4.6] bands with S/N ≳ 4 and in the [12.0] band with S/N ≳ 2.5. The green dotted box shows the two-color AGN selection region of Mateos et al. (2012) and the black dashed line the one-color AGN selection cut of Stern et al. (2012). The panel columns are split by redshift, using the same cuts as in figure 3; rows indicate galaxies separated according to their position in the UVJ diagram. In the 0.1 < z < 0.3 panels, simulated color–color tracks derived from SED templates (Polletta et al. 2007) are shown. These tracks begin at z = 0.1 (filled symbols) and finish at z = 0.9 (open symbols). Individual templates are for a 13 Gyr elliptical (star), an ultra-luminous infrared galaxy (downward triangle), a starburst (diamond), and S0 (upward triangle), Sb (square), and Sd (circle) spiral galaxies. (Color online)
We use the two-color IR-AGN wedge defined by Mateos et al. (2012) to identify [3.4], [4.6], and [12.0] detected objects that have power-law-like continua, indicative of the presence of a radiatively efficient AGN. For galaxies that are not detected in the three WISE bands considered in figure 4, we also use the single color cut of Stern et al. (2012) to identify additional AGN (dashed line in figure 4). This has the advantage of allowing us to boost source statistics due to the relative insensitivity of the longer-wavelength WISE bands, as well as including the abundance of heavily obscured AGN that reside in ultra-luminous IR galaxies with [4.6] − [12.0] > 3.5 that may otherwise be excluded by the two-color wedge. Mid-IR AGN selections are suspected to be contaminated by low-metallicity strongly star-forming dwarf galaxies in the low-redshift universe (e.g., Hainline et al. 2016), and by hot strongly dust-obscured galaxies beyond z > 2. In figure 4, we additionally show simulated color–color tracks that are derived from the SED templates of Polletta et al. (2007) in our considered redshift range. These tracks typically lie below or outside the AGN selection regions used throughout, and hence contamination to our AGN selection from non-AGN interlopers is likely to be minimal (see also Goulding et al. 2014).
Of the ∼41990 galaxies in our matched HSC–WISE three-band sample, 3125 are selected as AGN using the Mateos et al. (2012) WISE selection method. An additional 665 galaxies are selected as AGN using the Stern et al. single-color cut, i.e., a total of 3790 WISE-selected AGN. We find that if we separate the galaxies based on their position in the UVJ diagram, the WISE-AGN are overwhelmingly hosted in star-forming galaxies. Indeed, only ∼4% of the WISE-AGN in our spec-z sample are hosted in quiescent galaxies. This clear separation of mid-IR AGN residing in star-forming galaxies over quiescent galaxies serves to highlight the previously observed connection between star-formation rate and BH accretion rate (e.g., Chen et al. 2013; Hickox et al. 2014).
Unlike more traditional color–magnitude diagrams (Strateva et al. 2001; Baldry et al. 2004), the separation of star-forming and quiescent galaxies through UVJ diagnostics is relatively insensitive to dust extinction in the host. As a result, dusty star-forming galaxies are still robustly identified using UVJ while they may otherwise be classified as quiescent or green-valley systems using color–magnitude diagrams. The observed separation of AGN in figure 4 using UVJ may explain why many AGN have previously been believed to be an interesting population of transitioning “green-valley” galaxies that lie between the blue cloud and red sequence (Bell et al. 2004; Faber et al. 2007; Nandra et al. 2007; Hasinger 2008; Silverman et al. 2008; Mendez et al. 2013). In reality, it would appear that these luminous mid-IR AGN are merely hosted in dusty star-forming systems with reddened optical colors.
The lack of mid-IR AGN observed in quiescent galaxies does not suggest that there are no accreting BHs in these systems. The vast majority of radio-loud AGN are known to be hosted in massive quiescent galaxies (e.g., Best et al. 2005; Hickox et al. 2009; Goulding et al. 2014; Delvecchio et al. 2017), though the majority of these radio AGN lack the signatures of a radiatively efficient accretion disk, which would be observed in the mid-IR. Furthermore, in galaxy group or cluster environments, evidence of AGN feedback due to radio emission from the BH present in the brightest cluster galaxy (so-called maintenance mode feedback) has long been established (e.g., Best et al. 2005; Rafferty et al. 2006; McNamara & Nulsen 2007; Kauffmann et al. 2008; Fabian 2012). In these systems, powerful radio lobes inject mechanical energy back into the intracluster medium, which in turn prevents the efficient cooling gas, and are believed to be responsible for restricting the formation of new stars in quiescent galaxies.
Given the apparent paucity of mid-IR AGN in quiescent galaxies, the contribution of these systems to the rapid growth of BHs must be negligible in comparison to the AGN present in star-forming galaxies. Hence, for all further analyses presented here, we neglect the inclusion of quiescent galaxies in our spec-z sample, as identified using the UVJ diagnostic diagram, due to the systematic lack of mid-IR AGN in these systems. Furthermore, by removing relatively quiescent systems through our UVJ selection, our morphological analyses that are designed to identify merging features (described in section 4) are not subject to degeneracies arising from the existence of extremely long-lived stellar shells that are readily identified in early-type systems located within dense environments, and are unrelated to gas-rich mergers.
3.3.3 Separation of obscured and unobscured AGN
Active galactic nuclei identifications made at mid-IR wavelengths are relatively independent of obscuration. Following simple AGN unification, Type-1 AGN are those where the accretion disk can be viewed almost directly, with very little intervening gas or dust, while a Type-2 AGN is viewed edge-on, and therefore has the disk emission and broad-line region hidden from the line of sight by an optically thick torus surrounding the central BH. However, as this torus isotropically reradiates the AGN emission at IR wavelengths, a mid-IR AGN selection results in a mixture of both Type-1 and Type-2 AGN. While the emission from both these AGN populations dominate their SEDs at mid-IR, the characteristic tail of the AGN accretion disk, which is typically observed in the UV/optical, remains absent for only the Type-2 AGN. Hence, studies have revealed that a simple observed-frame optical–IR color cut reliably separates unobscured Type-1 AGN from their obscured counterparts (see Hickox et al. 2007, 2011; Chen et al. 2015).
In figure 5 we present the distributions of our mid-IR selected AGN sample in their observed-frame iSDSS − [4.6]WISE color. In a similar vein to Hickox et al. (2007), we find that these optical–IR colors can be characterized by two distinct Gaussian distributions, peaking at iSDSS − [4.6]WISE ∼ 0.5 and 1.9. Similar to Hickox et al. (2007), we cut our AGN sample into obscured and unobscured subsamples using optical–IR color. We use a cut of iSDSS − [4.6]WISE = 1.1, which is based on the intersection of the Gaussian distributions. This serves to maximize the number of AGN with the correct Type-1/2 classification, while minimizing contaminants. We find 2552 and 1238 sources with optical–IR colors that are red-ward and blue-ward, respectively, of our iSDSS − [4.6]WISE = 1.1 cut. Inspection of the SDSS spectroscopy for a subset of the AGN with iSDSS − [4.6]WISE ≲ 1.1 confirms the presence of broad Hβ, Hγ emission lines and/or a strong blue disk continuum.
![Observed optical–IR color versus absolute magnitude diagram used for separating our mid-IR-selected AGN into obscured and unobscured subsamples (gray-scale contours). In the i − [4.6] color, the AGN sample shows a distinct bimodality, with unobscured Type-1 AGN exhibiting bluer colors of i − [4.6] < 1.1. Overlaid are the Type-2 AGN shown with rainbow colors to represent the source spectroscopic redshift. The right panel provides the histogram of the optical–IR color (black solid line) that is well characterized by the summation of two Gaussians, a type-1 AGN population (blue dashed) and an obscured AGN population (red dashed). The dotted lines are a simple cut that separates the AGN populations with minimum contamination. (Color online)](https://oup.silverchair-cdn.com/oup/backfile/Content_public/Journal/pasj/70/SP1/10.1093_pasj_psx135/2/m_pasj_70_sp1_s37_f8.jpeg?Expires=1749138339&Signature=MG8hHNW10Zm3HJjIF1-~zvJCOTRhn9CgOhdfH31rnm5HfoZ0bkF-tJrvW4VLw~-1aMqJcAKknQROdRRYdxtLabxjlWG9c2mD2vlqT76ujBVfQcgY6oTZlGGegfkn669eS6aj1x7FduRfQpiIVqdV2RhUas-OldnT-2VjPX~VxFW4BNOVDAD0rYINb0yFXAJ-kEZ942FVU-eTUbRFdP9IeOYg0TBvljCIk5~hJ2VPFBBUIa8H7DTcZroVAM3ZZJzasra4uBZMi4uxAZcmM7bNW7QUeHuaRTSwoxZgcJl9j8dwdv03N-JCeOHvWP60jaGrcDeVdLjiMsVLZWSVRDrxpA__&Key-Pair-Id=APKAIE5G5CRDK6RD3PGA)
Observed optical–IR color versus absolute magnitude diagram used for separating our mid-IR-selected AGN into obscured and unobscured subsamples (gray-scale contours). In the i − [4.6] color, the AGN sample shows a distinct bimodality, with unobscured Type-1 AGN exhibiting bluer colors of i − [4.6] < 1.1. Overlaid are the Type-2 AGN shown with rainbow colors to represent the source spectroscopic redshift. The right panel provides the histogram of the optical–IR color (black solid line) that is well characterized by the summation of two Gaussians, a type-1 AGN population (blue dashed) and an obscured AGN population (red dashed). The dotted lines are a simple cut that separates the AGN populations with minimum contamination. (Color online)
We further show in figure 5 that the obscured and unobscured AGN do not follow similar distributions when considered in optical–IR color versus absolute i-band magnitude space. There is an additional population of low-redshift, low-luminosity (Mi > −20.5 mag), extremely blue objects with iSDSS − [4.6]WISE ≲ −0.5 that are not mirrored in the obscured AGN population. These may be a set of AGN hosted in very low-mass galaxies (e.g., Satyapal et al. 2014b; Secrest et al. 2015; Sartori et al. 2015) or a population of low-metallicity blue dwarf galaxies (M* ≲ 5 × 10⁹ M⊙) with powerful young starburst regions. These starbursts produce red colors in WISE that are similar in practice to emission from AGN (e.g., Hainline et al. 2016).
By contrast, there appears to be a population of luminous obscured AGN at Mi ≲ −23.8 mag that are not present in our Type-1 AGN sample. At these luminosities, Type-1 AGN will most likely saturate the HSC detector for relatively nearby systems and/or appear similar to bright point sources at higher redshifts. These systems are therefore preferentially removed from our sample during our initial catalog selection by setting the is_extended flag. Such dominance of the AGN over the host galaxy would hinder and bias our determination of the host galaxy properties during the SED-fitting process (e.g., stellar masses are known to be over-estimated for Type-1 AGN) and during our morphological analysis presented in the next section. Hence, to ensure the most unbiased measurements of the AGN host galaxies, we select only the 2552 obscured AGN with M* > 5 × 10⁹ M⊙ for all further analyses that compare the AGN/galaxy properties.
4 Identifying interacting and merging galaxies within HSC images
In this section we harness the exquisite sensitivity and spatial resolution afforded to us by the HSC survey to provide a basic morphological classification for each galaxy in our spec-z sample. Using parametric and non-parametric metrics, combined with a novel implementation of a random forest machine-learning algorithm, we separate our spec-z galaxy sample into subsamples of major mergers, minor mergers and irregulars, and non-interacting galaxies.
4.1 Profile fitting with galfit
Image analysis techniques have been developed to produce parametric measures that are capable of separating galaxies by their morphological type. Using a priori knowledge of a galaxy’s structural properties—early-type galaxies have smooth, elliptical isophotes, while late-type galaxies tend to be more disk-dominated with flatter light profiles—it has been shown that even simple one- or two-dimensional decompositions of the light profiles are capable of separating galaxies by their Hubble type (e.g., Kormendy et al. 2009; Simard et al. 2011).
In order to analyze the size, morphology, and stellar light distribution of the galaxies in our sample we begin by fitting a single two-dimensional Sérsic profile (Sérsic 1963) using galfit (Peng et al. 2002) to the HSC i-band images. We extracted 100 × 100 kpc postage stamps from the co-added data products produced by hscPipe, along with the associated variance image and data mask. Point spread function images are extracted from the pipeline products on a source-by-source basis. Within hscPipe, the PSF images are computed using the PSFEx software (Bertin 2011) from 41 × 41 pixel images of nearby stars to determine the size and ellipticity of the PSF for each visit. These PSFs are then co-added to replicate the average PSF of the co-added image. The median PSF size for our sample is ∼ 0|${^{\prime\prime}_{.}}$|6. See Bosch et al. (2018) for further details on the computation of the PSF images.
To measure a background level for each image, we used the full HSC catalog, which is sensitive to sources with i ∼ 27 mag, to identify and mask all objects that lie within the postage stamp image based on their catalog shape measurements and their Kron radii. We additionally applied the byte mask to those pixels previously flagged by hscPipe as erroneous. We fit a simple two-dimensional linear profile to the non-masked pixels to assess any overall background gradient within the image and determine a mean background level in each pixel. We fill all areas within the background image, which were previously masked, with Poisson noise determined by the mean background level predicted for the individual masked pixels. The measured background level was included as an input to galfit, and held fixed throughout the fitting procedure.
To create an input mask image for galfit, we masked all sources within the 100 × 100 kpc postage stamp that had integrated magnitudes at least 3 mag fainter than the target galaxy (i.e., a factor 1 : 15 fainter in flux). All areas identified in the hscPipe bad-pixel mask were also masked, and all bright point sources were masked with shapes based on the ellipticities and radii of the co-added PSF. For all remaining unmasked extended objects within the image, we included an additional Sérsic profile into the galfit fit centered at the position of the additional galaxy. Hence, during the galfit fitting procedure, we simultaneously model all bright galaxies with the postage stamp image. Our choice to mask objects determined to be at least a factor ∼15 fainter than the target objects allows us to simultaneously model all components of possible major or minor mergers to at least mass ratios of 1 : 10 (i.e., allowing for variability in the mass-to-light ratio).
We next extracted a subimage of 50 × 50 kpc centered around the target galaxy along with the respective mask and variance images. This subimaging approach has the advantage of limiting the computation time with galfit, while also maintaining that any large (unrelated) sources, which may have significantly overlapping isophotes with the region immediately surrounding the target galaxy but may have centroids outside the subimage, will still be appropriately masked or have a Sérsic profile assigned during the fitting process. The source image, variance image, and PSF model were all used as inputs for galfit.
In the upper-right subpanels of figure 6 we provide examples of the best-fit two-dimensional Sérsic profile fitted to the target galaxy. For each galaxy, we extract the best-fit parameters for the Sérsic profile, namely the Sérsic index, n, and the characteristic effective radius, Re, provided as a pixel length within galfit, which we convert to a physical scale in kiloparsecs for all further analyses. In the next section, we use the Sérsic parameters and Sérsic-profile subtracted images (residuals) to compute metrics in order to identify interacting and non-interacting galaxies.

Four examples of the imaging analysis described in section 4 performed on our spec-z HSC galaxy sample. The large panels are K-corrected (pseudo-restframe) three-color images; the smaller inset panels are the best-fit Sérsic model calculated using galfit (upper) and the residual image (i – model) with red color gradients for increasingly positive residuals and blue gradients for increasingly negative (lower). Labels provide the measures of asymmetry (Aimg), smoothness/clumpiness (Simg), concentration index (Cimg), and Gini index (Gimg) calculated from the i-band image, as well the asymmetry (Aresid), smoothness/clumpiness (Sresid), and residual flux fraction (RFF) calculated from the residual image. The interaction probability (Pmerge) determined from our implementation of a random forest machine-learning algorithm is also given (see subsection 4.2). (Color online)
4.2 Automated merger detection using supervised machine learning
4.2.1 Parametric and non-parametric morphology indicators
Many image analysis techniques have been developed to automatically separate merging systems from non-interacting and/or isolated galaxies, to varying degrees of success and accuracy. These methods often make use of parameterizing the structures present in the image of a given galaxy. In the previous section, we applied a two-dimensional Sérsic profile to HSC postage stamp images, which was a simple parametric approach for modeling the galaxy light distribution.
A tangential approach is to use non-parametric indices, which have been developed to assess the distribution of light within an image in order to separate/quantify a galaxy’s Hubble class and/or interaction stage (e.g., Patton et al. 2000, 2002; Lin et al. 2004, 2008; De Propris et al. 2007; Robaina et al. 2010; Bluck et al. 2012; Glikman et al. 2015; for a recent review see Conselice 2014). Typical non-parametric indices make use of the light concentration, asymmetry, and smoothness/clumpiness (hereafter, CAS measurements; see Bershady et al. 2000; Conselice 2003), as well as other measures involving the Gini index and the second-order moments of the light distributions (see Abraham et al. 2003; Lotz et al. 2004, 2008).
In the same spirit as these non-parametric indices, studies have now begun to develop new metrics that implicitly incorporate parametric measurements, resulting in hybrid parametric/non-parametric indices. For example, the residual flux fraction (RFF; Hoyos et al. 2011, 2012) measures the fluctuation of counts in residual images of galaxies once a simple best-fit Sérsic profile has been subtracted. Residual images increase the contrast of concentrated structures, as well as enhancing low-surface brightness features. Taken together, analysis of the residuals may better reveal interaction signatures between galaxies that may otherwise be missed in the original images.
Previous studies have determined that simple cuts on asymmetry and smoothness (A > 0.35 and A > S; Conselice 2003) or with the Gini and M20 parameters (G > −0.14 × M20 + 0.33; Lotz et al. 2004) can produce a reliable (∼50%) separation of galaxies undergoing mergers in relatively nearby massive systems. With the advent of new generations of telescopes and deep surveys, like HSC, we are now able to resolve faint merger signatures in large galaxy samples that were previously too weak to identify. However, as sensitivity to low-surface-brightness material increases, it becomes necessary to fine-tune our selection algorithms to identify features of interest, particularly as long-lived tidal debris, low-surface-brightness galaxies, and the outer parts of spiral galaxies may all trigger the same indicators (e.g., Greco et al. 2018).
Progress can be made by considering all of the information that can be extracted from a combination of each of these different parametric and non-parametric structure measures. Here we use a novel implementation of a machine-learning technique to provide a statistical measure of the interaction state of a given system.
As morphology “features” for our machine-learning algorithm, we measure the CAS parameters for each galaxy in our HSC spec-z sample, as well as the Gini and RFF indices. For the precise formulation of these parameters we refer the reader to subsection 2.3 of the review by Conselice (2014), and Hoyos et al. (2012). We measure each of these indices on the 50 × 50 kpc i-band postage stamp galaxy images. Following Hoyos et al. (2012), we also compute the asymmetry and smoothness/clumpiness parameters on the residual flux images (i.e., the i-band image after subtraction of the best-fit Sérsic model for the galaxy determined following the method outlined in the previous section). These non-parametric indices are combined with the parametric measurements of the best-fit Sérsic profiles to provide a suite of morphological parameters (hereafter, “features”) that we use to determine the interaction state of the galaxy through “automated classification.”
4.2.2 Training a random forest classifier
The goal of automated classification frameworks is to determine a model that describes some in-hand data for a set of objects whose “science classification” is known a priori. This model is then applied a new set of objects, whose classifications are unknown, and then used to predict a class or probability of a given classification for each new object. Several forms of data-driven automated classification schemes have been used to solve an abundance of astrophysical problems, such as Gaussian mixture models, Bayesian networks, neural networks, and support vector machines (e.g., Goldstein et al. 2015; Moolekamp & Mamajek 2015; Williams et al. 2016; Melchior & Goulding 2016; Avestruz et al. 2017). A conceptually simple, extremely efficient, and yet powerful classification method, which is becoming popular throughout astronomy, is that of decision-tree learning.
Decision trees are supervised non-parametric classifiers that remain efficient even when attempting to capture complicated feature-based structures. They naturally handle multiple classification schemes, and are relatively robust to outliers. However, tree models tend to have high variance. Due to the hierarchical structure of the trees, even small changes in the top levels of a training tree, induced by random selection of the variables used to split nodes, can produce vastly different trees on subsequent nodes. Also, while large trees will, by design, always fit the training data very well, a specific large tree may not generalize well to test data. This process is akin to over-fitting in simple regression.
Noise in the final classifications can be reduced by considering multiple decision trees for a given dataset, so-called “random forests.” Random forest classifiers fit multiple decision trees to bootstrap subsamples of a given training set. The final classification for an object is then the average of the classifications produced by the individual bootstrap decision trees, which naturally provides a (pseudo-)probability for the classification (driven by the input training data) while controlling for over-fitting of the data.
To build our training sample, we visually classified the 50 × 50 kpc K-corrected three-band HSC images for a random sample of 5900 galaxies in our spec-z sample that were deemed to be star-forming based on their position in the UVJ diagram. The specific visual classification scheme involved the identification of (1) irregular/disturbed/torqued morphologies, (2) double-nuclei/late-stage merger, (3) evidence for interaction with a distinct companion galaxy, (4) regular morphologies with no evidence for recent interaction, or (5) too small to conclusively identify. To normalize the responses of the seven expert classifiers, we averaged the individual visual classifications for a test subsample of 600 galaxies, and then weighted the responses accordingly for the remaining visual classifications. For galaxies that were clearly undergoing or had recently undergone an interaction, our expert classifiers were in strong agreement that at least one of the interaction classifications was valid. However, we noted significant variance among the experts when attempting to separate these different signatures of galaxy–galaxy interactions. As such, we elected to consolidate our visual classifications for interacting systems, as we determined that this provided a cleaner separation between interacting and non-interacting galaxies.5
Examples of four systems determined to be major mergers from their visual classifications are shown in figure 6. Each of these systems is clearly at a different stage of merging. In terms of the interaction classification outlined by Veilleux, Kim, and Sanders (2002), these galaxies would be classified as IIIa: wide binary (right column), IIIb: close binary (top left) and IV: merger (bottom left).6 These four examples exhibit relatively wide ranges in parameters such as their smoothness/clumpiness ∼0.1–0.8 (typical values in the range −0.5–1.5), but have narrow ranges in Gini (∼0.6) and RFF (∼0.3–0.4). The role of our random forest implementation will be to search for correlations between the visual classifications and the specific values/ranges of these features.
Our visually classified training sample was split to provide an input of 4500 galaxies used to construct the decision trees, and an independent subsample of 1400 galaxies to test the output classifications of the random forest classifier. We used the publicly available Python-based RandomForestClassifier code provided as part of the scikit-learn package (Pedregosa et al. 2011) to build the decision trees. The input features for the decision tree construction (see table 1) were the concentration (Cimg), asymmetry (Aimg), smoothness/clumpiness (Simg), and Gini (Gimg) indices measured from the HSC i-band images; the RFF, asymmetry (Ares), and smoothness/clumpiness (Sres) indices measured from the residual (galaxy–Sérsic model) image; and the Sérsic index and Re measured from the best-fit model.
RandomForestClassifier initiation parameters.
| Parameter | Value |
|---|---|
| input features | C img; Aimg; Simg; Gimg; |
| A res; Sres; RFF; Re; n | |
| n_estimators | 1000 |
| criterion | gini |
| max_features | |$\sqrt{9}$| |
| max_depth | 15 |
| min_samples_split | 12 |
| bootstrap | True |
| warm_start | False |
| class_weight | balanced |
To avoid importance bias of a particular input feature, we first normalize the distributions of each feature to have mean zero and unity variance before inputting to the random forest generator. The random forest is initiated with the parameters shown in table 1, and then trained to identify galaxies based upon the three morphological classifications assigned during our visual classifications: 1. non-interacting (inclusive of Stage I pre-mergers); 2. major merger (inclusive of Stage II–IV mergers); 3. minor mergers (inclusive of Stage V irregulars). The final assigned classification is then the average of the “votes” from each of the 1000 decision trees, i.e., the fraction of trees that assign a classification of “isolated” is Pisolated.
An example of one of the 1000 decision trees in the random forest is shown in figure 7. After experimentation, the branches are pruned to not allow depths beyond 15 nodes, though most branches terminate before this as we set a minimum threshold of >12 sources for a new node to be created. In the example presented in figure 7 we find that in the initial node of the tree (left-most box in the diagram) a relatively neutral cut in RFF (0.0076 in normalized units) ultimately results in a strong overall distinction between interacting and non-interacting galaxies. All subsequent nodes leading upwards and away from the initial node (i.e., training objects with RFF ≤ 0.0076) are, in general, colored orange, denoting non-interacting galaxies. By contrast, subsequent nodes leading downwards and away from the initial node (i.e., training objects with RFF >0.0076) are more likely to result in nodes containing interacting galaxies—colored either purple (major merger) or green (irregular/minor merger).
![Example of a decision tree within our implementation of a random forest machine-learning algorithm. The random forest is constructed from our representative sample of 5900 visually classified galaxies. Each decision tree is formed from a bootstrap resampling of a subsample of 4500 visually classified galaxies and is trained to identify objects based on three morphological classifications (1: non-interacting [orange]; 2: major/late-stage merger [purple]; 3: minor merger/irregular [green]). Nodes are gradient color-coded depending on the purity of the classification decision (light colors have low purity, dark colors have high purity). (Color online)](https://oup.silverchair-cdn.com/oup/backfile/Content_public/Journal/pasj/70/SP1/10.1093_pasj_psx135/2/m_pasj_70_sp1_s37_f10.jpeg?Expires=1749138340&Signature=DnbVttaf7lMsVGfVXOpcKXsCCnKbj7TCxpFMzmg3evD~hiSdUb1fJVptcGlPSFVdV5whkY7vMI-8ZqEyKqqbGVOzYCJQgLe8lk7QSYkRdbFxpfEB-Di9ytyrUAWgX3sM2tLh2QJbYYRPz8bILON8Yz1BQZD5lZsAr3PMA2wsTwI-uukppAvXQZEgVxiADN3jW3dM~IpkkZiyzJV6nQTr-hBqdsgJizIxjMQ9VG4izMzIzk~4tHZAimWksDHT1O6Yby8s5xHnJU8oOyrUzdGalAPR1JMQ1y8mcDwOltZYlatopJEnCYLcujuP64I8yrHUecP-bRfqCv42qHv267RK5w__&Key-Pair-Id=APKAIE5G5CRDK6RD3PGA)
Example of a decision tree within our implementation of a random forest machine-learning algorithm. The random forest is constructed from our representative sample of 5900 visually classified galaxies. Each decision tree is formed from a bootstrap resampling of a subsample of 4500 visually classified galaxies and is trained to identify objects based on three morphological classifications (1: non-interacting [orange]; 2: major/late-stage merger [purple]; 3: minor merger/irregular [green]). Nodes are gradient color-coded depending on the purity of the classification decision (light colors have low purity, dark colors have high purity). (Color online)
Furthermore, in figure 7 we show that minor mergers are difficult to distinguish from major mergers and non-interacting galaxies. The minimum node value (i.e., the number of connecting nodes required to reach a node from the initial [left-most] node) of an irregular/minor merger classification is 4, with the majority of the irregular/minor merger leaves not being identified until node >7. From a decision tree standpoint, minor mergers then become a subcategory of the more dominant isolated and major merger classifications, making their robust identification complex.
Using our training visual classification sample, we additionally calculated the importance of the input features that went into producing our random forest classifier. The importance can be thought of as the fraction of useful information that is used by the classifier during the construction of a decision tree, with the sum of importances, I, over all features equaling unity. The most important features, averaged over all trees, were Sres, Aimg, and RFF, each with I ∼ 0.17–0.21, while the Cimg was the least useful with I ∼ 0.03.
4.2.3 Testing the random forest classifier
To assess the ability of our random forest to provide reliable probabilistic classifications to the remainder of our HSC spec-z galaxy sample, we applied the trained random forest to our “test sample” of 1400 visually classified galaxies that were not used during the training of the classifier. In figure 8 we provide the distributions of the classification probabilities for our test sample separated by their visual classifications. For each classification probability, the distribution of the true visual classified objects peak at higher probability values. Indeed, it is clear from the Pisolated histograms that we can cleanly recover a sample of isolated galaxies with a cut of Pisolated > 0.7, with little or no contamination from interacting galaxies. However, this of course does not recover the full population of isolated systems, as this population of objects begins to mix significantly with objects towards lower values of Pisolated. This is also mirrored in the distributions of Pminor-merger and Pmajor-merger.
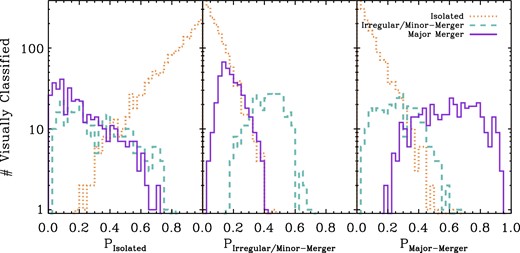
Distributions of probabilistic merger-state classifications assigned by our implementation of a random forest machine-learning algorithm to 1400 visually classified galaxies. The random forest was trained on an independent sample of 4500 visually classified galaxies randomly selected from our main HSC spec-z sample. Left: Probability of being an isolated galaxy (Pisolated). Center: Probability of being an irregular galaxy or a minor merger (Pirregular/minor-merger). Right: Probability of being a major merger (Pmajor-merger). Distributions are split as a function of their visual classification (isolated; irregular/minor merger; major merger); see subsection 4.2 for further details. (Color online)
In figure 9 we further explore contamination to a major merger sample when applying a threshold in Pmerger. As expected, we find galaxies assigned to have high values of Pmerger by the random forest are increasingly more likely to actually be major mergers based on their visual classification. We find that while a threshold of Pmerger > 0.33 would provide a sample that is ∼90% complete towards major mergers, ∼30% of the sample would be contaminated by non-interacting galaxies and minor mergers/irregulars. Based on our random forest and limited training sample, we cannot yield a truly pure sample of major mergers that is more than ∼39% complete. However, in the range 0.32 < Pmerger < 0.67 it is clear we suffer from only mild contamination (∼10%), and only ∼1/3 of the sample contamination arises from isolated galaxies. Hence, a cut of Pmerger > 0.32 yields a relatively clean sample of interacting systems (i.e., minor and major mergers), while a cut of Pmerger > 0.46 yields a sample of major mergers that is >75% complete and suffers less than ∼10% contamination, the majority of which arises due to minor mergers and irregulars, which themselves may have somewhat ambiguous visual classifications given the almost arbitrary demarcations that are made between the visual classes.
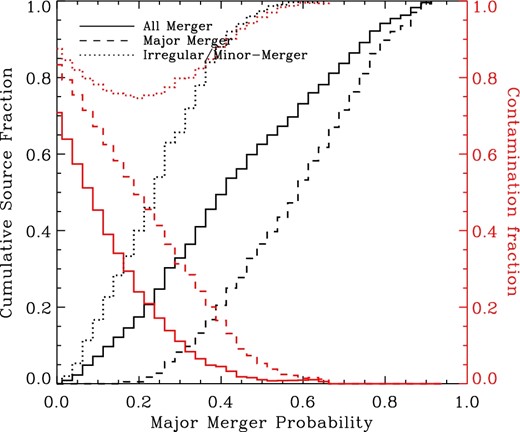
Fraction of sources in our test set of 1400 visually classified galaxies as a function of the probability of a particular system being a merger. Merger probabilities are computed during the implementation of a Python-based random forest machine-learning algorithm trained on an independent set of 4500 visually classified galaxies in our main HSC spec-z sample. Dashed, dotted, and solid lines are those galaxies visually classified to be major mergers (flux ratio >1 : 4), minor mergers 1 : 4–10, and major or minor mergers, respectively. Red lines provide the fraction of objects with a given Pmerger that are determined to not be the given merger classification (i.e., for major mergers, contaminant populations are non-interacting galaxies and minor mergers). (Color online)
Finally, we also tested for any effect to the classifications due to the presence of an unobscured AGN, which may have been incorrectly classified as a Type-2 AGN from our IR–optical color cut. While we do include a PSF model during our galfit analysis, we found that the presence of a Type-1 AGN still marginally steepens the Sérsic index, significantly increases the concentration index, and lowers the asymmetry value. These are each due to the galaxy light being partially contaminated by the AGN. Irrespective of whether the source was visually classified as an non-interacting or major merger, we found this typically lowered the value of Pmerger, resulting in the source being more likely to be classified as a non-interacting galaxy. As such, we note here that the presence of Type-1 AGN in our sample may artificially increase the merger fraction in non-interacting galaxies, and hence these will dilute the signal from AGN being intrinsically preferentially hosted in major mergers in the next section. In the next section, we use these automatic classification probabilities to construct relatively robust samples of non-interacting isolated galaxies, major mergers, and a set of interacting (irregular + minor merger + major merger) galaxies, and investigate the incidence of AGN in these systems.
5 Results
Despite the theoretical successes of BH–galaxy co-evolution models to explain the present-day observed galaxy populations, observational evidence for the presence of an ongoing merger and the concurrent rapid growth of BHs, which is now a required ingredient of galaxy formation simulations, remain elusive. In this section we use the morphological/interaction probabilities derived using our implementation of a random forest machine-learning algorithm to assess the incidence of AGN in carefully constructed statistically significant samples of major mergers, minor mergers and irregulars, and non-interacting galaxies.
5.1 Incidence of AGN in interacting and non-interacting galaxies
AGN activity is a highly stochastic process, with changes in accretion rate that typically occur on timescales that are much shorter than longer-lived galactic processes, such as changes in stellar mass, star-formation rate, or even merger stage. Thus, it is more robust to probe the average AGN property (i.e., averaging over BH accretion variability) as a function of the longer-timescale galactic process (see Hickox et al. 2014). Hence, we now investigate the average incidence of AGN based on host–galaxy interaction stage by harnessing three galaxy samples: 1. major mergers; 2. all interacting galaxies (including major merger, minor mergers, and irregular systems); and 3. non-interacting galaxies.
5.1.1 Selecting galaxies and AGN in bins of interaction type
In subsection 4.2 we determined that a threshold of Pmajor-merger > 0.46 in our trained random forest classifier recovers ∼75% of the major mergers present in our visually classified test sample. A sample of major mergers defined by such a cut suffers contamination at the ∼7% level from minor mergers and irregular galaxies, and <3% from non-interacting galaxies. Applying this threshold in Pmajor-merger provides a clean sample of 4449 gas-rich major mergers at 0.1 < z < 0.9. In figure 10, we show a random set of examples of major mergers identified by our random forest classifier, which reside in a subregion of the HSC survey. The diversity of the sample of major mergers in their interaction state, mass ratio, number of systems, and redshift is clearly apparent. This is mainly driven by our large training sample of 4500 visually classified systems covering wide ranges in galaxy properties (including interaction state), as well as the sensitive HSC imaging that is capable of detecting the low-surface-brightness emission associated with merging, which may be otherwise missed in shallower wide-field surveys.
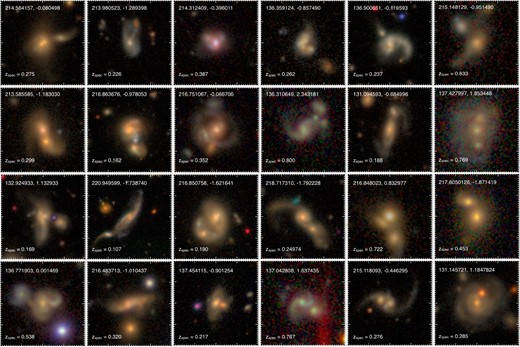
Examples of K-corrected three-color 50 × 50 kpc HSC images of the 4449 gas-rich major merger candidates at 0.1 < z < 0.9 selected to have Pmajor-merger > 0.46 based on our random forest classifier described in subsection 4.2. These merger candidates cover a wide range in interaction state, stellar mass ratio, and redshift. (Color online)
We define two additional galaxy samples: (1) a set of galaxies at all stages of interaction, which include major mergers, minor mergers, and irregular systems; and (2) a control set of non-interacting/isolated galaxies. Following our testing in the previous section, we invoke a threshold of Pmerger > 0.32 orPminor-merger > 0.40 to define the set of interacting galaxies, which yields an interacting sample of 5594 systems. The non-interacting star-forming galaxies are defined by Pisolated > 0.7, which provides a sample of 12513 galaxies, with ≪1% contamination from interacting systems.
In figure 11 we show the distributions of the three samples in their WISE [3.4] − [4.6] color and stellar mass, separated by three redshift bins (0.1 < z < 0.3, 0.3 < z < 0.6, and 0.6 < z < 0.9). The [3.4] − [4.6] color is indicative of the dust temperature, and incident SF or AGN activity. Additionally, we highlight each galaxy that has a significant AGN contribution to the mid-IR continua, and thus has a relatively high [3.4] − [4.6] color (≳ 0.7). The AGN were previously identified based on their two- or three-band mid-IR colors, as measured from their WISE photometry (see subsection 3.3); crucially, the AGN selection was performed independently of the morphology and interaction state of the galaxy.
![Lower panels: WISE [3.4] − [4.6] color (vega) as a function of stellar mass (in logarithmic units of M⊙) for three morphologically selected samples—non-interacting galaxies (Pisolated > 0.7; orange; bottom row), major mergers (Pmajor-merger > 0.46; purple; center row), and all interacting galaxies (major merger + minor merger + irregulars; Pmajor-merger > 0.32∨Pminor-merger > 0.4; red; top row). For merging/interacting systems, reported stellar masses are those of the most massive galaxy in the pair. The panel columns are split by redshift, using the same cuts as in figure 3. Galaxies identified as host IR-luminous Type-2 AGN using the diagnostics presented in figures 4 and 5 are shown with star symbols and colors denoting morphological classification. Dotted lines illustrate the AGN selection boundaries for galaxies with M* ≳ 5 × 10⁹ M⊙ and [3.4]–[4.6] > 0.8 (Stern et al. 2012). Top panels: Histograms of AGN fraction as a function of stellar mass constructed in redshift bins matched to the lower panel. AGN fractions in a given redshift bin are separated by morphological classification—non-interacting galaxies (orange dots); major mergers (purple dashed); all interacting galaxies (red solid). The AGN fractions are also corrected for incompleteness of non-WISE detections in the two highest redshift bins. We find in each redshift bin that galaxies undergoing mergers are a factor ∼2–3 more likely to contain AGN than non-interacting galaxies, and this is independent of stellar mass. (Color online)](https://oup.silverchair-cdn.com/oup/backfile/Content_public/Journal/pasj/70/SP1/10.1093_pasj_psx135/2/m_pasj_70_sp1_s37_f3.jpeg?Expires=1749138340&Signature=weLCD33bs8-g3QQiOCSQ1Q3rQDNEd1jJPfVmTnlUu1QV5iClb9kglhNAKbbP1aU5V~Ad29BxgoMT8RTUCUl9vP8i0OFzvICUc-qUgZL4~aT5T4YmDkUvZ0k4Z1o7PDSGvvLc3QQ-QMZKzOZaj9dUtRrf5ShCP6-odj8Dahv9tr3YA5p3sNuLX1JhDgUVPpx9jKfWdrIr96zdQD8dGtCNXQWUh8DvSmwXXmGpkdJr-CU5C3VheqhkJYVcCxbzLX9OQ13GKRhojEq-1CX9-SH-dCDZSr4QEBcx~aQGne2VnfmvPquHz85ba3NxnCL~dG-nx16ElMDJozRErh6p2FO~Jw__&Key-Pair-Id=APKAIE5G5CRDK6RD3PGA)
Lower panels: WISE [3.4] − [4.6] color (vega) as a function of stellar mass (in logarithmic units of M⊙) for three morphologically selected samples—non-interacting galaxies (Pisolated > 0.7; orange; bottom row), major mergers (Pmajor-merger > 0.46; purple; center row), and all interacting galaxies (major merger + minor merger + irregulars; Pmajor-merger > 0.32∨Pminor-merger > 0.4; red; top row). For merging/interacting systems, reported stellar masses are those of the most massive galaxy in the pair. The panel columns are split by redshift, using the same cuts as in figure 3. Galaxies identified as host IR-luminous Type-2 AGN using the diagnostics presented in figures 4 and 5 are shown with star symbols and colors denoting morphological classification. Dotted lines illustrate the AGN selection boundaries for galaxies with M* ≳ 5 × 10⁹ M⊙ and [3.4]–[4.6] > 0.8 (Stern et al. 2012). Top panels: Histograms of AGN fraction as a function of stellar mass constructed in redshift bins matched to the lower panel. AGN fractions in a given redshift bin are separated by morphological classification—non-interacting galaxies (orange dots); major mergers (purple dashed); all interacting galaxies (red solid). The AGN fractions are also corrected for incompleteness of non-WISE detections in the two highest redshift bins. We find in each redshift bin that galaxies undergoing mergers are a factor ∼2–3 more likely to contain AGN than non-interacting galaxies, and this is independent of stellar mass. (Color online)
Previous observations have suggested that the AGN fraction (above some particular threshold in AGN luminosity) rises steeply as a function of stellar mass (e.g., Xue et al. 2010; Aird et al. 2012; Bongiorno et al. 2012; Mullaney et al. 2012). Thus, it is important to consider stellar-mass-matched samples when assessing the relative incidence of AGN in our morphological/interaction-state samples. Here we provide the quoted mass-completeness limits towards star-forming galaxies of the spectroscopic surveys, from which our main spec-z sample derives. As shown previously in figure 1, in the lowest redshift bin, our sample is dominated by galaxies identified in the GAMA-DR2 survey, which is complete to M* ∼ 5 × 10⁹ M⊙ for star-forming galaxies with restframe g − i < 0.5 (Taylor et al. 2011) at the median redshift of the bin (z ∼ 0.2). Furthermore, at z ∼ 0.5, our sample is mainly comprised (∼75%) of galaxies drawn from the PRIMUS and VIPERS surveys, which for star-forming galaxies at z ∼ 0.5 are complete to M* ∼ 2 × 10⁹ M⊙ (Moustakas et al. 2013) and M* ∼ 3 × 10⁹ M⊙ (Davidzon et al. 2013), respectively. We note that while these surveys claim completenesses toward star-forming galaxies of M* ∼ 5 × 10⁹ M⊙, we ultimately do not require our sample to be complete in stellar mass, as the AGN fractions we present in the following sections are compared relatively between interacting and non-interacting galaxies.
5.1.2 WISE completeness corrections
In each of our considered redshift bins, our star-forming parent sample is roughly mass complete at around M* ∼ 5 × 10⁹ M⊙. However, as we advance in redshift, we systematically miss low-mass galaxies in our sample due to the flux limit of the WISE survey. This is observed in figure 11 as a deficit of sources in the 0.3 < z < 0.6 and 0.6 < z < 0.9 bins that have blue [3.4] − [4.6] colors and M* ≲ 2 × 10¹⁰ M⊙. This subsection outlines our statistical corrections for this incompleteness brought about by the WISE–HSC cross-match.
By comparison of the fractions of WISE-detected and non-detected galaxies at 0.3 < z < 0.6, we find that for galaxies in our spec-z sample with M* ∼ 5 × 10⁹ M⊙, ∼85% are not detected by WISE. Conversely, at the same redshift, only ∼5% of the galaxies with M* ∼ 1011 M⊙ are not detected in WISE. If we compare these fractions of WISE non-detections to our lowest redshift bin (0.1 < z < 0.3), we find that only ∼3% and ∼2%, respectively, of the galaxies are not detected in WISE in the same mass bins. This demonstrates that we are essentially complete towards WISE detections at low redshift, and that the loss of low-mass blue WISE color sources as a function of redshift can be almost entirely attributed to the flux limit in WISE.
From figure 11 we can deduce that the loss of low-mass blue WISE color sources is relatively independent of morphology classification. Two-sample Kolmogorov–Smirnov tests show that there is no significant evidence for a difference between M* distributions of the non-interacting, major merger, and all-merger samples within a given redshift bin.
IR-luminous AGN are selected to be more luminous and redder in WISE than non-active galaxies. As such, incompleteness may not affect AGN in the same way as non-active galaxies. To test this, we can compare the raw AGN fraction (i.e., no corrections for underlying completeness) between two redshift and stellar mass bins. For galaxies with M* ∼ 1011 M⊙ (a stellar mass bin which is unaffected by WISE completeness issues) the AGN fractions at 0.1 < z < 0.3 and 0.3 < z < 0.6 are consistent with each other: ∼2.4% and ∼2.3%, respectively, and we therefore see no evolution in AGN fraction between the redshifts in this mass bin. However, for galaxies with M* ∼ 5 × 10⁹ M⊙, the AGN fractions increase by almost an order of magnitude from ∼1.9% at 0.1 < z < 0.3 to 17.2% at 0.3 < z < 0.6. Such a large jump in AGN fraction in a small redshift range is wholly unphysical, and strongly suggests that while we are not detecting non-active galaxies in WISE for galaxies with M* ∼ 5 × 10⁹ M⊙, we do still identify those galaxies containing AGN. Thus, in order to calculate the AGN fractions presented in the following sections, we need only statistically account for the non-active WISE-undetected objects in each M* bin as a function of z. Indeed, we show in the next section that by making the assumption that our HSC–WISE cross-match only misses non-active galaxies, and correcting for this incompleteness, the AGN fractions are found to be similar in each mass bin across the full redshift range considered.
Based on our parent sample, in each redshift bin we compute the M* distributions of the galaxies that are not detected in WISE during our WISE–HSC cross-match. Under the informed assumption that none of these systems contain AGN, we use the ratio of the M* distributions between the WISE-detected and -non-detected to systems to normalize the AGN fractions presented in the next subsection.7 As our lowest redshift bin is relatively complete towards WISE detections, our computed corrections in this redshift bin are factors of ∼1.02–1.03. However, these corrections become large, ≳ 10, in the lowest mass bins at higher redshift. Ultimately, these completeness corrections allow us to qualitatively compare AGN fractions across the redshift bins. But crucially, as the corrections are applied irrespective of the interaction classification, they do not effect our conclusions when comparing fractional differences between AGN fractions at fixed M* and z.
5.1.3 AGN fractions at fixed M* and z
For a given redshift bin, we construct three equal stellar mass bins with width 0.7 dex (a factor of ∼5) for each of our morphological samples. Accurate photometric measurements, and hence stellar mass measurements, for merging galaxies are non-trivial for the most distant sources in our sample. As stated previously (see subsection 2.3), based on our comparison between HSC and Hubble Space Telescope data in the COSMOS field, we determined the photometric measurements for distant mergers to be accurate to ±0.3 mag, resulting in a factor ∼1.3–1.5 uncertainty in derived M* (dependent on typical mass-to-light ratios). As such, we conservatively construct our coarse M* bins in figure 11 to mitigate the effects of uncertainty in M*.
In the upper panel of figure 11, we show the fraction of objects in the mass-matched bins that are determined to be mid-IR AGN (fAGN). In the 0.3 < z < 0.6 and 0.6 < z < 0.9 bins, these AGN fractions are corrected using our derived M* completeness functions. We find that the AGN fractions in our major merger and all-merger samples are a factor of ∼2–7 higher than those for non-interacting galaxies. This result appears to be consistent across the redshift range considered here, in that fAGN is systematically higher for interacting galaxies over non-interacting galaxies, and this is observed in each of the redshift bins. We find that this enhancement in fAGN is significant at the 3.5–5.4 σ level for the sources with M* < 1011 M⊙, dropping to 1.7–2.2 σ in the high-mass bin for each individual redshift slice considered here. When combining the data across the redshift bins, the significance of this result increases to 3.3–8.0 σ across all stellar masses.
To further test the robustness of this result to the misidentification of AGN in our sample (i.e., normal star-forming galaxies with unusually red mid-IR colors that could mimic an AGN signature), we used a stricter W1–W2 color cut of >1.0 to classify a source as an AGN, and recalculated the AGN fractions. While this cut greatly affected the number of AGN being identified, particularly in the lowest redshift bin, we found that the increase in fAGN for interacting galaxies was still significant in six of the nine z–M* bins.
The fact that we observe an increase in fAGN in each redshift bin suggests that this result is independent of our M* completeness corrections. Indeed, we find that if we do not implement a completeness correction, fAGN remains enhanced by a similar factor in merging/interacting systems. For interacting systems, we find a marginal increase in fAGN with M* that is more pronounced with increasing redshift. However, we find that the fractional difference of fAGN for mergers and non-interacting galaxies does not appear to be conditional on M*.
Consistent with the merging/interacting galaxies, at z > 0.3 there is a marginal enhancement in fAGN for the non-interacting systems with the largest M* (>1011 M⊙) over the lower-mass non-interacting galaxies. However, we note that only two AGN are identified in the highest mass bin for the isolated systems at z < 0.3; these poor source statistics would prevent us from significantly identifying a similar rise at high masses, as observed in the higher redshift bins. Although we observe a rise in AGN fraction related to M* for isolated systems, crucially these measurements do not exceed the AGN fractions found for interacting galaxies at the same M*.
5.2 Testing for observational bias and heterogeneity in our spec-z sample
As discussed in subsection 2.3, our parent galaxy sample is constructed from a heterogeneous set of spectroscopic redshift surveys. While the majority of the surveys targeted all galaxies to a given brightness threshold and within a particular region of the sky, spectroscopic redshifts may still not have been measured for some objects. This can be due to observing difficulties, signal-to-noise effects, lack of emission features, etc., and hence are individually incomplete at some level to all galaxies within the sky region. Moreover, spectroscopic surveys such as SDSS-BOSS invoke optical color cuts to pre-select galaxies in a given redshift range, which results in complex selection/incompleteness effects. Thus, each spectroscopic redshift survey has its own unique set of selection biases, which become imprinted onto the main parent galaxy sample considered throughout our analyses. Here we test whether the spectroscopic surveys are biasing the AGN fractions measured in the previous section and presented in figure 11.
In figure 1 we showed that our parent sample is dominated by objects drawn from two to four different spectroscopic surveys for each of the three redshifts bins (i.e., 0.1 < z < 0.3; 0.3 < z < 0.6; 0.6 < z < 0.9) considered throughout. To test whether one of the spectroscopic surveys excessively contributes to the measured AGN fractions in any of the redshift bins presented in figure 11, and hence may be causing a bias in the AGN fraction at those redshifts, we systematically removed all objects pertaining to one particular redshift survey and recomputed the AGN fractions for that redshift bin. For example, in the lowest redshift bin at 0.1 < z < 0.3, it is clear that our parent sample is mainly drawn from objects presented in the SDSS-Legacy and GAMA surveys. Hence, we removed all galaxies (irrespective of morphology) drawn from the SDSS-Legacy survey and recomputed the AGN fractions at 0.1 < z < 0.3 for the three morphology/interaction categories for a single stellar mass bin.8 Even after removing the SDSS-Legacy survey objects, at 0.1 < z < 0.3 we found fully consistent AGN fractions with those presented in figure 11: fAGN, major-merger ∼ 0.031, fAGN, all-merger ∼ 0.029, and fAGN, non-interacting ∼ 0.0065. We repeated this test at 0.1 < z < 0.3 by removing all objects drawn from the GAMA survey, and again found a factor ∼3.5 increase in the interacting AGN fractions over the non-interacting sources. We continued this test in each redshift bin for each redshift survey, and consistently found that AGN are more prevalent in interacting galaxies and major mergers than non-interacting systems. The only marginal bias we observed during this test was with the exclusion of SDSS-BOSS galaxies, where we found that the AGN fraction difference between non-interacting and interacting galaxies increased from a factor of ∼3 to a factor of ∼6 at 0.3 < z < 0.6. This suggests a possible bias against the targeting of merging galaxies and/or AGN in the SDSS-BOSS survey, and hence the fAGN presented in figure 11 at 0.3 < z < 0.6 may be marginally conservative, and the true difference between mergers and non-interacting galaxies is likely to be larger.
5.3 The most luminous AGN preferentially reside in merging galaxies
Several recent studies have identified a possible correlation between AGN luminosity and galaxies undergoing mergers. These studies found high merger fractions (∼85%) in luminous LAGN > 1046 erg s−1 dust-reddened quasars (e.g., Urrutia et al. 2008; Glikman et al. 2012), consequently leading to the intriguing suggestion that merger fraction is dependent on AGN bolometric luminosity (Treister et al. 2012). This has been substantiated by the identification of a strong positive trend of increasing merger fraction spanning three decades in LAGN, which may persist beyond z ∼ 2 (e.g., Kocevski et al. 2015; Del Moro et al. 2016; Fan et al. 2016). However, others have found less convincing evidence for a connection between merger fraction and the most luminous AGN activity, particularly in Type-1 quasars (e.g., Villforth et al. 2017). Furthermore, at more moderate luminosities, LAGN < 1044 erg s−1, this connection appears to be weaker, with merger fractions remaining relatively constant (at ∼20%) with decreasing LAGN. These seemingly contradictory results are consistent with a picture in which mergers drive the high Eddington growth of the most massive BHs (LAGN ≳ 1044 erg s−1), but with secular/internal processes becoming increasingly dominant at lower Eddington ratios and/or lower BH masses.
We can test such a scenario using our interacting and non-interacting galaxy samples by assessing whether the most bolometrically luminous AGN are preferentially hosted in interacting galaxies over non-interacting galaxies. If the most luminous AGN are biased regarding the morphologies/interaction state of the host, then the AGN fractions for interacting/non-interacting galaxies, presented in figure 11, should have an additional dependency on LAGN at fixed stellar mass. However, and crucially, if indeed the most luminous AGN are systematically more likely to reside in merging galaxies, then fAGN, interacting and fAGN, non-interacting would not have the same dependency on LAGN at fixed stellar mass.
We test this hypothesis by measuring the change in fAGN between those values presented in figure 11 and the fAGN calculated after removing the upper quartile of the most luminous AGN present in a given M* bin (hereafter, fAGN, -UQ).9 For consistency, we use the same bins of M* and z as those presented in figure 11. Similar to our analysis in subsection 5.1, by measuring changes in fAGN between interacting and non-interacting galaxies, we naturally control for BH accretion variability, which likely occurs on shorter timescales than merger events.
Active galactic nuclei bolometric luminosities for our sample are computed by fitting power-law slopes to the mid-IR photometry of the AGN, and using the best-fit slope to predict the rest-frame 6 μm continuum luminosity, which is shown to be a robust indicator of LAGN (e.g., Lutz et al. 2004; Fiore et al. 2009; Chen et al. 2017). The AGN considered here cover a relatively wide range, with luminosities of LAGN ∼ 3 × 1043–2 × 1046 erg s−1.
In each M* bin, we find that the AGN fraction decreases substantially for the major merger and interacting galaxy samples by factors of ∼0.7–2 after removing the upper quartile of the most luminous AGN, i.e., ΔfAGN = fAGN − fAGN, -UQ ∼ 0.01–0.03, while the decrease in fAGN for the non-interacting galaxies was in some cases consistent with ∼0. This provides tentative evidence that the most luminous AGN do preferentially reside in merging galaxies.
We can give these results a stronger statistical footing by simulating the ΔfAGN had we not preferentially removed the upper quartile of the most luminous AGN, but instead randomly removed 25% of the AGN from a given M* bin (i.e., independent of LAGN). This is achieved through 10000 jackknife resamplings of fAGN for each morphology/interaction sample after removing a random set of 25% of the AGN in each M* bin at each redshift (fAGN, -Rand25). In figure 12 we plot the residual between fAGN, -Rand25 and fAGN, -UQ. The hashed regions represent the 90th percentiles of the jackknife samples. Across all three redshift ranges, we show a general trend of positive ΔfAGN for the interacting galaxies (i.e., fAGN, -Rand25, mergers > fAGN, -UQ), and negative residuals for the non-interacting galaxies (i.e., fAGN, −Rand25, non-interacting < fAGN, -UQ). Hence, we have good statistical evidence at the >90% level that the most luminous AGN systematically reside in the interacting galaxies at fixed stellar mass.
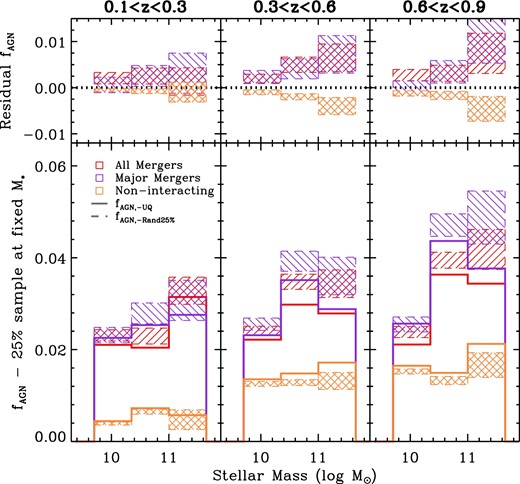
Lower panels: AGN fraction as a function of stellar mass after removal of the upper quartile (fAGN, -UQ) of sources with the highest LAGN (solid histograms). Hashed regions provide the AGN fraction determined after randomly removing 25% (fAGN, -Rand25) of the AGN in a given stellar mass bin, irrespective of LAGN. This fraction is recomputed 10000 times using a jackknife resampler, and the bounds provide the 90th percentile range of the samples. Color coding is the same as figure 11. Upper panels: Residual AGN fraction between fAGN, -UQ and fAGN, -Rand25 (i.e., ΔfAGN = fAGN, -Rand25 − fAGN, -UQ) as a function of stellar mass. In general, we find that the most luminous AGN systematically reside in the interacting/merging galaxies, hence their positive residual signatures. Conversely, fewer luminous AGN reside in non-interacting galaxies, as we show that fAGN, -UQ is systematically larger than the expected null result value, fAGN, -Rand25. (Color online)
In figure 12, we further show that at z > 0.3 the ΔfAGN appears to diverge with increasing M*, suggesting that a larger fraction of the most luminous AGN reside in interacting galaxies at higher M*, with an additional marginal preference for the most luminous AGN residing in major mergers. At z < 0.3 we find consistent (at the 90th percentile) residual fAGN values between the interacting and non-interacting galaxies in the highest M* bin, suggesting no statistically significant preference for luminous AGN between the interaction classifications. We note that this result may also be driven by the small number of AGN in non-interacting galaxies at high M* in our sample, preventing us from measuring a strong systematic difference. However, overall we show that fewer luminous AGN reside in non-interacting galaxies, with a strong preference for the most rapidly growing BHs to be generally hosted in major mergers.
6 Discussion
6.1 Evidence for stochastic BH growth during major merger events
Based on our population analysis (subsection 5.1), we can robustly conclude that, on average, those galaxies that are currently undergoing or have recently undergone some form of merger/interaction are a factor ∼2–7 more likely to be rapidly growing their central BHs than more isolated and non-interacting star-forming galaxies. Furthermore, while we have not attempted to address the question of whether all luminous AGN events must be triggered by mergers (such a study would require a thorough understanding of incompleteness effects), our results clearly indicate a systematic enhancement of fAGN in major mergers over non-interacting galaxies and/or even minor mergers. This could suggest that significant BH growth phase(s) are linked specifically to a major merger scenario.
Previous studies that have investigated merger–AGN connections have produced mixed results (e.g. Gabor et al. 2009; Cisternas et al. 2011; Schawinski et al. 2011; Kocevski et al. 2012, 2015; Treister et al. 2012; Ellison et al. 2013; Villforth et al. 2014), often finding that the host galaxies of AGN are similar to those of non-AGN (i.e., no strong enhancement in merger fractions of AGN over non-AGN). These results are seemingly at odds with our population analysis that shows, on average, AGN are markedly more likely to occur during a major merger than in an isolated galaxy.
We suggest that these apparent differences can be reconciled by considering the relative timescales of the luminous AGN activity, the dynamical time of a major merger, and the time spent as an isolated galaxy.
Motivated by galaxy merger simulations, we outline here a framework that closely ties BH accretion rate variability to the dynamical time of the galaxy merger. Given that AGN activity is known to vary on timescales much shorter than galaxy processes (e.g., Novak et al. 2011; Gabor & Bournaud 2013), and on average BH accretion rate is linked to available gas supply (e.g., Hickox et al. 2014), we make the ansatz that the act of merging further enhances AGN variability as galaxy merging strongly affects the inflow of gas, which can serve to fuel the AGN. For example, on first pericentric passage, gravitational torques may be sufficient to induce a short period of rapid BH growth (<50 Myr). After first passage, interaction signatures, such as tidal tails, may still be evident as the galaxies move to maximum separation (lasting ∼200–400 Myr). However, internally, the galaxies may partially relax, limiting fuel to the BH, and causing accretion to slow, and the wide-separation merger may no longer be observationally identified as an AGN. Indeed, the fraction of AGN is seen to fall dramatically at large projected separations (e.g., Ellison et al. 2013; Satyapal et al. 2014a; Ricci et al. 2017). However, new episodes of significant AGN activity may then be reignited on subsequent passages until coalescence of the galaxies. In such a scenario, the AGN activity would seemingly occur sporadically throughout the merger, but with the overall AGN light curve being strongly correlated with the merger’s dynamical time.
Within our proposed framework, during the merger there may be multiple periods of observable AGN activity, and seemingly non-AGN activity. Including a close connection with the dynamical time forces the non-AGN phases to last substantially longer during first and second passage, but with the non-active phases become shorter-lived as the galaxies begin to coalesce. In accordance with the results of previous investigations, comparisons of the merger rates of AGN to merger rates in non-AGN should produce similar fractions, as the AGN is not always “active” during the entire merger event. As the merger begins to reach coalescence, the probability of observing the AGN increases dramatically as the AGN episodes occur more frequently, and may result in the maximal growth phase of the BH, as predicted in merger simulations. Such a scenario would simultaneously explain the apparent increase in merger rate with AGN luminosity (e.g., Urrutia et al. 2008; Glikman et al. 2012; Treister et al. 2012), and our finding of the most luminous AGN preferentially residing within merging systems.
In figure 11, we show that ≲ 10% of major mergers contain luminous (obscured mid-IR) AGN, suggesting that the total AGN duty cycle over the course of the merger may only be ∼50–100 Myr. Moreover, in figure 11, we show that luminous AGN activity still occurs during isolated, secular evolution phases (i.e., a major merger may not be an absolute requirement for luminous AGN activity to occur). Taken together, these two results suggest that merger-AGN studies primarily selected on the basis of AGN activity would need to be large in number in order to observe the relatively small ∼10% enhancement in mergers relative to non-mergers in an AGN-selected sample (e.g., Villforth et al. 2014). However, we show that when considering a time-averaged look at the AGN duty cycle, the probability of luminous AGN occurring in major mergers is clearly enhanced over non-interacting galaxies by at least a factor of ∼3.
Overall, our results suggest that, on average, mergers do trigger AGN significantly more often than in secularly evolving galaxies above a particular luminosity threshold (LAGN ≳ 1044 erg s−1), but that the BH does not necessarily need to be growing at a significant rate throughout the entire merger phase. However, given that we have focused on the growth of obscured AGN only, we have implictly not considered a possible evolutionary scenario between Type-2 and Type-1, which may also be linked with merger stage. Of the studies that have previously found a connection between galaxy mergers and AGN, several focused on obscured AGN samples. Perhaps soft-energy-X-ray-selected AGN samples, selected from surveys covering wide ranges in sensitivity, do not typically probe the full distribution of obscuring column densities, and hence, may miss the most heavily obscured AGN population. Indeed, studies based on deep and/or high-energy X-ray data (e.g., Koss et al. 2011, Kocevski et al. 2015) or those selected from near-IR and radio surveys (Glikman et al. 2015) do uncover some connection between mergers and AGN activity. Understanding an additional effect with obscured versus unobscured AGN is beyond the scope of this investigation, but may be possible with future wide-format high-resolution imaging capable of identifying Type-1 AGN, while also providing the ability to extract galaxy properties such as morphology. Finally, at lower BH masses and/or lower AGN luminosities, secular processes may be more important for driving BH growth, with major mergers becoming subdominant. Indeed, an enhancement in AGN fraction of only a factor of ∼0.5–2 is seen in Seyfert-like-luminosity z < 0.1 galaxy pairs in SDSS (e.g., Ellison et al. 2011a).
7 Summary and conclusions
In this paper, we have investigated the effect of the merging of gas-rich galaxies on the growth of BHs out to z ≲ 1. We have used the exquisite imaging quality afforded to us by the HSC instrument on the Subaru Telescope to identify merging and non-interacting galaxies across the first 170 deg2 of the HSC survey. We used publicly available archival data within the HSC survey regions to identify spectroscopically confirmed galaxies in the redshift range 0.1 < z < 0.9 (see subsection 2.3), and performed SED fitting (see subsection 3.1) to derive their internal properties. We used photometry from the all-sky WISE mid-IR survey to identify the galaxies in our sample containing luminous AGN (see subsection 3.3), and used the sensitive and high spatial resolution HSC imaging to implement a random forest machine-learning algorithm to robustly identify large samples of merging and non-interacting galaxies (see subsection 4.2). We used our morphological classifications in conjunction with the mid-IR AGN identifications to place constraints on the average incidence of luminous AGN in merging versus non-interacting galaxies. Our conclusions are the following:
Based on stellar-mass-matched samples of galaxies, BHs hosted in merging galaxies are a factor ∼2–7 more likely to be rapidly growing than in non-interacting galaxies. This result is found to be consistent in three separate redshift bins (0.1 < z < 0.3; 0.3 < z < 0.6; 0.6 < z < 0.9), and is relatively independent of stellar mass.
Our parent sample of galaxies is drawn heterogeneously based on spectroscopic redshift confirmations from a variety of dedicated surveys. We investigated the likelihood of our AGN fractions being driven by the source selection induced by any one of these spectroscopic surveys by systematically removing each individual redshift survey from our parent sample and recomputing the AGN fractions as a function of morphology. We determined that our results are not driven by spectroscopic selection, finding fully consistent AGN fractions throughout.
Several previous studies have suggested a strong link between galaxy merging and the most luminous AGN. We tested this result by assessing whether the most bolometrically luminous AGN are systematically hosted in merging galaxies over non-interacting systems. At any given stellar mass bin, we found that the upper quartile of the most luminous AGN preferentially reside in merging galaxies over non-interacting galaxies. We use these results to suggest that a major merger between two galaxies is sufficient to induce a flow of cool gas towards the central BH in one or both galaxies, and this is systematically more likely to trigger a significant AGN event than in an isolated galaxy alone.
To place our findings into the wider context of AGN–galaxy co-evolution, and reconcile our conclusions with seemingly contradictory results within the recent literature, we outline a coherent framework that closely ties the variable AGN light curve to the dynamical time of the merger event. Our proposed framework requires that AGN accretion undergoes several distinct peaks in luminosity over the lifetime of the merger, with BH fueling linked to the close passage and interaction of the merging galaxies. The substantial time spent at wide pair separations, when the BH is not growing at an appreciable rate, serves to explain previous findings that highlight similarities between the fractions of AGN and non-AGN in merger states.
Overall, our morphological investigation of 0.1 < z < 0.9 galaxies identified in the first 170 deg2 of the HSC survey provides conclusive evidence that luminous AGN are systematically more likely (by at least a factor ≳ 3) to occur in major mergers when compared to non-interacting galaxies. Our results suggest that, on average, mergers do trigger AGN significantly more often than in secularly evolving galaxies. However, the BH need not be growing at an appreciable rate throughout the entire merger phase.
Acknowledgements
We thank the anonymous referee for their considered report, which allowed us to clarify and improve several aspects of this manuscript. ADG and JEG gratefully acknowledge support from the National Science Foundation under Grant Number AST-1613744. YM was supported by JSPS KAKENHI Grant No. JP17H04830. The authors thank Lisa Kewley, Robert Lupton, Jim Bosch, and Bob Armstrong for enlightening conversations. This publication makes use of data products from the Wide-field Infrared Survey Explorer, which is a joint project of the University of California, Los Angeles, and the Jet Propulsion Laboratory/California Institute of Technology, funded by the National Aeronautics and Space Administration. The Hyper Suprime-Cam (HSC) collaboration includes the astronomical communities of Japan and Taiwan, and Princeton University. The HSC instrumentation and software were developed by the National Astronomical Observatory of Japan (NAOJ), the Kavli Institute for the Physics and Mathematics of the Universe (Kavli IPMU), the University of Tokyo, the High Energy Accelerator Research Organization (KEK), the Academia Sinica Institute for Astronomy and Astrophysics in Taiwan (ASIAA), and Princeton University. Funding was contributed by the FIRST program from the Japanese Cabinet Office, the Ministry of Education, Culture, Sports, Science and Technology (MEXT), the Japan Society for the Promotion of Science (JSPS), the Japan Science and Technology Agency (JST), the Toray Science Foundation, NAOJ, Kavli IPMU, KEK, ASIAA, and Princeton University.
Footnotes
We do not make use of the HSC Bright Star Masks. Due to the substantially poorer PSF in WISE, galaxies with HSC photometry that are contaminated by foreground stars are typically not identified in WISE, and hence are excluded during our HSC–WISE cross-match outlined in subsection 3.3. Furthermore, the inclusion of the HSC Bright Star Mask would potentially mask bright/large galaxies, which would bias our sample against the most massive merging systems.
We note that the optical color selection imposed as part of the BOSS survey, in order to select a galaxy for spectroscopic targeting, was designed to identify massive, passively evolving systems. In subsection 3.3, we find that <4% of AGN in our sample are hosted by quiescent systems. As these passively evolving galaxies do not appear to be contributing significantly to the overall growth of BHs, we choose to remove these particular objects from our spec-z sample. Removing the quiescent BOSS objects mitigates this strong selection bias within the redshift range 0.4 < z < 0.6, and we defer the investigation of “dry mergers” to future studies.
At the present time, galaxies observed to have i ∼ 20.5 in SDSS are subject to significant shredding (∼20% of disk galaxies) and deblending issues in HSC, as well as having over-subtracted backgrounds in the HSC imaging (Aihara et al. 2018b; Bosch et al. 2018). Presently, for bright disk galaxies with i < 19 mag, only ∼20% show good photometric agreement between SDSS and HSC in the i band (at the ±0.05 mag level), with ∼55% having over-estimated photometry in HSC in the range 0.1–0.7 mag. Furthermore, at i < 18 mag, HSC imaging is often subject to saturation towards galaxy centers and at the positions of bright star clusters, which necessitates the use of the SDSS photometric measurements.
AGN continuum emission in Type-1 systems will also contribute to the photometry at rest-frame λ ≲ 4000 Å resulting in poorly determined galaxy properties during the SED fitting process. However, we robustly identify and remove Type-1 AGN from our sample in subsection 3.3.
For our visually classified training sample we split the galaxies determined to be “(3) evidence for interactions with a companion” by the flux ratio of the two interacting systems. In accordance with previous studies, we used a demarcation of 1 : 4 in flux ratio to denote major and minor mergers. Interacting galaxies with “(2) double-nuclei/late-stage mergers” were additionally considered major mergers, while irregular morphologies were considered to be minor mergers.
We note that sources with the interaction classification of “I: first approach” would be considered as “non-interacting” in our visual classifications as the galaxy disks have not yet been perturbed.
For consistency, we combine all galaxies within a redshift bin (i.e., independent of interaction state), and compute a single correction function. However, we note that calculating completeness corrections that are interaction-state specific and applying these to our AGN fractions presented in figure 11 has no overall effect on our conclusions. This is fully expected given that the normalized two-dimensional distributions in M*–WISE-color space are similar between the morphological samples in a given redshift bin.
The significantly lower numbers of sources at a given redshift caused by removing a particular redshift survey were not sufficient to allow a statistically significant separation into multiple bins of stellar mass.
Our choice of selecting the upper 25% of the AGN luminosities is somewhat arbitrary. However, this ensures that we remove the majority of AGN with LAGN > 1045 erg s−1, which is consistent with the upturn in the merger fraction as a function of LAGN (e.g., Fan et al. 2016 and references therein).
References
