


Abstract
We construct a sample of X-ray-bright optically faint active galactic nuclei by combining Subaru Hyper Suprime-Cam, XMM-Newton, and infrared source catalogs. Fifty-three X-ray sources satisfying i-band magnitude fainter than 23.5 mag and X-ray counts with the EPIC-PN detector larger than 70 are selected from 9.1 deg2, and their spectral energy distributions (SEDs) and X-ray spectra are analyzed. Forty-four objects with an X-ray to i-band flux ratio FX/Fi > 10 are classified as extreme X-ray-to-optical flux sources. Spectral energy distributions of 48 among 53 are represented by templates of type 2 AGNs or star-forming galaxies and show the optical signature of stellar emission from host galaxies in the source rest frame. Infrared/optical SEDs indicate a significant contribution of emission from dust to the infrared fluxes, and that the central AGN is dust obscured. The photometric redshifts determined from the SEDs are in the range of 0.6–2.5. The X-ray spectra are fitted by an absorbed power-law model, and the intrinsic absorption column densities are modest (best-fit log NH = 20.5–23.5 cm−2 in most cases). The absorption-corrected X-ray luminosities are in the range of 6 × 1042–2 × 1045 erg s−1. Twenty objects are classified as type 2 quasars based on X-ray luminsosity and NH. The optical faintness is explained by a combination of redshifts (mostly z > 1.0), strong dust extinction, and in part a large ratio of dust/gas.
1 Introduction
Supermassive black holes (SMBHs) lurking in the nuclei of galaxies have grown through mass accretion and merging; they are observed as active galactic nuclei (AGNs,) and the peaks of their number densities are at redshift z ∼ 2 for quasars and 0.7–0.8 for Seyferts (Ueda et al. 2003, 2014; Hasinger et al. 2005). The redshifts around these peaks are a key epoch in understanding the evolution of SMBHs. In order to sample whole populations of SMBHs in this epoch, it is mandatory to perform multiwavelength surveys to avoid selection biases as much as possible. In particular, obscured AGNs, which are believed to constitute a large fraction of AGNs and a key stage of AGN evolution, are biased against conventional surveys using the UV and optical bands.
Modern surveys combining optical, infrared, and X-rays have indeed revealed the presence of various classes of AGN that could be missed in conventional optical surveys. Extragalactic X-ray surveys have shown the presence of optically faint populations with X-ray (2–10 keV) to optical (R band) ratios FX/FR > 10, which are more than one order of magnitude fainter in the optical compared to ordinary AGN populations (e.g., Brandt & Hasinger 2005). Fiore et al. (2003) pointed out that 20% of X-ray sources found in Chandra or XMM-Newton surveys are FX/FR > 10. Such an X-ray-bright but optically faint population is of great importance in understanding the nature and evolution of AGNs. The optical faintness could be caused by significant dust extinction, the 4000 Å/Balmer break or Lyman break shifted to infrared bands, or a combination of both (e.g., Hornschemeier et al. 2001; Rigby et al. 2005). The population with a significant amount of dust might be AGNs with the ongoing growth embedded in a large amount of gas and dust (e.g., Hopkins et al. 2008). If the 4000 Å/Balmer break is shifted to the infrared band, redshifts are inferred to be greater than unity, which coincides with the peak of the number density of luminous Seyfert galaxies and quasars.
X-ray-bright optically faint AGNs have been found and studied in various X-ray surveys. Brand et al. (2006) studied X-ray and optical properties of 773 Chandra X-ray sources with FX/FR > 10 in the XBoötes field of 9.3 deg2, and found that they have redder color in the optical and harder X-ray spectra than those of the X-ray source population with 0.1 < FX/FR < 10, where the X-ray flux is measured in the 0.5–7 keV band. This result implies that the optically faint sources are obscured AGNs, although detailed studies of individual X-ray spectra are not possible for most objects because of the shallow Chandra pointings of 5 ks exposure.
Rigby et al. (2005) compiled 20 X-ray sources with FX/FR > 10 in part of the Chandra Deep Field South, and showed that most of them (17/20) indicate an apparently flat X-ray slope (Γ < 1.4). Civano, Comastri, and Brusa (2005) presented results of analysis of stacked X-ray spectra of high X-ray/optical ratio sources in the Chandra Deep Fields North and South, and found a very flat slope with a photon index of ∼1.0, independent of source flux. Individual spectral fits of the brightest objects imply absorption column densities of 1022–1023.5 cm−2. Rovilos et al. (2010) analyzed X-ray spectra of optically faint sources and found that the majority (27/35) are absorbed by NH > 1022 cm−2. Three among them are candidates for Compton-thick AGNs. The stacked spectrum of the 35 sources is flat, with a photon index of ≈0.9.
Perola et al. (2004) analyzed X-ray spectra of 24 objects with FX/FR > 10 found in the HELLAS2XMM survey covering 1 deg2 with a flux limit of FX ≈ 10−14 erg s−1 cm−2 in 2–10 keV. Seventeen among them were absorbed by a hydrogen column density of NH = 1022–6 × 1023 cm−2, while the NH for the rest were less than 1022 cm−2. They also found that the fraction of highly absorbed sources becomes greater for larger FX/FR sources. Tajer et al. (2007) found that 20% of 124 X-ray sources with measured NH in the XMM-Newton Medium Deep Survey (XMDS), which covers 1 deg2 with a flux limit of FX ≈ 10−14 erg s−1 cm−2, have FX/FR > 10. Twenty-one among 25 objects with FX/FR > 10 are classified as type 2 quasars (NH > 1022 cm−2 and X-ray luminosity in 2–10 keV LX > 1044 erg s−1).
Della Ceca et al. (2015) utilized the second XMM-Newton serendipitous source catalogue and optical imaging data to find seven extreme optical to X-ray ratio objects (FX/FR > 50) with an X-ray flux greater than 1.5 × 10⁻¹³ erg cm−2 s−1. Three and two of the seven sources were classified as type 2 quasar and BL Lac objects, respectively. The rest were unidentified, but indicated an obscured quasar nature. The X-ray spectra of the three identified type 2 quasars were represented by a power law absorbed by Compton-thin matter. Thus, previous observations of optically faint AGNs suggest that most of them are absorbed AGN, while less absorbed AGNs are also present.
Optical to infrared spectral energy distributions of X-ray-bright optically faint sources tend to be very red (Rigby et al. 2005). R − K or V606 − Ks colors of the majority of them are extremely red (>5) (Rovilos et al. 2010; Brusa et al. 2010). Optically faint sources also tend to be bright in the mid-infrared relative to the optical bands if detected in the mid-infrared band. The 24 μm to R-band flux ratios (F24/FR) of some sources exceed 1000 (Lanzuisi et al. 2009; Brusa et al. 2010; Della Ceca et al. 2015), which is a criterion for dust-obscured galaxies (Dey et al. 2008). Among 43 objects with F24/FR > 2000 in the sample of Lanzuisi et al. (2009), at least 23 were X-ray bright and optically faint, for example. Thus, strong infrared emission relative to the optical is also a property of this population and implies an important role of dust obscuration, at least in objects with infrared detections.
In this paper, we report a new sample of X-ray-bright optically faint AGNs selected by combining Subaru Hyper Suprime-Cam (HSC: Miyazaki et al. 2012) Subaru Strategic Program (SSP: Aihara et al. 2018a, 2018b), XMM-Newton, and infrared surveys (Spitzer and UKIRT Infrared Deep Survey), and discuss their nature. The large area and survey depth of HSC enable us to construct a large sample of rare populations and to constrain the spectral energy distributions (SEDs) of optically faint sources. This paper is organized as follows. Section 2 describes the data sets. Section 3 explains the procedure of sample selection. Sections 4 and 5 provide the results of analysis of SEDs in the optical and infrared bands, and X-ray spectra, respectively. Discussions about the nature of the sample are given in section 6. Section 7 summarizes our findings. We adopt cosmological parameters of H0 = 70 km s−1 Mpc−1, ΩM = 0.3, and |$\Omega _\Lambda =0.7$|. All magnitudes refer to the AB system.
2 The data
2.1 X-ray
The XMM-Newton Large Scale Structure Survey (LSS: Pierre et al. 2004) and its extension (the Ultimate XMM-Newton survey, XXL; Pierre et al. 2016) are X-ray surveys covering large consecutive fields (25 deg2 in the northern field), which enable us to study large-scale structures and to find rare X-ray-emitting populations. We use a part of the XXL northern field covered by HSC and the Spitzer space telescope. The catalogs used in our analysis are summarized in table 1. The XMM serendipitous source catalogue data release 6 (3XMM-DR6: Rosen et al. 2016) is used as an X-ray source catalog. The 3XMM-DR6 catalog utilizes XMM-Newton observations performed by 2015 June 4, and contains some pointed observations in the XXL region with a longer exposure time than those of the original survey. Thus we fully utilize X-ray sources detected in such additional pointings. Since our aims are to select X-ray-bright optically faint sources and understand their nature, we use objects with X-ray counts obtained with the EPIC-PN detector in 0.2–12 keV listed in the 3XMM-DR6 catalogue greater than 70 so that X-ray spectral fits can be performed. This count limit roughly corresponds to an X-ray flux of ∼10−14 erg s−1 cm−2 in the 2–10 keV band, though conversion to an X-ray flux depends on exposure time and assumed X-ray spectra. If an X-ray source is observed more than twice, the observation giving the largest X-ray counts is used.
Data.
| Observatory | Instrument | Survey | Band |
|---|---|---|---|
| XMM-Newton | EPIC-PN, MOS | 3XMM-DR6 | 0.2–12 keV |
| Subaru | Hyper Suprime-Cam | SSP-Wide S15B | g, r, i, z, y |
| UKIRT | WFCAM | DXS DR10plus | J, K |
| WFCAM | UDS DR10plus | J, H, K | |
| Spitzer | IRAC | SWIRE | 3.6, 4.5, 5.8, 8.0 μm |
| MIPS | SWIRE | 24 μm |
We retrieved Observation Data Files (ODF) from XMM-Newton for all the candidates for optically faint population selected in section 3. The ODF were reprocessed using the XMM-Newton Science Analysis Software (SAS) version 14.0.0 and Current Calibration Files (CCF) as of 2015 October 20. We made light curves of whole field of view in 10–12 keV, excluding bright X-ray sources to examine the stability of the background, where only PATTERN 0 events were used. We excluded time intervals with high background rates. Then we made X-ray images in the 0.5–2, 2–10, and 0.5–10 keV bands, and examined the brightness of candidate X-ray sources selected by matching X-ray, 3.6 μm, and i bands as described in subsection 3.3. In some cases, no X-ray source is clearly visible in the images; these cases are excluded from our sample. If the X-ray source counts after the data screening become smaller than 70 counts per EPIC-PN, they are also excluded.
2.2 Subaru HSC
We use the optical imaging survey performed with HSC. The XMM-XXL region is covered by the wide layer of the HSC survey in the ongoing SSP. The wide layer of the HSC survey conducts imaging with the five bands (g, r, i, z, and y), for which the limiting magnitudes (5 σ) are 26.8, 26.4, 26.4, 25.5, and 24.7, respectively. The source catalogs selected in the i band and images taken from data release S15B are used in the following analysis. All the magnitudes are corrected for Galactic extinction according to Schlegel, Finkbeiner, and Davis (1998). Cmodel magnitudes are used in all the analysis unless otherwise noted.
Among the five filter bands, we use i-band data for our sample selection for the following reasons. Most previous studies of X-ray-bright optically faint populations utilized the R band. By using the i band centered at a longer wavelength, we expect to detect objects with a higher redshift if the cause of the optical faintness is the 4000 Å/Balmer break or Lyman break. Secondly, the limiting magnitude is the best among the three bands (i, z, and y) redder than the R band. Thirdly, the i-band data are taken under good seeing conditions with a point source FWHM < 0|${^{\prime\prime}_{.}}$|7, which enables us to better quantify extendedness. After performing sample selection using the i band, data of all five bands are used to study SEDs and photometric redshifts.
2.3 Infrared
Infrared data are useful to better identify more likely counterparts of X-ray sources as used in multiwavelength surveys (e.g., Brusa et al. 2007; Civano et al. 2012; Akiyama et al. 2015; Marchesi et al. 2016). Part of the XMM-XXL region is observed by the Spitzer Infrared Array Camera (IRAC) and Multiband Imaging Photometer (MIPS). We required that the X-ray and HSC sources are in the area covered by the Spitzer IRAC 3.6 μm band public catalog of the Spitzer Wide-Area Infrared Extragalactic Survey (SWIRE: Lonsdale et al. 2003, 2004).1 This requirement determines the area used in this study (9.1 deg2). This sky region is fully covered by 3XMM-DR6 and HSC, and partly overlaps with the Subaru/XMM-Newton Deep Survey (SXDS: Akiyama et al. 2015; Ueda et al. 2008) or XMM-Newton Medium Deep Survey (XMDS: Chiappetti et al. 2005; Tajer et al. 2007). Nearly the same region is also covered by the 4.5, 5.8, 8.0 μm IRAC bands and 24 μm MIPS band. These multiband data are also used if available. We used aperture photometry with a radius of 1|${^{\prime\prime}_{.}}$|9 after aperture corrections. The limiting fluxes (5 σ) for the five bands are 7.3, 9.7, 27.5, 32.5, and 450 μJy.
Near-infrared photometric data obtained in the UKIRT Infrared Deep Sky Survey (UKIDSS: Lawrence et al. 2007) are also used to better constrain the spectral energy distributions and photometric redshifts, if available. The photometric catalog of the UKIDSS data release 10 plus for the two survey layers, Deep Extragalactic Survey (DXS) and Ultra Deep Survey (UDS), are used in our analysis. Photometric data in the J and K bands are available for the former, and the latter is covered by the J, H, and K bands. The limiting magnitudes (5 σ) of DXS are 23.2–23.3 (J band) and 21.2–22.8 (K band: Warren et al. 2007), while those of UDS are 25.7, 25.2, and 24.8 for the J, H, and K bands, respectively. All the UKIDSS photometric data are corrected for Galactic extinction (Schlegel et al. 1998).
3 Selection
3.1 Candidates for X-ray-bright optically faint sources
Candidates for X-ray-bright optically faint sources were selected by matching X-ray and i-band sources. In the following procedure, i-band sources after deblending (deblend_nchild = 0) were used. First, we selected all the i-band sources within 4″ of the positions of the X-ray sources; 96.5% of the X-ray sources in XMM-XXL with EPIC-PN counts >70 in 0.2–12 keV have a positional uncertainty smaller than 4″. Then we examined the detection flags for the selected i-band sources, and required that all the sources within 4″ of an X-ray source are “cleanly” detected in the i band. We used the following criteria for “clean” detection, as used in Toba et al. (2015):
(1) flags_pixed_edge = not True,
(2) flags_pixel_saturated_center = not True,
(3) flags_pixel_cr_center = not True,
(4) flags_pixel_bad = not True,
(5) flags_cmodel_flux_flags = not True,
(6) centroid_sdss_flags = not True,
(7) detect_is_tract_inner = True,
(8) detect_is_patch_inner = True.
Details of the detection flags are given in Aihara et al. (2018b).
At the limiting magnitude of the HSC survey, there are a non-negligible number of nearby i-band sources unrelated to an X-ray source, and a simple selection of the source nearest to an X-ray source could result in wrong identifications. For the X-ray sample matched with 3.6 μm sources constructed in subsection 3.2, 32% of X-ray sources have two or more i-band sources within 4″ of the X-ray source position. We use infrared data to better identify the most probable i-band counterpart to an X-ray source, as described in the next subsection.
3.2 Matching X-ray and infrared sources
In order to find the most probable i-band counterparts to X-ray sources, we use infrared data for the following reasons. In the optical/infrared identifications of X-ray-selected sources using quantitative criteria (likelihood ratios and reliabilities), near-infrared (K or 3.6 μm) sources are more likely to be associated with X-ray sources compared to selections using likelihood ratios simply calculated in the optical (Brusa et al. 2007; Akiyama et al. 2015). Our main targets, X-ray-bright optically faint sources, could be partly missed if likelihood ratios in the optical are used, since the likelihood selection tends to choose a bright optical source (e.g., Brusa et al. 2007). Secondly, previous X-ray surveys show that objects with a large X-ray/optical ratio tend to have red infrared/optical colors (Mignoli et al. 2004; Brusa et al. 2010). Thirdly, positional uncertainties of Spitzer 3.6 μm sources are much smaller than those for X-rays, and identification processes between i band and 3.6 μm are easier than directly matching X-ray and i-band sources.
We utilize a catalog of 3.6 μm sources to first identify infrared counterparts to X-ray sources, and then match infrared and i-band sources. The 3.6 μm band is used because of its best point spread function and sensitivity among the Spitzer IRAC (3.6, 4.5, 5.8, 8.0 μm) and MIPS (24 μm) bands in the SWIRE survey. Figure 1 shows a histogram of the distances between X-ray sources and their nearest 3.6 μm source. The distances are smaller than 4″ for 95% of the X-ray sources. This distribution is almost identical to that of X-ray positional errors, indicating the positional uncertainties are dominated by X-ray positional error. We regard the infrared sources nearest to X-ray sources as infrared counterparts to X-ray sources if the separation is smaller than 4″. There are 432 pairs of X-ray and 3.6 μm sources after this matching process. The expected number of unrelated 3.6 μm sources located within 4″ of an X-ray source position is 0.12. The separations between the 3.6 μm and X-ray positions of 49 of the final sample consisting of 53 objects (subsection 3.3) are less than 2″. The expected number of chance coincidences of an infrared source within 2″ of an X-ray source position is 0.03.
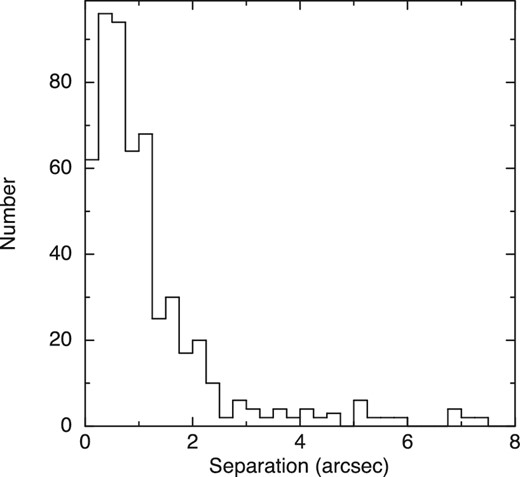
Distribution of separation between X-ray and the nearest 3.6 μm sources.
3.3 Matching 3.6 μm and i-band sources
The i-band sources nearest to the 3.6 μm sources selected in subsection 3.2 are regarded as the counterparts of the pairs of X-ray and 3.6 μm sources. If the i-band magnitude of a selected source is brighter than 23.5, they are excluded from our sample. Seventy-seven objects are selected after this screening. We examined their X-ray images and found that 24 of the 77 objects are not clearly visible in X-ray images, or their X-ray counts are smaller than 70 after data screening. After excluding these sources, 53 X-ray sources with 3.6 μm and i-band counterparts are selected as the final sample.
Examples of i-band and 3.6 μm images are shown in figure 2. There is only one i-band and 3.6 μm source near the X-ray position of 3XMM J021614.5−050351. In the i-band image around 3XMM J022421.1−040355, there are three i-band sources at a similar distance from the X-ray source, but there is one bright source in 3.6 μm. The i-band source nearest to this 3.6 μm source is regarded as the true counterpart.
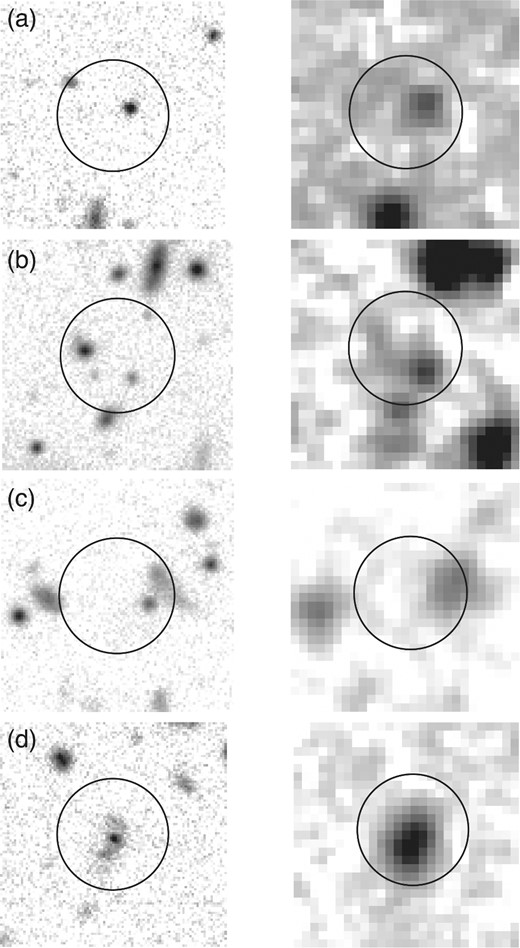
Examples of i-band (left) and 3.6 μm (right) images. Image size is 8″ × 8″. North is up and east is to the left. The position of the X-ray source is at the center of each panel. The circle of 4″ radius from the X-ray position is shown. (a) J021614.5−050351. (b) J022421.1−040355. (c) J021825.6−045945. (d) J022504.5−043706.
In three cases (3XMM J021744.1−034531, 3XMM J021825.6−045945, and 3XMM J022504.5− 043706), there are two i-band sources at similar distances from an infrared source, i.e., the difference of the separations is less than 0|${^{\prime\prime}_{.}}$|5. We examined their i-band images and found that an infrared peak is located in the middle of two i-band sources. We tentatively assign the i-band source nearest to the 3.6 μm source as a counterpart. Note that such an infrared source might be a combination of emissions from the two i-band sources, or from an interface between two i-band sources (e.g., interacting galaxies). Figure 2 shows i-band and 3.6 μm images of the latter two objects as examples. The full set of i-band and 3.6 μm images is presented in the Appendix of the electronic version of this paper.
3.4 Matching 3.6 μm and J-, H-, K-band sources
In order to better constrain the spectral energy distributions (SEDs), near-infrared catalogs obtained in the UKIDSS are matched with our sample. We selected the K-band sources nearest to the positions of 3.6 μm sources as counterparts, and then J band (and H band when available) photometry for the same sources was compiled. Among the 53 sources in our sample, 24 and 15 objects are detected in at least one near-infrared band in the DXS and UDS fields, respectively, in the UKIDSS.
4 Spectral energy distribution and photometric redshift
Using the results of multiwavelength matching described in the previous section, we constructed SEDs in the optical and infrared bands for our sample. We performed SED fits using templates of various types of galaxies and obtained photometric redshifts. The HYPERZ code (Bolzonella et al. 2000) was used to perform chi-square minimization fits. We used the templates compiled by Polletta et al. (2007). The templates are categorized into three broad classes: type 1 AGN (AGN1), type 2 AGN (AGN2), and star-forming galaxy (SF). The AGN1 class contains the three templates BQSO1, QSO1, TQSO1, which are templates of type 1 quasars with different values for the infrared/optical ratio. Their infrared/optical ratios become large in this order. There are nine templates in the AGN2 class: IRAS 19254−7245 South (I19254), IRAS 20551−4250 (I20551), IRAS 22491−1808 (I22491), heavily absorbed broad absorption line quasar (Mrk 231), NGC 6240 (N6240), type 2 quasar (QSO2), Seyfert 1.8 (Sey18), Seyfert 2 (Sey2), and Torus. The three IRAS galaxies (I19254, I20551, I22491), Mrk 231, and NGC 6240 among them contain a powerful starburst component in addition to AGN. Templates of seven normal spiral/lenticular galaxies (S0, Sa, Sb, Sc, Sd, Sdm, Spi4) and three starburst templates Arp 220, M82, and NGC 6090 (N6090) are in the SF class. Templates of elliptical galaxies were also examined. In order to represent the difference of extinction among objects in our sample and these templates, additional extinction up to AV = 2.0 was allowed in the fits unless otherwise noted, and the reddening law of Calzetti et al. (2000) was assumed.
All the available bands were first used in the fits. Our template fits provided good descriptions of the overall SED for 34 of the 53 objects. The results of these fits are summarized in table 2. We inspected the fitting results and found that in the rest of the cases (19 objects) the model giving a χ2 minimum does not adequately describe the data, particularly around a spectral break seen in 8000–11000 Å in the observed frame. In order to fit such structures, we first fitted their SEDs using K and shorter bands to better constrain their photometric redshift using the spectral break for objects with available K-band photometry. The optical to near-infrared (NIR) SEDs up to K band for nine objects are described by these fits. The model SEDs underpredict infrared excess in the Spitzer bands except for one object (J021410.3−040224), indicating the presence of strong emission from dust in addition to the component described by the template. The SED of J022410.3.0−040224 is described by the TQSO1 template up to the K band if extinction of AV = 2.3 is allowed. This model slightly overpredicts infrared fluxes at 4.5 and 5.8 μm by 0.2 dex. The fit results using SED up to K band are shown in table 2, where objects showing infrared excess are denoted as “template name + IR.”
Results of SED fits.
| 3XMM name | z phot | AV | SED* | Class† | z spec ‡ | Class§ | Note|$^\#$| |
|---|---|---|---|---|---|---|---|
| J021502.3−034111 | 1.957 | 0.00 | Sd | SF | — | — | — |
| J021529.4−034233 | 1.262 | 0.50 | I20551 | AGN2 | — | — | a |
| J021532.3−035124 | 2.099 | 1.10 | QSO1 | AGN1 | — | — | — |
| J021541.0−034505 | 1.460 | 0.10 | M82 | SF | — | — | — |
| J021606.6−050303 | 1.392 | 1.10 | I20551 | AGN2 | 0.471 | NLA | — |
| J021614.5−050351 | 2.048 | 0.80 | Mrk231 | AGN2 | 1.651 | BLA | — |
| J021625.7−050518 | 1.746 | 0.60 | I20551 | AGN2 | 1.873 | NLA | — |
| J021634.3−050724 | 1.136 | 0.50 | Sey2 | AGN2 | — | — | a, b |
| J021642.3−043552 | 1.722 | 1.00 | Mrk231 | AGN2 | — | — | — |
| J021644.6−040651 | 1.085 | 0.10 | Mrk231 | AGN2 | — | — | a |
| J021705.4−045655 | 1.112 | 1.00 | Mrk231 | AGN2 | — | — | — |
| J021705.7−052546 | 1.457 | 0.10 | Sdm+IR | SF | — | — | b |
| J021721.2−052336 | 2.485 | 1.30 | BQSO1 | AGN1 | 1.382 | BLA | — |
| J021721.9−043655 | 1.035 | 1.20 | Torus | AGN2 | — | — | a |
| J021725.8−051955 | 1.059 | 2.00 | QSO2 | AGN2 | — | — | — |
| J021729.3−052122 | 2.037 | 0.10 | I19254 | AGN2 | — | — | — |
| J021736.4−050106 | 1.169 | 0.00 | N6090+IR | SF | 1.423 | BLA | b |
| J021744.1−034531 | 1.112 | 1.20 | Mrk231 | AGN2 | — | — | — |
| J021810.1−051844 | 2.066 | 0.70 | Sey18 | AGN2 | 2.523 | NLA | — |
| J021813.2−045051 | 0.649 | 1.80 | QSO2 | AGN2 | — | — | — |
| J021825.6−045945 | 1.478 | 0.40 | Mrk231 | AGN2 | — | — | — |
| J021842.8−051934 | 2.119 | 0.80 | Sdm+IR | SF | — | — | b |
| J021914.8−045139 | 1.721 | 0.70 | I20551 | AGN2 | 1.626 | BLA | — |
| J022015.5−045654 | 1.957 | 1.20 | Sdm | SF | — | — | — |
| J022129.0−035359 | 1.366 | 1.20 | I20551 | AGN2 | — | — | — |
| J022145.5−034346 | 2.464 | 0.40 | I20551 | AGN2 | — | — | — |
| J022154.7−032558 | 2.420 | 0.50 | Mrk231 | AGN2 | — | — | — |
| J022205.0−033238 | 1.478 | 0.10 | Mrk231 | AGN2 | — | — | a |
| J022214.4−034619 | 1.114 | 0.70 | I19254 | AGN2 | — | — | — |
| J022231.7−044910 | 2.081 | 1.40 | TQSO1 | AGN1 | — | — | — |
| J022314.5−041017 | 1.751 | 0.10 | Sey2 | AGN2 | — | — | — |
| J022326.5−041837 | 0.650 | 1.70 | QSO2 | AGN2 | — | — | — |
| J022330.8−044632 | 1.690 | 0.10 | Mrk231 | AGN2 | — | — | — |
| J022331.0−044234 | 2.406 | 1.10 | Mrk231 | AGN2 | — | — | c |
| J022334.3−040841 | 1.262 | 1.40 | I20551 | AGN2 | — | — | — |
| J022337.9−040512 | 2.454 | 0.20 | Sd+IR | SF | — | — | b |
| J022343.3−041622 | 1.320 | 0.90 | Mrk231 | AGN2 | — | — | a |
| J022347.1−040051 | 2.710 | 1.50 | BQSO1 | AGN1 | — | — | — |
| J022352.0−052421 | 1.519 | 0.50 | Arp220 | SF | — | — | — |
| J022353.2−041532 | 1.509 | 0.20 | Arp220 | SF | — | — | — |
| J022358.2−050946 | 1.690 | 0.60 | I20551 | AGN2 | — | — | a |
| J022405.2−041612 | 1.684 | 0.10 | Mrk231 | AGN2 | — | — | — |
| J022408.6−041151 | 1.668 | 0.90 | I22491 | AGN2 | — | — | — |
| J022410.3−040224 | 2.095 | 2.30 | TQSO1 | AGN1 | — | — | b |
| J022412.5−035740 | 1.784 | 0.70 | I20551 | AGN2 | — | — | — |
| J022417.4−041812 | 1.644 | 1.20 | I22491+IR | AGN2 | — | — | b |
| J022420.7−041224 | 1.385 | 1.10 | Sey18+IR | AGN2 | — | — | b |
| J022421.1−040355 | 1.462 | 0.00 | M82 | SF | — | — | — |
| J022500.1−050831 | 1.020 | 0.40 | I19254 | AGN2 | — | — | — |
| J022504.5−043706 | 1.130 | 1.80 | QSO2 | AGN2 | — | — | — |
| J022510.6−043549 | 2.030 | 0.80 | I20551+IR | AGN2 | — | — | b |
| J022624.3−041344 | 1.464 | 0.00 | Arp220+IR | SF | — | — | b |
| J022625.2−044648 | 1.734 | 0.10 | Mrk231 | AGN2 | — | — | — |
*Adopted SED template. “+ IR” denotes the existence of infrared excess compared to model in fit without Spitzer data.
†Classification of SED type.
‡Spectroscopic redshift presented in Akiyama et al. (2015).
§Spectroscopic classification in Akiyama et al. (2015). NLA: narrow-line AGN; BLA: broad-line AGN.
#Note. a: Redshift range in fit was restricted to 1 < z < 2. b: Spitzer data was excluded in fit. c: Redshift range in fit was restricted to 2 < z < 3.
For the rest of the objects, the optical–NIR features were not satisfactorily described by the above trials. Six objects are fitted by restricting the redshift range to z = 1–2, in which local minima of χ2 are obtained, using full-band SED. A model giving a local minimum in the redshift range z = 2–3 describes the SED of one object (J022331.0−044234). One object (J021634.3−050724) is fitted by restricting z to 1–2 and using SED up to K band. The overall spectral shape and the break features in two objects are explained by using the template of Mrk 231 (J021744.1−034531 and J022330.8−044632). These results are also summarized in table 2.
The templates used in the SED fits are classified into three classes: AGN1, AGN2, or SF. These classifications are also shown in table 2. The results show that only a very small fraction (5 out of 53) are classified as AGN1, and most of the objects are explained by AGN2 or SF templates. None are represented by templates of early-type galaxies. Figure 3 shows the normalized SEDs in the source rest frame adopting the photometric redshifts determined from the fits. The available data points are connected by a solid line for each source. In figure 3, SEDs are divided into four groups by templates: AGN1, Mrk 231, AGN2 excluding Mrk 231, and SF. The group of Mrk 231 is separately shown for clarity because a large number of objects (13) are fitted by this template. The SEDs of AGN1s in our sample do not show prominent spectral features except for a small bump in one band that might be due to the contribution of emission lines. Therefore, the photometric redshifts for these objects could have large uncertainties. The optical part of their SEDs is relatively red, implying reddening by dust. There is a break feature at around 4000 Å in the SEDs of AGN2 and SF, except for a few objects showing relatively featureless continua. This feature is weak but present in most of the objects in the Mrk 231 group. The photometric redshifts are primarily determined by this feature, in combination with the overall SED shape.
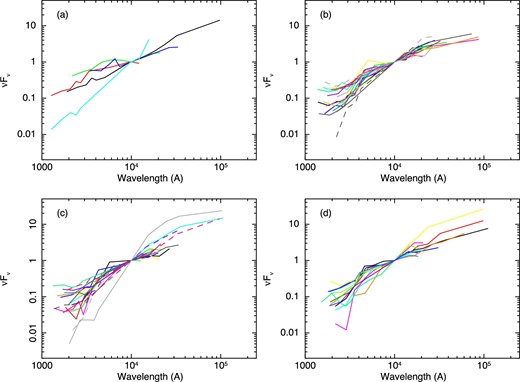
Spectral energy distribution in the source rest frame sorted by the template classes used in the fits. Photometric redshifts determined by SED fits are assumed. Fluxes are normalized at 1 μm. (a) AGN1; (b) Mrk 231; (c) AGN2 excluding Mrk 231; (d) SF. Each of the objects is represented by a different combination of color and line style. (Color online)
Results of spectral analysis of seven objects in our sample are presented in Akiyama et al. (2015), and their measurements of spectroscopic redshifts as well as spectral classifications are also shown in table 2. These spectroscopic redshifts are assumed if available, and the photometric redshifts we derived from the SED fits are used otherwise in the following analysis. The distribution of the redshifts is shown in figure 4. Of the samples, 3 (5%), 38 (72%), and 12 (23%) are located at z < 1, 1–2, and 2–3, respectively.
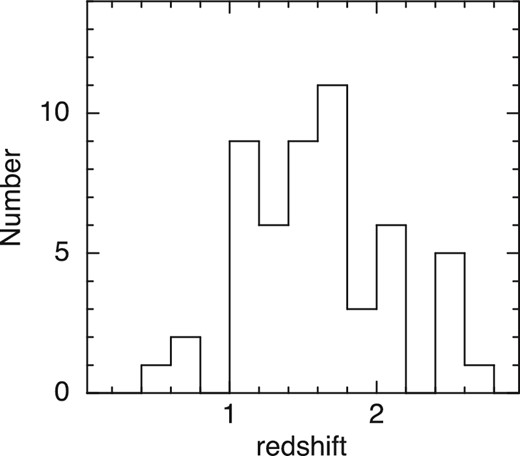
Distribution of redshifts. Spectroscopic redshifts for seven objects and photometric redshifts for the rest are used.
5 X-ray spectra
We made X-ray spectra of the 53 objects in our sample. The observation log is shown in table 3. X-ray spectra were extracted from a circular region with a radius of 200–300 pixels or 10″–15″. The extraction radius was chosen based on the brightness of an X-ray source and to avoid nearby X-ray sources, if any. Background spectra were extracted from an off-source region in the same CCD chip. The high-background regions near the edges of the CCD chips were not used. In some cases, the source position is out of the field of view of one or two sensors, and only available data were used in the analysis. Such cases are shown in the footnotes of table 4. Event PATTERN of ≤12 and ≤4 were used for EPIC-MOS and EPIC-PN spectra, respectively. The total net counts in the 0.5–10 keV band from all the available sensors are shown in table 4. The response matrix files (RMFs) and ancillary response files (ARFs) were created by using rmfgen and arfgen from the SAS package. The X-ray spectra were analyzed using XSPEC version12.9.0n. Since the photon statistics are relatively poor for all the objects, the spectra were binned so that each bin contains at least one count, and fitted by the maximum likelihood method using the C statistic (Cash 1979). The errors represent the 90% confidence interval for one parameter of interest. Galactic absorption was applied to all the models examined below. The Galactic column densities are fixed at the values obtained by the nh tool in HEASOFT6.19 according to the Hi map by Kalberla et al. (2005). The NH values used are tabulated in table 4.
Log of XMM-Newton observations.
| Observation ID | Pointing* | Exposure (ks)† | ||
|---|---|---|---|---|
| EPIC-MOS1 | EPIC-MOS2 | EPIC-PN | ||
| 0037980601 | LSS6 | 13.2 | 13.3 | 7.5 |
| 0109520101 | XMDSOM1 | 25.8 | 25.8 | 19.5 |
| 0109520301 | XMDSOM3 | 21.8 | 21.8 | 16.0 |
| 0109520501 | XMDSOM5 | 24.0 | 24.0 | 17.7 |
| 0111110301 | XMDSSSC3 | 23.1 | 23.2 | 17.1 |
| 0111110401 | XMDSSSC4 | 28.0 | 28.1 | 17.4 |
| 0112370101 | SDS1 | 44.0 | 43.8 | 31.4 |
| 0112370301 | SDS2 | 43.0 | 42.6 | 23.5 |
| 0112370601 | SDS5 | 34.8 | 35.4 | 29.2 |
| 0112370701 | SDS6 | 48.7 | 48.7 | 37.3 |
| 0112370801 | SDS7 | 38.7 | 38.2 | 32.3 |
| 0112371001 | SDS1 | 46.0 | 45.6 | 33.5 |
| 0112372001 | SDS4 | 27.3 | 27.3 | 23.3 |
| 0112680201 | MLS2 | 11.9 | 11.9 | 7.5 |
| 0112681001 | MLS7 | 24.0 | 24.0 | 17.2 |
| 0210490101 | XLSS J022404.0−04132 | 83.9 | 82.9 | 67.4 |
| 0404967901 | LSS65 | 14.4 | 14.4 | 11.4 |
| 0553910601 | LSS37 | 14.3 | 14.3 | 12.3 |
| 0553911601 | LSS61 | 13.0 | 13.0 | 10.1 |
| 0604280101 | XLSSC006 | 97.4 | 97.1 | 82.5 |
| 0673110201 | XMM-129 | 32.3 | 32.3 | 23.6 |
*Targets in the original proposal.
†Net exposure time after data screening.
Results of power-law fits to X-ray spectra.
| 3XMM name | Observation ID | Net | N H † | Photon index | Flux‡ | C/dof§ | Note‖ |
|---|---|---|---|---|---|---|---|
| counts* | (1020 cm−2) | (10−14 erg s−1 cm−2) | |||||
| J021502.3−034111 | 0673110201 | 66 | 2.07 | |$1.14^{+0.39}_{-0.36}$| | 1.16 | 110.8/113 | a |
| J021529.4−034233 | 0673110201 | 230 | 2.07 | |$1.74^{+0.17}_{-0.17}$| | 1.69 | 296.5/281 | |
| J021532.3−035124 | 0673110201 | 72 | 2.04 | |$1.87^{+0.39}_{-0.36}$| | 0.81 | 116.4/118 | |
| J021541.0−034505 | 0673110201 | 87 | 2.07 | |$1.94^{+0.34}_{-0.31}$| | 0.54 | 142.3/139 | |
| J021606.6−050303 | 0112370601 | 89 | 2.06 | |$1.41^{+0.30}_{-0.29}$| | 1.18 | 139.3/125 | |
| J021614.5−050351 | 0112370601 | 88 | 2.06 | |$1.52^{+0.31}_{-0.39}$| | 0.94 | 121.1/122 | |
| J021625.7−050518 | 0112370601 | 93 | 2.05 | |$1.77^{+0.27}_{-0.25}$| | 1.18 | 100.7/122 | b |
| J021634.3−050724 | 0112370601 | 148 | 2.05 | |$1.54^{+0.22}_{-0.21}$| | 1.90 | 190.3/217 | |
| J021642.3−043552 | 0112372001 | 659 | 1.97 | |$1.11^{+0.09}_{-0.09}$| | 17.10 | 583.6/531 | |
| J021644.6−040651 | 0553911601 | 144 | 1.99 | |$1.46^{+0.20}_{-0.20}$| | 5.81 | 203.0/151 | |
| J021705.4−045655 | 0112371001 | 78 | 2.05 | |$1.43^{+0.34}_{-0.32}$| | 3.00 | 108.8/107 | c |
| J021705.7−052546 | 0112370701 | 152 | 2.23 | |$1.27^{+0.19}_{-0.19}$| | 1.68 | 149.8/180 | |
| J021721.2−052336 | 0112370701 | 77 | 2.22 | |$1.88^{+0.36}_{-0.33}$| | 0.41 | 127.6/129 | |
| J021721.9−043655 | 0112372001 | 133 | 1.97 | |$1.40^{+0.22}_{-0.21}$| | 1.77 | 147.7/161 | |
| J021725.8−051955 | 0112370701 | 97 | 2.22 | |$1.51^{+0.33}_{-0.31}$| | 0.60 | 170.0/145 | |
| J021729.3−052122 | 0112370701 | 96 | 2.22 | |$0.90^{+0.27}_{-0.27}$| | 1.31 | 146.0/137 | |
| J021736.4−050106 | 0112371001 | 111 | 1.98 | |$1.36^{+0.26}_{-0.25}$| | 1.22 | 163.4/157 | |
| J021744.1−034531 | 0404967901 | 43 | 2.05 | |$2.03^{+0.43}_{-0.40}$| | 0.84 | 81.6/83 | |
| J021810.1−051844 | 0112370801 | 93 | 2.22 | |$1.63^{+0.32}_{-0.30}$| | 1.23 | 109.3/137 | |
| J021813.2−045051 | 0112371001 | 106 | 1.99 | |$1.11^{+0.27}_{-0.25}$| | 2.32 | 161.5/137 | d |
| J021825.6−045945 | 0112370101 | 155 | 1.99 | |$0.71^{+0.21}_{-0.21}$| | 3.34 | 204.7/203 | |
| J021842.8−051934 | 0112370801 | 205 | 2.13 | |$0.95^{+0.17}_{-0.17}$| | 2.86 | 206.9/246 | |
| J021914.8−045139 | 0112370301 | 116 | 2.01 | |$1.64^{+0.25}_{-0.24}$| | 1.66 | 147.9/159 | |
| J022015.5−045654 | 0112370301 | 148 | 2.02 | |$1.31^{+0.22}_{-0.22}$| | 2.86 | 183.4/177 | |
| J022129.0−035359 | 0604280101 | 100 | 2.16 | |$1.17^{+0.57}_{-0.52}$| | 1.40 | 480.2/556 | |
| J022145.5−034346 | 0604280101 | 273 | 2.16 | |$1.14^{+0.22}_{-0.21}$| | 1.35 | 503.4/646 | |
| J022154.7−032558 | 0037980601 | 108 | 2.21 | |$1.55^{+0.24}_{-0.23}$| | 3.39 | 157.8/138 | |
| J022205.0−033238 | 0604280101 | 131 | 2.22 | |$0.68^{+0.32}_{-0.33}$| | 2.78 | 504.4/564 | |
| J022214.4−034619 | 0604280101 | 410 | 2.16 | |$1.66^{+0.18}_{-0.17}$| | 1.33 | 663.9/801 | |
| J022231.7−044910 | 0109520501 | 36 | 2.10 | |$1.29^{+0.40}_{-0.38}$| | 3.44 | 41.4/45 | e |
| J022314.5−041017 | 0109520101 | 52 | 2.22 | |$1.67^{+0.40}_{-0.37}$| | 0.53 | 76.6/81 | |
| J022326.5−041837 | 0210490101 | 102 | 2.22 | |$1.40^{+0.34}_{-0.32}$| | 0.93 | 153.11/197 | |
| J022330.8−044632 | 0109520501 | 363 | 2.18 | |$1.40^{+0.12}_{-0.12}$| | 5.81 | 313.5/328 | |
| J022331.0−044234 | 0109520501 | 79 | 2.18 | |$1.41^{+0.28}_{-0.27}$| | 2.02 | 83.0/95 | |
| J022334.3−040841 | 0210490101 | 88 | 2.27 | |$0.35^{+0.36}_{-0.39}$| | 1.41 | 184.8/174 | |
| J022337.9−040512 | 0210490101 | 212 | 2.27 | |$1.25^{+0.19}_{-0.18}$| | 1.84 | 239.6/260 | |
| J022343.3−041622 | 0210490101 | 108 | 2.22 | |$1.35^{+0.28}_{-0.27}$| | 0.82 | 169.8/181 | |
| J022347.1−040051 | 0210490101 | 107 | 2.29 | |$1.36^{+0.33}_{-0.31}$| | 1.53 | 172.9/189 | |
| J022352.0−052421 | 0553910601 | 75 | 2.22 | |$1.91^{+0.33}_{-0.31}$| | 2.29 | 99.1/98 | |
| J022353.2−041532 | 0210490101 | 152 | 2.22 | |$1.63^{+0.23}_{-0.22}$| | 0.64 | 249.4/235 | |
| J022358.2−050946 | 0111110401 | 77 | 2.23 | |$1.72^{+0.31}_{-0.29}$| | 0.78 | 85.7/90 | |
| J022405.2−041612 | 0210490101 | 387 | 2.27 | |$1.80^{+0.14}_{-0.13}$| | 1.06 | 338.9/440 | |
| J022408.6−041151 | 0210490101 | 142 | 2.27 | |$0.40^{+0.25}_{-0.26}$| | 1.52 | 237.6/253 | |
| J022410.3−040224 | 0210490101 | 68 | 2.27 | |$1.75^{+0.37}_{-0.34}$| | 0.53 | 131.3/118 | |
| J022412.5−035740 | 0210490101 | 35 | 2.29 | |$1.56^{+0.80}_{-0.62}$| | 0.86 | 95.7/72 | f |
| J022417.4−041812 | 0210490101 | 57 | 2.27 | |$1.21^{+0.43}_{-0.41}$| | 0.51 | 129.7/144 | |
| J022420.7−041224 | 0210490101 | 223 | 2.27 | |$1.91^{+0.19}_{-0.18}$| | 0.58 | 247.0/302 | |
| J022421.1−040355 | 0210490101 | 168 | 2.27 | |$1.37^{+0.22}_{-0.21}$| | 1.45 | 252.9/259 | |
| J022500.1−050831 | 0111110301 | 96 | 2.27 | |$1.21^{+0.28}_{-0.27}$| | 0.78 | 125.4/114 | |
| J022504.5−043706 | 0112681001 | 69 | 2.31 | |$0.96^{+0.30}_{-0.30}$| | 3.08 | 76.4/91 | |
| J022510.6−043549 | 0112681001 | 240 | 2.31 | |$1.48^{+0.16}_{-0.16}$| | 3.65 | 244.9/260 | |
| J022624.3−041344 | 0112680201 | 64 | 2.34 | |$2.13^{+0.39}_{-0.35}$| | 1.21 | 79.7/89 | |
| J022625.2−044648 | 0109520301 | 130 | 2.29 | |$1.31^{+0.20}_{-0.20}$| | 3.75 | 114.6/124 |
*Net counts in the 0.5–10 keV band. Counts from all the available sensors are summed.
†Galactic absorption column density in units of 1020 cm−2.
‡Observed flux in the 2–10 keV band in units of 10−14 erg s−1.
§ C statistic/degrees of freedom.
‖Notes. a: Different normalization of power law for EPIC-PN and EPIC-MOS are allowd in fit. Flux is for EPIC-PN. b: Only EPIC-PN is used. At chip boundary in EPIC-MOS1 and EPIC-MOS2. c: Only EPIC-PN and EPIC-MOS1 are used. Out of field of view of EPIC-MOS2. d: Only EPIC-PN and EPIC-MOS1 are used. Located at chip boundary in EPIC-MOS1. e: Only EPIC-PN is used. Not clearly visible in EPIC-MOS1 image and located at chip boundary in EPIC-MOS2. f: Only EPIC-PN is used. Out of field of view of EPIC-MOS1 and at edge of field of view of EPIC-MOS2.
5.1 Apparent spectral slope
We first measured apparent spectral slopes without assuming the source redshifts. A power-law model absorbed only by Galactic NH was assumed. The free parameters were the photon index (Γ) and the normalization of the power law. The results are shown in table 4. The apparent photon indices (figure 5) are distributed around Γ ≈ 1.5, which is slightly flatter than those observed in unobscured Seyferts or quasars (Γ ≈ 1.7–1.9; e.g., Nandra & Pounds 1994; Piconcelli et al. 2005) or their intrinsic photon index (Γ ≈ 1.9; e.g., Nandra et al. 2007). Only eight objects show very flat best-fit slopes (Γ < 1.0). The observed flux in the 2–10 keV band is summarized in table 4 and figure 6. The fluxes are in the range 6.0 × 10⁻¹⁵–1.7 × 10⁻¹³ erg s−1 cm−2.
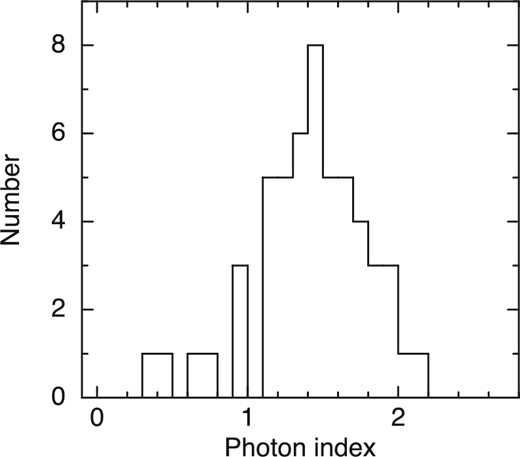
Distribution of apparent photon indices.
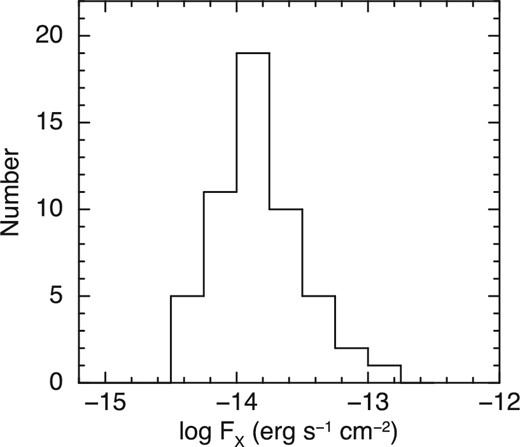
Distribution of observed X-ray fluxes in 2–10 keV.


X-ray spectra fitted by an absorbed power-law model. The observed data are binned for presentation purpose. Crosses with filled circle: EPIC-PN. Crosses without circle: combined EPIC-MOS1 and EPIC-MOS2. (Upper panel) Data and model. Upper solid histogram: best-fit model for EPIC-PN; lower histogram: best-fit model for EPIC-MOS. (Lower panel) Data/Model. (a) J021529.4−034233. (b) J021625.7−050518. (c) J021634.3−050724. (d) J021642.3−043552. (e) J021842.8−051934. (f) J022145.5−034346. (g) J022214.4−034619. (h) J022330.8−044632. (i) J022405.2−041612. (j) J022420.7−041224. (k) J022421.1−040355. (l) J022510.6−043549. (Color online)
5.2 Absorption column density
We next fitted the X-ray spectra with an absorbed power-law model to constrain the amount of absorption. An intrinsic absorber was assumed to be located at the photometric redshift determined in section 4 or spectroscopic redshift when available. Since the photon statistics were limited, the photon index was fixed at Γ = 1.9. The free parameters were the intrinsic absorption column density and the normalization of the power-law component. This model provides a good description of the X-ray spectra. One object, J021529.4−034323 (figure 7a), shows weak wavy residuals peaking at 0.5 keV and 2 keV. If an unabsorbed power-law component is added, a column density of |$1.6^{+6.2}_{-1.2}\times 10^{23}\:$|cm−2 for an absorbed component and an only slightly better value of the C statistic (ΔC = −4.7) are obtained for one additional free parameter (normalization of unabsorbed power law). In the following analysis, we use the results of single absorbed power-law fits for all the objects. The observed spectra, best-fit absorbed power-law model, and data/model ratios for objects with net EPIC-PN counts in 0.5–10 keV greater than 90 (12 objects in total) are shown in figure 7. The spectra taken with EPIC-MOS1 and EPIC-MOS2 are combined for presentation purpose.
The intrinsic absorption column densities thus obtained are tabulated in table 5, and their distribution is shown in figure 8 as a histogram. The best-fit absorption column densities are distributed in the range log NH = 20.5–23.5 (cm−2), except for three objects, for which the best-fit value becomes zero. The column densities of most objects are modest, as implied from the apparent slope in the single power-law fits in section 5.1, with the distribution peaking at log NH ≈ 21.5–22 (cm−2). Note that the derived absorption column densities depend on the assumed redshift. The dependence is approximated by NH ≈ (1 + z)2.5NH, z = 0 for redshifts greater than ∼0.5, where NH, z = 0 is the absorption column density obtained by assuming z = 0 in spectral fits.
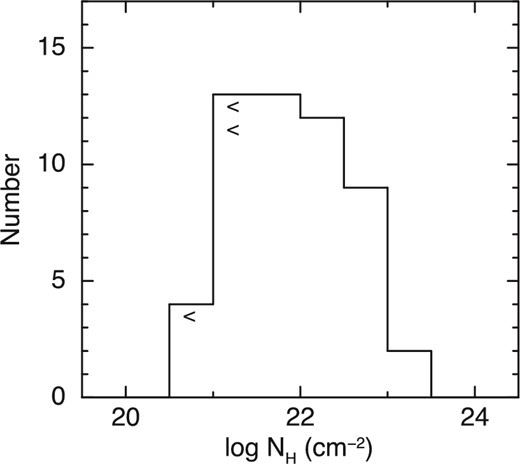
Distribution of best-fit values of absorption column density. Photon index is fixed at 1.9 in the fits. Photometric or spectroscopic (when available) redshifts are assumed in the spectral fits. “<” symbol denotes upper limit for objects with best-fit column density of zero.
Results of absorbed power law fits to X-ray spectra.
| 3XMM name* | N H † | L 2–10 ‡ | C/dof§ | 3XMM name* | N H † | L 2–10 ‡ | C/dof§ | |
|---|---|---|---|---|---|---|---|---|
| (1022 cm−2) | (1044 erg s−1) | (1022 cm−2) | (1044 erg s−1) | |||||
| J021502.3−034111 | |$5.8^{+4.3}_{-3.1}$| | 2.30 | 101.7/113 | J022205.0−033238 | |$7.2^{+3.7}_{-4.5}$| | 2.21 | 491.7/564 | |
| J021529.4−034233 | |$0.069^{+0.15}_{-0.069}$| | 1.21 | 298.1/281 | J022214.4−034619 | |$0.2^{+0.14}_{-0.12}$| | 0.688 | 660.0/801 | |
| J021532.3−035124 | |$0.17^{+0.73}_{-0.17}$| | 2.38 | 116.2/118 | J022231.7−044910 | |$2.2^{+2.4}_{-1.5}$| | 6.63 | 39.0/45 | |
| J021541.0−034505 | |$0.051^{+0.34}_{-0.051}$| | 0.721 | 142.3/139 | J022314.5−041017 | |$0.17^{+0.67}_{-0.17}$| | 0.757 | 77.3/81 | |
| J021606.6−050303 | |$0.17^{+0.18}_{-0.13}$| | 0.0613 | 140.7/125 | J022326.5−041837 | |$0.064^{+0.21}_{-0.064}$| | 0.0848 | 158.4/197 | |
| J021614.5−050351 | |$0.84^{+0.82}_{-0.56}$| | 1.19 | 117.6/122 | J022330.8−044632 | |$1.4^{+0.40}_{-0.35}$| | 7.65 | 280.2/328 | |
| J021625.7−050518 | |$0.17^{+0.41}_{-0.17}$| | 2.29 | 100.7/122 | J022331.0−044234 | |$2.0^{+1.6}_{-1.1}$| | 5.80 | 79.4/95 | |
| J021634.3−050724 | |$0.23^{+0.22}_{-0.18}$| | 0.892 | 192.8/215 | J022334.3−040841 | |$12^{+7.6}_{-5.1}$| | 0.861 | 171.3/174 | |
| J021642.3−043552 | |$3.3^{+0.53}_{-0.47}$| | 21.6 | 465.6/531 | J022337.9−040512 | |$3.2^{+1.5}_{-1.1}$| | 5.00 | 233.0/260 | |
| J021644.6−040651 | |$0.94^{+0.5}_{-0.55}$| | 2.10 | 188.1/151 | J022343.3−041622 | |$0.51^{+0.48}_{-0.11}$| | 0.437 | 174.5/181 | |
| J021705.4−045655 | |$0.39^{+0.42}_{-0.29}$| | 1.29 | 108.5/107 | J022347.1−040051 | |$1.5^{+2.2}_{-1.3}$| | 4.70 | 176.4/189 | |
| J021705.7−052546 | |$1.1^{+0.54}_{-0.42}$| | 1.27 | 150.2/180 | J022352.0−052421 | |$0.12^{+0.38}_{-0.12}$| | 3.28 | 98.7/98 | |
| J021721.2−052336 | |$0^{+0.14}_{-0}$| | 0.423 | 127.6/129 | J022353.2−041532 | |$0.54^{+0.51}_{-0.37}$| | 0.721 | 246.1/235 | |
| J021721.9−043655 | |$0.92^{+0.55}_{-0.40}$| | 0.744 | 137.0/161 | J022358.2−050946 | |$0.21^{+0.65}_{-0.21}$| | 1.14 | 86.1/90 | |
| J021725.8−051955 | |$0.40^{+0.52}_{-0.37}$| | 0.247 | 170.5/145 | J022405.2−041612 | |$0.16^{+0.19}_{-0.16}$| | 1.70 | 337.9/440 | |
| J021729.3−052122 | |$6.5^{+3.5}_{-2.5}$| | 2.17 | 138.8/137 | J022408.6−041151 | |$18^{+10}_{-6}$| | 1.84 | 232.5/253 | |
| J021736.4−050106 | |$1.00^{+0.81}_{-0.58}$| | 1.00 | 161.9/157 | J022410.3−040224 | |$0.39^{+1.4}_{-0.39}$| | 1.38 | 131.2/118 | |
| J021744.1−034531 | |$0^{+0.083}_{-0}$| | 0.65 | 81.9/83 | J022412.5−035740 | |$0.46^{+1.2}_{-0.46}$| | 1.21 | 95.4/72 | |
| J021810.1−051844 | |$0.7^{+1.2}_{-0.7}$| | 4.3 | 109.6/137 | J022417.4−041812 | |$3.8^{+5.5}_{-3.3}$| | 0.516 | 130.1/144 | |
| J021813.2−045051 | |$0.81^{+0.43}_{-0.31}$| | 0.261 | 147.3/137 | J022420.7−041224 | |$0.15^{+0.20}_{-0.15}$| | 0.687 | 244.7/302 | |
| J021825.6−045945 | |$9.5^{+3}_{-2.4}$| | 3.11 | 196.5/203 | J022421.1−040355 | |$1.1^{+0.68}_{-0.51}$| | 1.25 | 246.1/259 | |
| J021842.8−051934 | |$7.3^{+2.8}_{-2.2}$| | 5.49 | 200.7/246 | J022500.1−050831 | |$1.5^{+0.89}_{-0.65}$| | 0.836 | 116.8/114 | |
| J021914.8−045139 | |$0.19^{+0.34}_{-0.19}$| | 1.96 | 149.6/159 | J022504.5−043706 | |$2.2^{+1.5}_{-1.1}$| | 1.24 | 77.7/91 | |
| J022015.5−045654 | |$2.2^{+1.3}_{-0.94}$| | 4.80 | 177.4/177 | J022510.6−043549 | |$1.4^{+0.61}_{-0.5}$| | 7.59 | 232.0/260 | |
| J022129.0−035359 | |$0.65^{+1.6}_{-0.62}$| | 0.659 | 481.4/556 | J022624.3−041344 | |$0^{+0.23}_{-0}$| | 2.04 | 80.5/89 | |
| J022145.5−034346 | |$3.6^{+2.0}_{-1.4}$| | 3.24 | 495.5/646 | J022625.2−044648 | |$1.1^{+0.64}_{-0.51}$| | 4.39 | 120.2/124 | |
| J022154.7−032558 | |$0.84^{+0.98}_{-0.72}$| | 9.75 | 159.4/137 |
*Observation ID and assumed Galactic absorption column density are the same as in table 4.
†Intrinsic absorption column density at source redshift in units of 1022 cm−2. Photometric or spectroscopic (when available) redshifts are assumed in the spectral fits.
‡X-ray luminosity in 2–10 keV corrected for the Galactic and intrinsic absorption in units of 1044 erg s−1. Photometric or spectroscopic (when available) redshifts are assumed.
§ C statistic/degrees of freedom.
By using the absorbed power-law model, intrinsic X-ray luminosities in the 2–10 keV band (source rest frame) corrected for both Galactic and intrinsic absorption were derived, where photometric or spectroscopic redshifts were assumed. The intrinsic luminosities are shown in table 5 and figure 9. The peak of the distribution of the intrinsic luminosities is around log LX = 44.0–44.4 erg s−1. The boundary between Seyfert and quasar luminosities in X-rays of 1044 erg s−1 in 2–10 keV is often used, and the luminosities of most of the objects in our sample are those of quasars or luminous Seyferts. Among 35 objects having LX > 1044 erg s−1, the NH of 20 objects is in excess of 1022 cm−2 and they are classified as type 2 quasars based on X-ray absorption. Thus our selection is efficient to find a population of type 2 quasars. Among the 20 type 2 quasar candidates, the redshift of one object (J021736.4−050106) was spectroscopically measured (table 2; Akiyama et al. 2015).
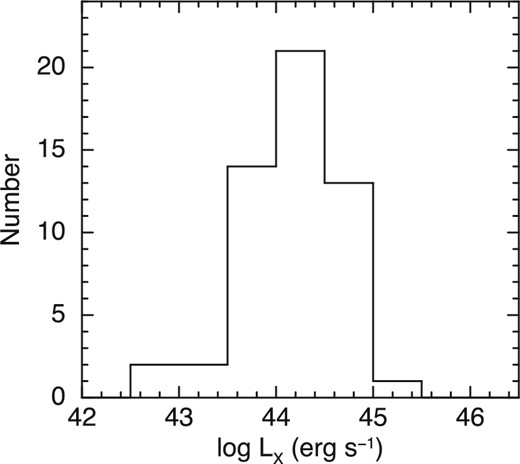
Distribution of X-ray luminosities in 2–10 keV corrected for absorption. Photometric or spectroscopic (when available) redshifts are assumed.
5.3 Flux ratios
The X-ray fluxes in the 2–10 keV band corrected for the Galactic absorption derived from the absorbed power-law fits (FX) are used to calculate X-ray to i-band flux ratios. i-band flux Fi is defined as Δλfλ, where Δλ is the full width at half maximum of the i-band filter transmission (1480 Å) and fλ is the flux density at i band in units of erg s−1 cm−2 Å−1.
The i-band magnitude corrected for Galactic extinction, the X-ray flux in the 2–10 keV band corrected for Galactic absorption, and the distribution of the flux ratios are shown in figure 10. The values of the flux ratios are summarized in table 6. The FX/Fi ratios for 44 objects are greater than 10, which are classified as extreme X-ray-to-optical flux sources (EXOs). Nine of them have FX/Fi > 50 and are classified as EXO50, which is the class showing the most extreme X-ray to optical flux ratios as defined in Della Ceca et al. (2015) using the R band. The deficit of objects with small FX/Fi ratios is due to our selection criteria: we selected X-ray-bright (0.2–12 keV EPIC-PN counts greater than 70) and optically faint (i-band magnitude fainter than 23.5) objects.
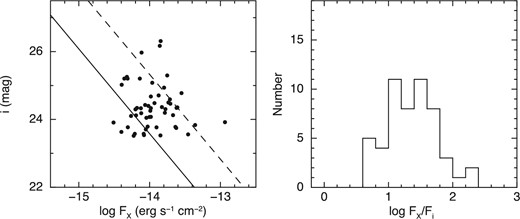
(Left panel) i-band magnitude corrected for Galactic extinction plotted against log FX (erg s−1 cm−2) corrected for absorption in the 2–10 keV band. Solid and dashed lines correspond to flux ratios of FX/Fi = 10 and 50, respectively. (Right panel) Distribution of X-ray flux to i-band flux ratio FX/Fi. X-ray fluxes are in the 2–10 keV band corrected for Galactic absorption. i-band fluxes are corrected for Galactic extinction.
Flux ratios.
| 3XMM name | i mag* | F X/Fi† | F X/λFλ,24 | i − [3.6] | [3.6] − [4.5] | i − [24] |
|---|---|---|---|---|---|---|
| J021502.3−034111 | 24.086 | 13.8 | — | 3.22 | 0.17 | — |
| J021529.4−034233 | 23.565 | 13.5 | — | 3.14 | 0.11 | — |
| J021532.3−035124 | 23.613 | 8.2 | — | 2.49 | 0.25 | — |
| J021541.0−034505 | 23.553 | 5.6 | — | 3.29 | 0.14 | — |
| J021606.6−050303 | 24.218 | 13.3 | — | 3.94 | 0.26 | — |
| J021614.5−050351 | 25.240 | 32.4 | — | 5.19 | 0.51 | — |
| J021625.7−050518 | 24.114 | 16.4 | — | 3.52 | 0.20 | — |
| J021634.3−050724 | 24.744 | 37.9 | — | 4.24 | 0.46 | — |
| J021642.3−043552 | 23.951 | 158.6 | 7.19 | 4.90 | 0.39 | 7.80 |
| J021644.6−040651 | 23.596 | 34.3 | — | 3.11 | 0.20 | — |
| J021705.4−045655 | 24.497 | 44.2 | 2.61 | 4.57 | 0.47 | 7.51 |
| J021705.7−052546 | 24.369 | 20.8 | 1.28 | 3.92 | 0.68 | 7.46 |
| J021721.2−052336 | 23.670 | 4.2 | — | 2.41 | 0.29 | — |
| J021721.9−043655 | 26.202 | 151.2 | 0.87 | 7.20 | 0.68 | 10.04 |
| J021725.8−051955 | 25.244 | 19.6 | — | 4.61 | 0.20 | — |
| J021729.3−052122 | 26.010 | 69.6 | — | 4.75 | 0.47 | — |
| J021736.4−050106 | 23.573 | 8.0 | 1.22 | 3.85 | 0.30 | 6.48 |
| J021744.1−034531 | 24.715 | 28.6 | — | 5.27 | 0.14 | — |
| J021810.1−051844 | 24.434 | 20.4 | — | 3.73 | 0.21 | — |
| J021813.2−045051 | 24.398 | 30.7 | — | 3.88 | 0.34 | — |
| J021825.6−045945 | 24.162 | 35.4 | — | 4.24 | 0.05 | — |
| J021842.8−051934 | 25.331 | 86.1 | — | 4.69 | 0.31 | — |
| J021914.8−045139 | 23.799 | 14.9 | — | 3.45 | 0.36 | — |
| J022015.5−045654 | 24.627 | 49.1 | — | 4.51 | 0.25 | — |
| J022129.0−035359 | 24.335 | 12.2 | — | 4.12 | 0.24 | — |
| J022145.5−034346 | 24.367 | 15.0 | — | 3.70 | 0.01 | — |
| J022154.7−032558 | 24.380 | 48.4 | — | 4.16 | 0.26 | — |
| J022205.0−033238 | 24.237 | 29.0 | — | 3.52 | 0.32 | — |
| J022214.4−034619 | 25.119 | 43.4 | — | 4.43 | 0.31 | — |
| J022231.7−044910 | 23.821 | 27.8 | 2.71 | 3.37 | 0.52 | 6.97 |
| J022314.5−041017 | 25.063 | 15.2 | — | 4.18 | 0.09 | — |
| J022326.5−041837 | 23.814 | 5.9 | — | 3.69 | 0.38 | — |
| J022330.8−044632 | 23.878 | 55.5 | — | 3.08 | 0.79 | — |
| J022331.0−044234 | 26.351 | 176.7 | — | 4.82 | 0.42 | — |
| J022334.3−040841 | 24.467 | 18.8 | — | 4.48 | 0.15 | — |
| J022337.9−040512 | 24.523 | 26.9 | 0.56 | 4.81 | 0.69 | 8.65 |
| J022343.3−041622 | 25.247 | 21.8 | — | 4.93 | 0.50 | — |
| J022347.1−040051 | 23.749 | 9.9 | — | 3.22 | 0.11 | — |
| J022352.0−052421 | 24.394 | 50.3 | — | 4.21 | 0.12 | — |
| J022353.2−041532 | 24.147 | 8.8 | — | 3.62 | 0.19 | — |
| J022358.2−050946 | 24.381 | 13.3 | — | 3.58 | 0.37 | — |
| J022405.2−041612 | 24.118 | 15.6 | — | 3.02 | 0.53 | — |
| J022408.6−041151 | 23.836 | 11.4 | — | 4.03 | 0.23 | — |
| J022410.3−040224 | 25.303 | 22.4 | — | 4.40 | 0.41 | — |
| J022412.5−035740 | 23.629 | 6.2 | — | 3.72 | 0.18 | — |
| J022417.4−041812 | 23.952 | 4.2 | 0.57 | 4.31 | 0.35 | 6.60 |
| J022420.7−041224 | 24.165 | 10.6 | — | 4.10 | 0.41 | — |
| J022421.1−040355 | 24.304 | 19.0 | — | 3.30 | 0.27 | — |
| J022500.1−050831 | 24.983 | 55.9 | — | 4.05 | 0.25 | — |
| J022504.5−043706 | 24.539 | 43.0 | 3.14 | 5.03 | 0.34 | 7.28 |
| J022510.6−043549 | 24.816 | 84.9 | — | 4.46 | 0.44 | — |
| J022624.3−041344 | 24.348 | 32.6 | 2.07 | 4.04 | 0.70 | 7.43 |
| J022625.2−044648 | 23.791 | 27.7 | — | 3.35 | 0.58 | — |
*Cmodel magnitude in the i band. Galactic extinction is not corrected.
†X-ray to i-band flux ratio. FX is X-ray flux in the 2–10 keV band corrected for Galactic absorption, and Fi is ΔλFλ in the i band corrected for Galactic extinction.
‡X-ray to 24 μm flux ratio. FX is the X-ray flux in the 2–10 keV band corrected for Galactic absorption, and Fλ is the flux density at 24 μm in units of erg s−1 cm−2 Å−1.
6 Discussion
6.1 X-ray absorption
We made a sample of 53 X-ray-bright optically faint AGNs and analyzed their X-ray spectra. The number of objects for which individual X-ray spectral fits can be performed is much larger than previous works (Perola et al. 2004; Rovilos et al. 2010; Della Ceca et al. 2015). X-ray spectral fits with an absorbed power-law model show that the X-ray absorption is modest: 43 out of 53 objects are absorbed by a column density between 1021 and 1023 cm−2. Only three are absorbed by the best-fit column of the order of 1023 cm−2. Thus, all the objects are classified as Compton-thin AGNs. We examine whether flat X-ray spectra observed in several objects are explained by a Compton-thick AGN. All of the X-ray spectra of seven sources with an apparent photon index of Γ < 1.0 show a clear convex shape peaking at energies 1.2–2 keV, indicating mild absorption. This shape is not compatible with a reflection-dominated X-ray spectrum that is flat, nor a combination of reflected emission and emission Thomson-scattered by an ionized medium resulting in a concave shape. We therefore conclude that our spectra are best explained by a power-law model absorbed by at most several ×1023 cm−2, as deduced from the absorbed power-law fits in subsection 5.2.
The modest absorption measured for our sample and the absence of Compton-thick AGNs are in agreement with results obtained with XMM-Newton using a much smaller survey area. The observed 2–10 keV fluxes for our sample are in the range of FX = 4 × 10⁻¹⁵–2 × 10⁻¹³ erg s−1 cm−2. This range covers X-ray fainter sources compared to objects found in the HELLAS2XMM survey and XMDS by a factor of two (Perola et al. 2004; Tajer et al. 2007). Therefore, we found no evidence for the emergence of new properties in the covered flux range. On the other hand, previous studies of X-ray-bright optically faint AGNs using Chandra show a larger fraction of objects with flatter slope than those for our sample. This discrepancy might be partly due to the flux range. In Chandra studies using deep fields, fainter sources (mostly < several × 10−15 erg s−1 cm−2; e.g., Civano et al. 2005) are sampled, and heavily absorbed AGNs with a similar luminosity could be detected. Another possible selection bias is our use of full-band X-ray counts in the sample selection. The effective area of XMM-Newton is larger at soft X-rays and more sensitive to less-absorbed objects.
Next we test whether the relation between the optical faintness of our sample is related to the X-ray absorption (NH). As shown in figure 11, a correlation between X-ray to i-band flux ratio (FX/Fi) and NH is not clear. Hereafter, we use X-ray fluxes corrected for the Galactic absorption derived from the absorbed power-law fits and i-band fluxes corrected for Galactic extinction. All of the NH values of the most extreme objects with log (FX/Fi) > 1.9 are greater than 1022 cm−2, although it is not clear whether this trend is real or due to the limited sample size.
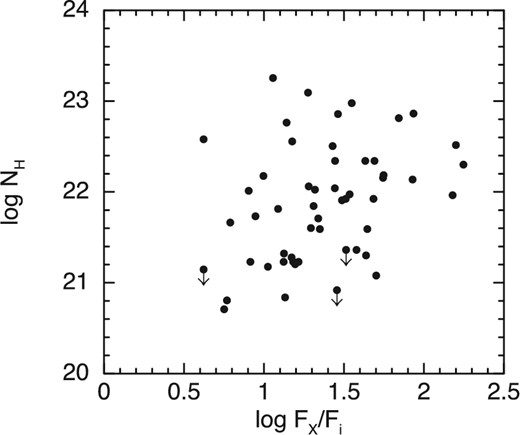
Absorption column density and X-ray flux to i-band flux ratio FX/Fi.
The X-ray absorption column densities obtained for our sample are mostly in the range log NH ≈ 20.5–23.5 cm−2, which corresponds to an extinction of EB−V = 0.054–54 or AV = 0.17–170 if standard conversion factors of AV/EB−V = 3.1 and NH/EB−V = 5.8 × 1021 cm−2 mag−1 (Bohlin et al. 1978) are assumed. We examine whether this amount of absorption is sufficient to obscure the central AGN in the optical and to explain the optical faintness of our sample. If the intrinsic SED between optical and X-ray is represented by a template of unabsorbed radio-quiet quasars assembled by Elvis et al. (1994), the slope between the V band and 1 keV is log νFν, V − log νFν, 1 keV ≈ 0.6. The flux ratios of FX/Fi = 10 and 50 correspond to AV = 1.5 and 3.3 if a quasar is the only source of radiation. The NH values required for these AV values are 2.8 × 10²¹ and 6.2 × 1021 cm−2, respectively. The best-fit NH values of 15 objects do not exceed the former value, and the optical faintness cannot be explained if the standard conversion factor is assumed. The SEDs of most objects show the signature of a stellar emission component in the optical band in the source rest frame; the extinction necessary to hide a large fraction of AGN emission should be higher than these AV values. Therefore, EB−V/NH values should be larger than the standard value for at least part of the sample. This condition implies a large dust/gas ratio in the galaxies in our sample, and then a smaller NH could give stronger reddening. This dust-rich nature of our sample is consistent with the significant infrared emission seen in the SED. Note, however, that EB−V/NH values in AGNs are suggested to be smaller than the Galactic standard value (Maiolino et al. 2001), which is in the opposite sense to our case. Their sample consisted of Seyfert galaxies showing at least two broad lines in optical/infrared with NH measured by X-ray, which are ordinary AGNs in terms of X-ray to optical flux ratios. Thus the dust-rich nature is suggested to be related to optical faintness in our sample.
The peak of the number density of AGNs of an X-ray luminosity of 1044–45 erg s−1, which is typical for our sample, is at around z ∼ 1.6 (Ueda et al. 2014). The redshifts for most of the objects in our sample (50 objects) are located in the range 1.0 to 2.7, which coincides with the peak of the number density. The observed modest X-ray absorption column densities indicate that they are not missed in surveys at <10 keV (or <30 keV at z = 2). On the other hand, the optical faintness means relatively deep surveys are necessary to fully sample this class of objects in the optical.
6.2 Optical/infrared color, SED, and optical faintness
Figure 12 plots log (FX/Fi) against i − 3.6 μm color (i − [3.6] in AB magnitude). The i − [3.6] colors are shown in table 6. The locus occupied by the objects in our sample is in accordance with the known trend that optically faint X-ray-bright objects have redder color between the near-infrared and optical bands (e.g., R − K, R − [3.6]; Brusa et al. 2010). The i − [3.6] colors are in the range of 2.7–7.5, indicating very red color and faintness in the i band compared to 3.6 μm. The open and filled symbols in figure 12 are objects with log NH < 22 and >22 cm−2, respectively. There is no clear evidence that these groups of small and large absorption show different i − [3.6] colors.
![log (FX/Fi) plotted against i − [3.6] color in AB magnitude. Open circles: log NH < 22 cm−2. Filled circles: log NH > 22 cm−2.](https://oup.silverchair-cdn.com/oup/backfile/Content_public/Journal/pasj/70/SP1/10.1093_pasj_psx109/2/m_pasj_70_sp1_s36_f4.jpeg?Expires=1750250263&Signature=o8NpKUftOdTiL79eYyYRP2RLyLxW~L-bFjjdBxeEDv~qpvcrd7LFu00KKJEhdBHMYQ-ksYe~hyKiXLkow7Pxkd9TjGKi9VjHfGQ3CesyQuvFUTPz8m7FWHmud~Rbga5jvGRfdLT2-PwBO0GO9Y-O80SYSmhLlzpB3OciJ33w5v84-i9xjEA~PBD0JCTwbYQea33dIxyuBO6fGqdmaQY5b6UqNSrck~cjTx4yrVx169hbEUtVIeBv4lE7N-hQk30~vmufYnwKUWmqpeNU5FX8Yx5Zf-Kj8x-tJaQQLJ7sgVEfjOIo6unvVfnS-Q1lB77D2qUAoMQf2xRpBCgiNxi7ZA__&Key-Pair-Id=APKAIE5G5CRDK6RD3PGA)
log (FX/Fi) plotted against i − [3.6] color in AB magnitude. Open circles: log NH < 22 cm−2. Filled circles: log NH > 22 cm−2.
All the objects in our sample are detected in both the 3.6 μm and 4.5 μm bands. Figure 13 shows log (FX/Fi) plotted against [3.6] − [4.5] color (table 6). The [3.6] − [4.5] colors are also red (0.05–0.82) compared to the distribution for X-ray-selected AGNs containing both broad-line and non-broad-line AGNs (e.g., [3.6] − [4.5] = −0.8−+0.9; Feruglio et al. 2008). The observed red color in the near-infrared band in the source rest frame indicates the presence of hot dust, most probably heated by AGN.
![log (FX/Fi) plotted against [3.6] − [4.5] color in AB magnitude. Open circles: log NH < 22 cm−2. Filled circles: log NH > 22 cm−2.](https://oup.silverchair-cdn.com/oup/backfile/Content_public/Journal/pasj/70/SP1/10.1093_pasj_psx109/2/m_pasj_70_sp1_s36_f5.jpeg?Expires=1750250263&Signature=N9RjQyE1t0-k-pwTxQeXtUQJ1KKLld71L9N5aQI6JqGuj5I~l2hodsXyJ~CjzDwgPjqILvMbZNtX4tP7B9apiej~v1LvNTSUa1Tkap3pLNfMiXqxVCYVzRzZ-wKf4doTeyWB4yYBkvm4q6auW9MBsj4vTGyTbtLjRDk7lDCOb14pl4iiI24oOoth3JvkVZqGXwhR0mbeWrEPDLl70nF88IQPQQfwuvI15tlMk6GsSe5PnIKyGVRaZulvT32idN6VjO7L2FU40jOcBiGc8iOxF28CtlgatSOUobF4V-O4QttyGGCRAueRaWObu~64VpRTKZGK0ASV9EO8EOIP1-kV6w__&Key-Pair-Id=APKAIE5G5CRDK6RD3PGA)
log (FX/Fi) plotted against [3.6] − [4.5] color in AB magnitude. Open circles: log NH < 22 cm−2. Filled circles: log NH > 22 cm−2.
The results of SED fits indicate the presence of a significant amount of dust in most of the objects in our sample. Only five objects are fitted by the type 1 AGN template, and the rest of the objects are represented by type 2 AGN or SF galaxy. The AV values of the five objects showing type 1 SED are in the range 1.1–2.3, leading to a relatively red SED in the optical and a large FX/Fi ratio. Furthermore, most objects show significant infrared emission; a large fraction of the sample (44 of 53) are explained by SED of ultraluminous infrared galaxies (ULIRGs), starburst galaxy, AGN with emission from dusty torus, or type 2 AGNs, in which rest-UV and optical emission are reddened by dust. In the cases that normal galaxy templates are applied to the optical and near-infrared SED up to the K band, significant infrared excess over the model is seen at 3.6 μm, 4.5 μm, and longer wavelengths (if data is available) in most objects. These results indicate that objects in our sample show strong infrared emission from AGN and/or star formation activity and the presence of a remarkable amount of dust, and the presence of dust heated by AGN is in agreement with the red color in the near-infrared band. The extinction caused by the dust is thus likely to contribute to the faintness in the optical band.
Another cause of optical faintness is the SED shape of the stellar component of host galaxies. AGN emission is likely to be attenuated by dust in the rest-UV and optical bands, and host emission can be observed. Most of the observed SED show a break feature at 8000–11000 Å in the observed frame. Such features are well explained by the galaxy component seen in the templates except for cases fitted by the type 1 AGN template or a few objects showing no clear features. The determined redshifts are greater than 1.0 except for three cases. At z > 1, the 4000 Å break shifts to the i or redder bands. Therefore the combination of the break feature and the redshift range is another likely cause of the optical faintness.
The presence of the break feature implies that the central AGN is obscured and that the stellar component of host galaxies is significantly present in the optical emission. We examine the contribution of the host by comparing PSF and cmodel magnitudes. Figure 14 shows the difference of PSF magnitude and cmodel magnitude in the i band plotted against absorption-corrected X-ray luminosities in the 2–10 keV band in the source rest frame. SED types of AGN1, AGN2, and SF are shown as different symbols. The figure indicates the presence of an extended emission component up to 0.8 mag in a large fraction of objects, consistent with a significant contribution of host emission to the observed SED. There is no clear evidence for a correlation between extendedness and X-ray luminosity, implying the AGN component is absorbed by dust even in luminous (>1044 erg s−1) AGNs.

Difference between PSF and cmodel magnitudes plotted against absorption-corrected 2–10 keV luminosity. The short and long bars in the lower right corner are typical errors of mPSF − mcmodel for i = 24 and 25, respectively. Filled circles: AGN 1; Open circles: AGN 2; Crosses: SF.
6.3 Mid-infrared emission and obscuration of AGN
Ten objects in our sample are detected at 24 μm in the SWIRE survey. Four of them have a 24 μm to i-band flux density ratio f24/fi greater than 1000 (or i − [24] >7.5; table 6) satisfying the criterion of dust-obscured galaxies (DOGs), where we use the i band instead of the R band used in the original definition (Dey et al. 2008). The f24/fi ratios for two objects (J021721.9−043655 and J022337.9−040512) are greater than 2000, and they are classified as extremely dust-obscured galaxies (EDOGs). The absorption column densities of these EDOGs and two DOGs with 1000 ≤ f24/fi ≤ 2000 (J021642.3−043552 and J021705.4−045655) are modest: |$0.92^{+0.55}_{-0.40}$|, |$3.2^{+1.5}_{-1.1}$|, |$3.3^{+0.53}_{-0.47}$|, and |$1.1^{+0.54}_{-0.42}\times 10^{22}\:$|cm−2, respectively.
Among seven EXO50s studied in Della Ceca et al. (2015), three are classified as EDOGs (f24/fR > 2000). Their absorption column densities NH are measured to be >0.4, |$3.61^{+1.03}_{-0.92}$|, and >0.1 × 1022 cm−2. Lanzuisi et al. (2009) analyzed Chandra and XMM-Newton data of a sample of 44 EDOGs, and at least 21 objects are classified as EXOs (FX/FR > 10). The estimated NH for the 21 objects is typically in the range of 1 × 10²²–several × 1023 cm−2 with four upper limits, two lower limits, and one candidate Compton-thick object (2.7 × 1024 cm−2). A recent study of 14 X-ray-detected DOGs in the Chandra Deep Field South showed that only three could be considered as Compton-thick AGNs, and the others are absorbed by at most 8 × 1023 cm−2 (Corral et al. 2016). This modest absorption and the paucity of Compton-thick AGNs in X-ray-detected DOGs are in agreement with the measurement in the present sample. Note, however, that X-ray emission is extremely extinct even at hard X-rays (>20 keV in the source rest frame) if the absorption column density is greater than ∼1025 cm−2 (Wilman & Fabian 1999; Ikeda et al. 2009). Current X-ray surveys are biased against such extreme cases, and therefore systematic X-ray follow-up observations of optically/infrared-selected DOGs is necessary to fully understand the true nature of this population. Some X-ray-undetected DOGs are indeed suggested to be heavily obscured quasars (Corral et al. 2016).
If an AGN is energetically dominant, mid-infrared emission predominantly comes from warm/hot dust heated by the AGN, and then a good correlation between X-ray and mid-infrared luminosity is expected unless X-ray emission is significantly attenuated by absorption (Gandhi et al. 2009; Mateos et al. 2015; Asmus et al. 2015; Ichikawa et al. 2017). According to the correlation between 22 μm and hard X-ray luminosity in 14–195 keV in Ichikawa et al. (2017), an X-ray to mid-infrared luminosity ratio (LX/λLλ, MIR) of 0.48 is expected for an X-ray luminosity in the 2–10 keV band of log LX = 44 (erg s−1), which is typical for our sample with 24 μm detection. In the conversion between luminosities in 14–195 keV and 2–10 keV, an unabsorbed AGN spectrum of Γ = 1.9 is assumed, as in Ichikawa et al. (2017). X-ray to mid-infrared luminosity ratios for the ten sources with 24 μm detection range from 0.56 to 7.2 (table 6). These values are close to or even higher than the expected ratio. This fact indicates that our absorption correction is reliable and that the X-ray emission is not obscured by Compton-thick matter.
7 Summary and conclusions
We constructed a sample of X-ray-bright optically faint AGNs by combining Subaru HSC, XMM-Newton, Spitzer, and UKIDSS surveys. From a parent sample of i > 23.5 mag and X-ray counts with EPIC-PN in 0.2–12 keV >70 in the part of the XXL survey area covered by the Spitzer public catalog, 53 X-ray-bright optically faint AGNs were selected by matching X-ray, 3.6 μm, and i-band sources. The wide area used in this study (9.1 deg2) enabled us to create a large sample for which X-ray spectral analysis is possible. Optical/infrared SEDs were created and fitted by templates of various types of galaxies, then photometric redshifts were determined. The nature of the selected sources were investigated by using SEDs, X-ray spectra, and optical/infrared colors. Their properties are summarized as follows:
FX/Fi ratios of 44 objects among 53 sources are greater than 10 and classified as extreme-X-ray-to-optical flux sources (EXOs). Nine of these have FX/Fi > 50 and are EXO50s.
The SEDs are represented by AGN2 or SF templates, except for five objects fitted by AGN1. Most objects show a break feature at around 8000–11000 Å in the observed frame that is likely to be from the stellar component of the host galaxies. Red optical/infrared colors suggest that the central AGN is dust obscured. The determined redshifts (mostly z = 1.0–2.2) coincide with the peak of the number density of AGNs of X-ray luminosity 1044–45 erg s−1.
The X-ray spectra were well represented by an absorbed power-law model with a fixed photon index of 1.9. The best-fit intrinsic absorption column densities at the source redshift are mostly in the range of log NH = 20.5–23.5 cm−2. These modest absorption column densities are in agreement with studies of similar populations (EXOs and DOGs). The measured NH values are not always sufficient to obscure AGN emission in the optical band to explain the SED shape. A large dust/gas ratio would be required for part of our sample.
Twenty objects among 53 (38%) are classified as type 2 quasars. This fraction indicates that our selection criteria efficiently sample type 2 quasars.
Among 10 objects with 24 μm detection, four are classified as DOGs, defined as f24/fi > 1000. Two objects are EDOGs with f24/fi > 2000. The X-ray to 24 μm ratios imply that our X-ray sources are not obscured by Compton-thick matter and that our absorption corrections are reliable.
The most likely causes of optical faintness in our sample are a combination of spectral break of the stellar component redshifted to the band redder than the i band (i.e., z > 1; except for several objects with relatively featureless SEDs), significant dust extinction in the rest frame UV and optical bands, and in part a large ratio of dust/gas.
Acknowledgements
We thank the referee for constructive comments that improved the clarity of this paper. This work is supported in part by JSPS KAKENHI Grant Numbers 16K05296 (Y.T.), 16H01101, and 16H03958 (T.N.). K.I. acknowledges support by the Spanish MINECO under grant AYA2016-76012-C3-1-P and MDM-2014-0369 of ICCUB (Unidad de Excelencia “María de Maeztu”). This research is based on observations obtained with XMM-Newton, an ESA science mission with instruments and contributions directly funded by ESA Member States and NASA. This research has made use of data obtained from the 3XMM XMM-Newton serendipitous source catalogue compiled by the ten institutes of the XMM-Newton Survey Science Centre selected by ESA. This work is based in part on observations made with the Spitzer Space Telescope, which is operated by the Jet Propulsion Laboratory, California Institute of Technology, under a contract with NASA. This research has made use of the NASA/IPAC Infrared Science Archive, which is operated by the Jet Propulsion Laboratory, California Institute of Technology, under contract with NASA. This work is based in part on data obtained as part of the UKIRT Infrared Deep Sky Survey. This work is based in part on data collected at the Subaru Telescope and retrieved from the HSC data archive system, which is operated by the Subaru Telescope and Astronomy Data Center at the National Astronomical Observatory of Japan.
The Hyper Suprime-Cam (HSC) collaboration includes the astronomical communities of Japan and Taiwan, and Princeton University. The HSC instrumentation and software were developed by the National Astronomical Observatory of Japan (NAOJ), the Kavli Institute for the Physics and Mathematics of the Universe (Kavli IPMU), the University of Tokyo, the High Energy Accelerator Research Organization (KEK), the Academia Sinica Institute for Astronomy and Astrophysics in Taiwan (ASIAA), and Princeton University. Funding was contributed by the FIRST program from the Japanese Cabinet Office, the Ministry of Education, Culture, Sports, Science and Technology (MEXT), the Japan Society for the Promotion of Science (JSPS), the Japan Science and Technology Agency (JST), the Toray Science Foundation, NAOJ, Kavli IPMU, KEK, ASIAA, and Princeton University.
The Pan-STARRS1 Surveys (PS1) have been made possible through contributions of the Institute for Astronomy, the University of Hawaii, the Pan-STARRS Project Office, the Max-Planck Society and its participating institutes, the Max Planck Institute for Astronomy, Heidelberg and the Max Planck Institute for Extraterrestrial Physics, Garching, The Johns Hopkins University, Durham University, the University of Edinburgh, Queen’s University Belfast, the Harvard-Smithsonian Center for Astrophysics, the Las Cumbres Observatory Global Telescope Network Incorporated, the National Central University of Taiwan, the Space Telescope Science Institute, the National Aeronautics and Space Administration under Grant No. NNX08AR22G issued through the Planetary Science Division of the NASA Science Mission Directorate, the National Science Foundation under Grant No. AST-1238877, the University of Maryland, and Eotvos Lorand University (ELTE).
This paper makes use of software developed for the Large Synoptic Survey Telescope. We thank the LSST Project for making their code available as free software at (http://dm.lsst.org).
Appendix: i-band and 3.6 μm images
The i-band and 3.6 μm images of 49 objects, which are not shown in figure 2, are presented in the electronic version of this paper.


i-band (left) and 3.6 μm (right) images. Image size is 8″ × 8″. North is up and east is to the left. The position of the X-ray source is at the center of each panel. The circle of 4″ radius from the X-ray position is shown. The white rectangular region in the lower right part of the i-band image of J022154.7−032558 is an artifact due to background subtraction in the mosaicked image.
Footnotes
See also Surace, J. A., et al. (2005), “The SWIRE Data Data Release 2: Image Atlases and Source Catalogs for ELAIS-N1, ELAIS-N2, XMM-LSS, and the Lockman Hole.”
References
