


Abstract
We present the environmental dependence of color, stellar mass, and star formation (SF) activity in Hα-selected galaxies along the large-scale structure at z = 0.4 hosting twin clusters in the DEEP2-3 field, discovered by the Subaru Strategic Program of Hyper Suprime-Cam (HSC SSP). By combining photo-z-selected galaxies and Hα emitters selected with broadband and narrowband (NB) data from the recent data release of HSC SSP (DR1), we confirm that galaxies in higher-density environments or galaxies in cluster central regions show redder colors. We find that there still remains a possible color–density and color–radius correlation even if we restrict the sample to Hα-selected galaxies, probably due to the presence of massive Hα emitters in denser regions. We also find a hint of increased star formation rates (SFR) amongst Hα emitters toward the highest-density environment, again primarily driven by the excess of red/massive Hα emitters in high-density environments, while their specific SFRs do not significantly change with environment. This work demonstrates the power of the HSC SSP NB data for studying SF galaxies across environments in the distant universe.
1 Introduction
In the ΛCDM universe, small structures form first, and then they merge to form larger-scale systems. Clusters of galaxies are therefore the most massive systems in the universe, while clusters also grow into larger-scale structures (or super clusters) by merging themselves (Springel et al. 2005). It is well established that galaxy properties change significantly along the cosmic web, from rich clusters/groups to general fields. The well-known morphology–density (e.g., Dressler 1980; Goto et al. 2003; Bamford et al. 2009), color–density (e.g., Tanaka et al. 2004; Baldry et al. 2006; Haines et al. 2007), or star formation rate (SFR)–density (e.g., Lewis et al. 2002; Gómez et al. 2003) correlations seen in the local universe are expected to be established during the course of cluster-scale assembly. However, the key physical mechanisms responsible for the environmental effects (or environmental quenching) are still unclear.
Observations of large-scale structures in the distant universe provide us with a number of insights into how galaxies grow along the history of the formation of galaxy clusters or groups. The Subaru Prime Focus Camera (Suprime-Cam: Miyazaki et al. 2002) played an important role in identifying large-scale filamentary structures in the high-z universe, taking advantage of the wide field of view and large light-collecting power of the Subaru Telescope. Kodama et al. (2001), Tanaka et al. (2005), and Koyama et al. (2008) studied the color–density relation for galaxies around rich X-ray-selected clusters at z = 0.4–0.8 with Suprime-Cam, and all of these studies demonstrate that galaxy colors start changing at relatively low-density groups or filaments, suggesting that galaxy transition takes place not only in extremely high-density environments like X-ray luminous cluster cores, but also in relatively poor group-scale environments.
Narrowband (NB) imaging, in particular combined with a wide-field camera such as Suprime-Cam, is an efficient and powerful approach in identifying star-forming (SF) galaxies along the cosmic web in the distant universe based on their strong emission lines (e.g., Shimasaku et al. 2003; Kodama et al. 2004; Hayashino et al. 2004; Matsuda et al. 2004, 2011; Ouchi et al. 2005; Ideue et al. 2009; Hayashi et al. 2010; Koyama et al. 2011; Sobral et al. 2011; Tadaki et al. 2012; Yamada et al. 2012; Toshikawa et al. 2012; Kajisawa et al. 2013; Darvish et al. 2014; Shimakawa et al. 2017; Stroe et al. 2017). Unlike multi-object spectroscopy, the NB imaging technique allows one to construct a complete sample of galaxies down to a certain level of emission line flux (hence SFR) over the observed field of view. Because emission line fluxes, most preferably the Hαλ6563 emission line, can be directly translated into SFRs, we can study galaxies along the large-scale structures in the distant universe in a more quantitative way than the simple broadband color approaches which suffer from degeneracy between age, metallicity, and dust extinction. It is true that even the Hα line could significantly underestimate SFRs due to dust extinction for extremely dusty and/or highly star-bursting populations (e.g., Puglisi et al. 2017), but the NB Hα survey is still the most efficient way to study SF galaxies within a narrow redshift slice.
Koyama et al. (2011) performed a wide-field NB Hα imaging survey of a very rich cluster at z = 0.4 (Abell 851) using Suprime-Cam, and found that star-forming galaxies showing red colors are strongly clustered in group-scale environments in the cluster outskirts. Our follow-up study using Spitzer mid-infrared data showed that those red star-forming galaxies are dusty red galaxies, as many of them are individually detected at 24 μm (Koyama et al. 2013). They also showed evidence that Hα-selected galaxies in z = 0.4 cluster environments are more highly obscured by dust than field counterparts at fixed stellar mass, by comparing their average IR-based and Hα-based SFRs. Sobral et al. (2016) also independently confirmed this trend using Balmer decrement analysis (Hβ/Hα ratio) with optical spectroscopic observations of the same targets.
Star-forming galaxies in general exhibit a tight correlation between SFR and stellar mass (M⋆)— the so-called SF main sequence. The location of the SF main sequence changes with cosmic time (e.g., Daddi et al. 2007; Elbaz et al. 2007; Whitaker et al. 2012; Speagle et al. 2014), while there is very little environmental dependence at fixed redshift (e.g., Peng et al. 2010; McGee et al. 2011; Koyama et al. 2013, 2014; Lin et al. 2014; Darvish et al. 2016; Duivenvoorden et al. 2016; Wagner et al. 2017). Koyama et al. (2013) compared the SFR–M⋆ relation for Hα-selected galaxies in clusters and fields at z = 0.4–2.2, and concluded that the environmental variation of the SF main sequence is always small over the last ∼10 Gyr (with ∼0.2 dex at maximum). However, because of the limited sample size of Hα galaxies available in distant clusters, their work is based on a comparison between cluster galaxies (defined as those within 2 Mpc of the clusters) and field Hα emitters (selected from HiZELS: Sobral et al. 2013). Extending the study with larger emission-line galaxy samples, covering a wide environmental range from rich clusters to isolated field environments, is thus an essential step toward understanding the effects of environment more globally, more completely, and in a more unbiased way.
As the successor of Suprime-Cam, the new Subaru wide-field optical camera, Hyper Suprime-Cam (HSC: Miyazaki et al. 2018), can now provide us with an ideal tool for studying galaxy environments in the distant universe. Because large-scale structures in the intermediate-redshift universe (at z ∼ 1) are known to be extended over a few degrees scale on the sky (e.g., Nakata et al. 2005; Tanaka et al. 2009), the unprecedentedly wide field coverage (1|${^{\circ}_{.}}$|5) of HSC allows one to efficiently study galaxies across a wide environmental range. In this paper, we present an initial result on the environmental dependence of the properties of star-forming galaxies based on Hα-selected galaxies at z = 0.4 selected with broadband and narrowband data from the recent data release of the HSC Subaru Strategic Program (SSP: Aihara et al. 2018a, 2018b). The goal of this paper is to study color, stellar mass, and star-forming activity in galaxies over the huge cosmic web at z = 0.4, by taking full advantage of the new HSC data.
This paper is organized as follows. In section 2, we briefly describe the HSC SSP survey data used in this study, and summarize our z = 0.4 Hα emitter sample in the DEEEP2-3 field. Our main results are presented in section 3. In subsections 3.1 and 3.2, we present a newly discovered super structure at z = 0.4 in the DEEP2-3 field hosting twin clusters revealed by the HSC-SSP survey, and define the environment based on the local galaxy number density and the distance to the twin clusters. After presenting the color–density and color–radius relations for all z ∼ 0.4 galaxies in subsection 3.3, we discuss in subsections 3.4 and 3.5 the environmental dependence of various properties amongst Hα-selected galaxies along the z = 0.4 cosmic web. In subsection 3.6, we compare our results with previous studies focusing on the environmental effects on star-forming galaxies. In subsection 3.7, we discuss the effects of more local environments by studying the properties of Hα galaxies as a function of the distance to their nearest-neighbor galaxy. Finally, we describe our conclusions in section 4. Throughout the paper, we adopt the cosmological parameters of ΩM = 0.3, ΩΛ = 0.7, and H0 = 70 km s−1 Mpc−1, which gives a 1″ scale of 5.4 kpc at z = 0.4. All magnitudes are given in the AB system, and we assume the Salpeter initial mass function (IMF: Salpeter 1955) throughout the paper.
2 Data
2.1 Selection of Hα emitters in the DEEP2-3 field from HSC-SSP narrowband imaging data
We use the broadband (grizy) and narrowband (NB921) photometric catalogs from the internal data release of the HSC SSP (S15B) released in 2016 January (Aihara et al. 2018b). Hayashi et al. (2018) used this dataset to identify narrowband excess galaxies over 16.2 deg2 in all HSC Ultra-Deep/Deep fields. We refer to Hayashi et al. (2018) for details of the procedure of emission-line galaxy selection, but we briefly summarize here our methodology to select Hα emitters at z = 0.4 from NB921 data in the DEEP2-3 field covering 5.6 deg2 around (RA = 352|${^{\circ}_{.}}$|2, Dec = −0|${^{\circ}_{.}}$|2). This field is one of the HSC-Deep survey layers, where we find a significant over density of Hα emitters at z ∼ 0.4 (subsection 3.1). We note that the central wavelength of the NB921 filter is 9214 Å with a filter width of 135 Å, corresponding to an Hα redshift range of z = 0.393–0.414.
We first note that the HSC pipeline (hscPipe: Bosch et al. 2018) provides various types of photometric magnitudes in the original HSC catalog. In this paper, following Hayashi et al. (2018), we use cmodel magnitudes, computed by fitting the bulge and disk components for individual sources by taking into account the point spread function variation (see Bosch et al. 2018 for more details on the HSC data processing). There are two types of cmodel magnitudes: “unforced” and “forced” photometry. The former is independent measurements for individual sources at their position in each band, while the latter performs photometry at the fixed position of the sources determined in the i-band data.1 Following Hayashi et al. (2018), we use cmodel “unforced” magnitudes for selecting NB emitters, while we use cmodel “forced” magnitudes when we measure broadband colors.
Figure 1 shows the narrowband excess (|$m_{\mathit {NB921},{\rm cont}} - m_\mathit {NB921}$|) against the NB921 magnitudes for galaxies in the DEEP2-3 field. To ensure completeness, we apply a magnitude cut of NB921 < 23.5 mag (as shown with the vertical dashed line in figure 1).2 Furthermore, we also apply broadband magnitude cuts of g < 26.8, r < 26.6, i < 26.5, z < 25.6, and y < 24.8, which correspond to the 5 σ limiting magnitude of the HSC-Deep broadband data. We find that the broadband data are deep enough, and >99% of the sources with NB921 < 23.5 satisfy the above broadband criteria.
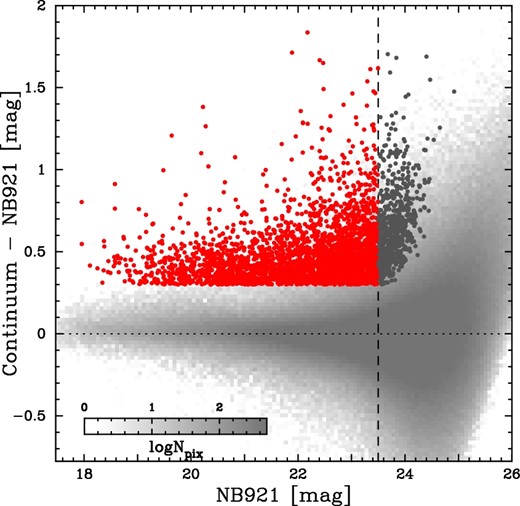
Narrowband excess (with respect to the continuum magnitude) plotted against the NB921 magnitudes for galaxies in the DEEP2-3 field. The red and dark gray data points show the Hα emitters at z = 0.4 selected by Hayashi et al. (2018) with NB921 < 23.5 and NB921 > 23.5, respectively. We note that galaxies with NB921 < 23.5 are used in this study. The background gray scale shows the distribution of all galaxies in the DEEP2-3 field. To make this gray-scale plot, we apply 120 × 120 gridding and count the number of data points in each pixel. We follow this strategy in the following plots, by adjusting the grid size according to the number of data points in each plot. (Color online)
For the NB921 emitters selected above, Hayashi et al. (2018) determined the redshift of each galaxy by investigating their spectroscopic redshifts (zspec), photometric redshifts (zphot), and broadband colors. As a sanity check, we show in figure 2 (left) the photo-z distribution of the NB921 emitters in the DEEP2-3 field computed by the “DEmP” code (Hsieh & Yee 2014). It is expected that the majority of the NB921 emitters are Hα emitters at z ∼ 0.4, Hβ/[O iii] emitters at z ∼ 0.8, or [O ii] emitters at z ∼ 1.5, which is recognized as three redshift peaks in the gray histogram in figure 2 (left). For the NB921 emitters whose photo-zs are not consistent with z = 0.4, we investigate their broadband colors to “rescue” possible Hα emitters. Figure 2 (middle) shows the g − r versus r − z diagram for all NB921 emitters in the DEEP2-3 field, where we show the color criteria to select Hα emitters defined by Hayashi et al. (2018) (dotted lines). The Hα emitters at z = 0.4 (shown with red circles) are distributed at the top-left corner of this plot, and are well separated from other line emitters at different redshifts (shown with gray scale).
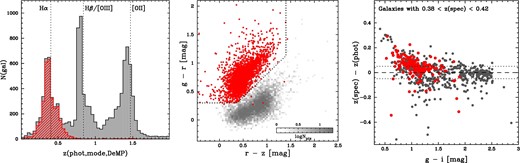
Left: Distribution of photo-z for all NB921 emitters (gray histogram) and the Hα emitters at z = 0.4 selected by Hayashi et al. (2018) (red hatched histogram). Middle: Color–color diagram (g − r versus r − z) for the Hα emitters with NB921 < 23.5 (red circles) and all possible NB921 emitters in the DEEP2-3 field (in gray scale). Right: Difference between zspec and zphot plotted against g − i colors for galaxies with spectroscopic redshift of 0.38 < zspec < 0.42 in the DEEP2-3 field. The red symbols show the spectroscopically confirmed Hα emitters at z = 0.4 in the same field. The horizontal dotted lines (Δzphot = ±0.05) show our photo-z slice applied to select photometric members in this paper. (Color online)
With these procedures, we finally identify 3085 Hα emitters at z = 0.4 in the DEEP2-3 field. In this paper, we use this unprecedentedly large Hα emitter sample selected from a contiguous area on the sky to study the environmental dependence of the properties of Hα galaxies along the cosmic web. We note that the current sample may include AGNs. Hayashi et al. (2018) matched the NB emitters in the COSMOS field (selected in the same way as presented here) with the deep Chandra X-ray source catalog available in the COSMOS field (Marchesi et al. 2016), and found that only ∼0.1% of the NB emitters have X-ray counterparts. However, this provides a lower limit for the AGN fraction, because not all AGNs have X-ray emission (e.g., Garn et al. 2010; Calhau et al. 2017). Broad-line optical AGNs may still have a significant contribution, particularly at the luminous end of Hα emitters (Sobral et al. 2016). Unfortunately, it is not possible to identify/remove individual AGNs from our Hα emitter sample in the DEEP2-3 field, and we should keep in mind that some of the environmental trends that we discuss in the following sections may be contributed by AGNs.
2.2 Photometric redshift sample
In addition to the Hα emitters selected above, we also make use of the photometric redshift (of non-emitters) to trace large-scale structures at z = 0.4. Photometric redshifts of HSC sources have been published by several authors using independent photo-z codes (Tanaka et al. 2018). In this paper, we use the S15B version of photo-z from the DEmP3 code (Hsieh & Yee 2014), which seems to provide the most reliable redshifts for red galaxies at z ∼ 0.4, although we verify that our results do not change depending on the choice of photo-z code.
We note that photometric redshifts estimated from optical five-band data alone may not be accurate enough, particularly for star-forming galaxies with blue flat spectral energy distributions (SEDs). This trend is seen in our sample, as demonstrated in figure 2 (right), where we plot the difference between zphot (derived with the DeMP code) and zspec against their g − i colors for spectroscopically confirmed galaxies at 0.38 < z < 0.42 in the DEEP2-3 field available from the DEEP2 redshift survey (Davis et al. 2003; Newman et al. 2013) and the PRIMUS survey (Coil et al. 2011; Cool et al. 2013).
In this study, we apply a simple photo-z cut of zphot = 0.40 ± 0.05 to select “member” galaxies associated with the z = 0.4 structure [as shown with the horizontal dotted lines in figure 2 (right)]. With this photo-z cut, we can select the majority (∼75%) of real members with g − i > 2.0, while we tend to miss a relatively large fraction (∼60%) of blue member galaxies with g − i ≲ 1.5. An important advantage of the NB imaging approach is that we can recover a large fraction of blue star-forming galaxies without broadening the width of the photo-z slice.
Our final sample includes 29088 galaxies within the photo-z slice of zphot = 0.40 ± 0.05 (with NB921 < 23.5 mag), and we also include 3085 Hα emitters regardless of their photo-z. Because 1235 (∼40%) of the Hα emitters satisfy the photo-z criteria (i.e., overlapped), our final sample includes 30938 galaxies in total. The photo-z criteria applied here may still be too wide to trace a single structure, but we need to compromise here; i.e., a narrower photo-z slice would miss a large fraction of real members, while a wider photo-z cut would result in a significant level of contamination from non-member galaxies. We note, however, that our conclusions do not change much even if we apply narrower/broader photo-z cuts, because the main goal of this work is to study the environmental dependence of Hα-selected galaxies. In this paper, we use the photo-z selected galaxies to map the large-scale structures and to check their color–density correlation.
3 Results and discussion
3.1 A super structure hosting twin clusters at z = 0.4 in the DEEP2-3 field
In figure 3, we show the locations of Hα emitters (dots) on top of the 2D distribution of all photo-z selected galaxies (color contours). There are strong density peaks at around CL1 = (RA1, Dec1) = (352|${^{\circ}_{.}}$|33, +0|${^{\circ}_{.}}$|135) and CL2 = (RA2, Dec2) = (352|${^{\circ}_{.}}$|096, +0|${^{\circ}_{.}}$|390), both of which are also identified as clusters at z ∼ 0.4 by Oguri et al. (2018) using their red-sequence-finding algorithm camira (Cluster-finding Algorithm based on Multi-band Identification of Red-sequence gAlaxies; see Oguri 2014). A strong concentration of Hα emitters around the two clusters suggests that the redshifts of these two clusters are very close, and they are likely to be physically associated with each other. There are two similar levels of prominent over-densities at the north-east and at the south edge of the field (shown as CL3 and CL4 in figure 3), although these structures are not identified as camira clusters.
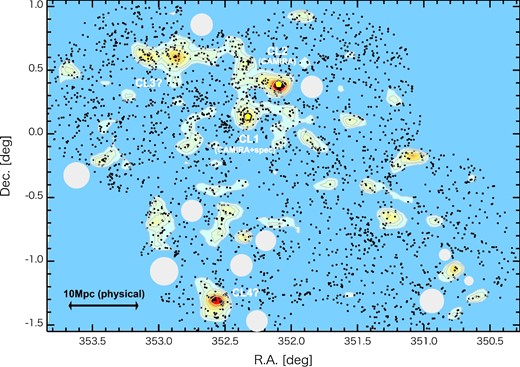
Two-dimensional distribution of Hα emitters in the HSC DEEP2-3 field. The small circles indicate the positions of Hα emitters. The colored contours indicate 1 σ, 1.5 σ, 2 σ, 3 σ, 4 σ, 5 σ above the mean density distribution computed with all member galaxies (i.e., the photo-z-selected sample and Hα emitters). Here we apply Gaussian smoothing for all the data points with σ ∼ 0.75 Mpc, and co-add the tail of the Gaussian wing at each position. The two yellow pentagons indicated as CL1 and CL2 show the locations of two CAMIRA clusters at z ∼ 0.4 identified by the red-sequence finder method by Oguri et al. (2018). Possible strong over-densities are also seen at the north-east and at the south edge of the field (CL3 and CL4). They are also likely to be in the same structure as CL1/CL2, but CL3/CL4 are not identified as CAMIRA clusters, and unfortunately there are no galaxies with spectroscopic redshift available around CL3/CL4 region. The large gray circles show the object masks; we show only large masks with radius of >2΄ for clarity. (Color online)
The CL1 region is partly overlapped with the area of the DEEP2 redshift survey (Davis et al. 2003; Newman et al. 2013) and the PRIMUS survey (Coil et al. 2011; Cool et al. 2013). We show in figure 4 the spec-z distribution of galaxies located within 1.5 Mpc of the CL1 position suggested by Oguri et al. (2018). There is a clear redshift spike at z = 0.4067, which is consistent with the redshift estimate by Oguri et al. (2018), and is perfectly matched to the Hα redshift of the NB921 filter. We find that the velocity dispersion of this cluster is σ ∼ 1389 km s−1, which can be converted to a cluster mass of M200 ∼ 4 × 10¹⁵ M⊙, assuming that the cluster is virialized (Koyama et al. 2010). We caution that the estimated cluster mass may be overestimated, because CL1 is likely to be an unvirialized system under cluster–cluster merger (with CL2). This is a common problem when deriving the mass of unvirialized clusters using velocity dispersion. An independent measurement with, e.g., X-ray observation is needed to determine its cluster mass.
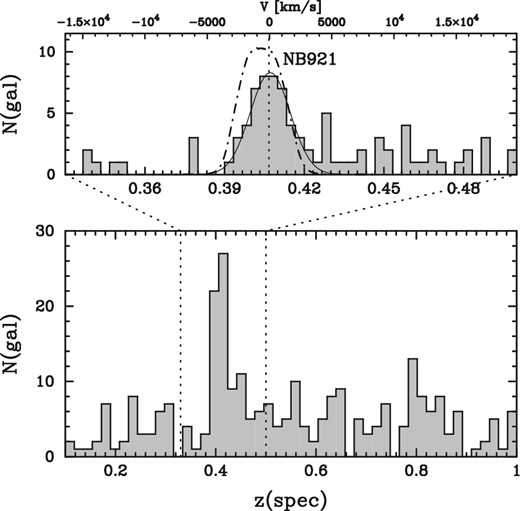
Redshift distribution of galaxies with spectroscopic redshifts within 1.5 Mpc (or correspondingly 4|${^{\prime}_{.}}$|6) from the center of CL1. In the top panel, we show the result of Gaussian fitting around the redshift spike (solid line). The cluster redshift is determined to be z = 0.4067, with a velocity dispersion of 1389 km s−1. The dot-dashed curve shows the NB921 filter transmission curve corresponding to their Hα redshift.
Although further spectroscopic observation is needed to firmly conclude the physical association between the four candidate clusters reported here, we can at least say that all the density peaks are located within ±2000 km s−1, because all of these structures harbor an over-density of Hα emitters. We believe that they are organizing a single gigantic structure at z = 0.4.
3.2 Definition of environment
In this study, we define the environment of each galaxy with two different approaches. The first approach is to use the local galaxy number density. By using all the member galaxies (i.e., all photo-z-selected galaxies and Hα emitters), we first compute the distance to its fifth nearest-neigbor galaxy for each galaxy (r5th), and define the local density as |$\Sigma _{\rm 5th} = 5/\pi r_{\rm 5th}^2$|. The second approach is to use the projected distance to the twin clusters discovered in subsection 3.1 (Rcl). We compute the projected distance from each member galaxy to CL1 and CL2 (R1 and R2), and we define Rcl = min (R1, R2).
We note that there are advantages/disadvantages of each method (see the detailed discussion by, e.g., Muldrew et al. 2012; Darvish et al. 2015). The Rcl approach is simple and easily reproducible, but it is not possible to take into account smaller structures (groups or filaments) along the large-scale structures. For example, the same value of Rcl for different galaxies does not necessarily indicate that they belong to a similar parent halo. On the other hand, the local density approach is sensitive to all possible structures, while it is also sensitive to the photo-z slice, and will potentially detect over-densities of galaxies at slightly different redshifts as long as we rely on photometric redshifts. We emphasize that the two approaches can complement each other: the Rcl approach can be used to study the more global environment, while the Σ5th approach is suited to study local environmental effects.
3.3 Color–density and color–radius correlation with all galaxies at z = 0.4
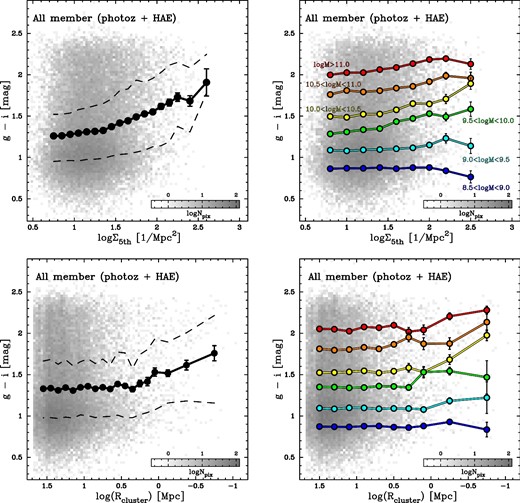
Colors (g − i) of all member galaxies plotted against local density Σ5th (top panels) and the distance to the twin clusters (bottom panels). The left panels show the results for all galaxies, with running average (±standard error computed as |$\sigma /\sqrt{N}$| for each subsample). The black dashed lines show the 25th and 75th percentile distribution in each environment bin. Galaxies in higher-density environments (or those with a smaller distance to the twin clusters) tend to show redder colors, demonstrating that our environment definition works reasonably well. The right panels show the results by splitting the sample into six stellar mass bins as indicated in the plot. The trend becomes much milder (or almost disappears) at fixed stellar mass, although there still remains a hint of correlation between color and environment, particularly for massive galaxies. The bin sizes for computing the running average are determined so that each environment bin includes a minimum sample size of N = 5. We follow this requirement in all the similar plots presented in this paper. (Color online)
In figure 5, it is shown that galaxies in higher-density environments (or galaxies located closer to the twin clusters) tend to have redder colors, demonstrating that our definitions of environment work reasonably well. It is also demonstrated in figure 5 (right) that more massive galaxies are always redder in all environments. It seems that there still remains a weak, marginal correlation between color and environment at fixed stellar mass, particularly for galaxies with a stellar mass range of 9.5 ≲ log (M⋆/M⊙) ≲ 10.5 (as far as we only focus on the average colors), while low-mass galaxies with log (M⋆/M⊙) ≲ 9.5 are exclusively blue regardless of their environment, although a larger sample would be required to confirm the different behavior of different stellar mass bins.
3.4 Environmental dependence of colors of Hα-selected galaxies
In the remainder of this paper, we study the color, stellar mass, and star-forming activity of Hα-selected galaxies as a function of environment (Σ5th and Rcl). Figure 6 shows g − i colors of Hα emitters against their local density (top panels) and cluster-centric radius (bottom panels). As we did in figure 5, the left panels show the results for all Hα emitters, while the right panels show the results for different stellar mass bins.
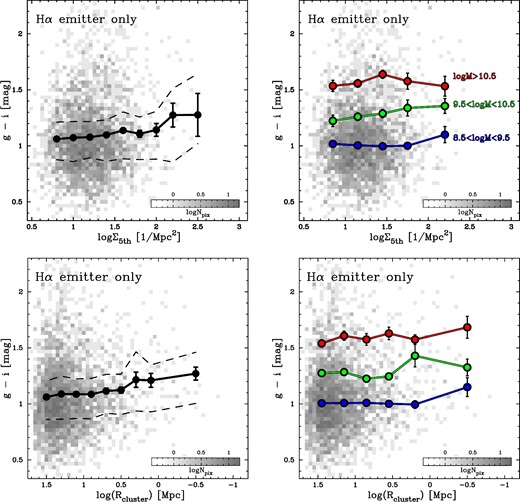
Colors (g − i) of Hα emitters against their local density (top panels) and distance to the twin clusters (bottom panels). The left panels show the results for all Hα emitters. The black solid line shows the running average (±standard error computed as |$\sigma /\sqrt{N}$|), while the black dashed lines show the 25th and 75th percentile distribution. The right panels show the results for Hα emitters in three different M⋆ bins with their running average. (Color online)
Figure 6 demonstrates that there might remain color–density and color–radius trends for Hα-selected galaxies; i.e., Hα emitters in higher-density environments (or those located closer to the cluster central regions) tend to show redder colors than Hα emitters in under-dense regions on average, although the trend becomes much milder (or almost disappears) compared with what we reported for all member galaxies in figure 5. In particular, the right panels of figure 6 demonstrate that the color–density and color–radius relations do not exist any more when we fix their stellar mass.
The right panels of figure 6 also show that more massive Hα emitters have redder colors, irrespective of environment. It is therefore expected that the possible color–density or color–radius correlations amongst Hα emitters that we see marginally in figure 6 are driven by the stellar mass difference of Hα galaxies in different environments. To test this possibility, we plot in the left and middle panels of figure 7 the stellar mass of Hα emitters against their environment. Although the statistics are very poor again, as we suspected, Hα emitters in higher-density environments tend to be more massive. A question here is whether or not this stellar mass difference can explain the color–density trend we reported in figure 6. In the right panel of figure 7, we show the M⋆ of Hα emitters against their g − i colors. It is clear that there is a strong correlation between M⋆ and color, and we expect that this color–M⋆ correlation for Hα emitters can be a major driver of the weak color–density or color–radius correlations amongst Hα emitters reported in figure 6 (see also, e.g., Hogg et al. 2004; Baldry et al. 2006; Scodeggio et al. 2009; Moresco et al. 2010; Darvish et al. 2015).
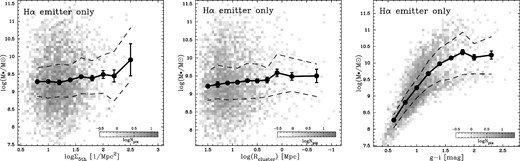
Stellar mass of Hα emitters as a function of Σ5th (left), cluster-centric radius (middle), and g − i colors (right). The running average (with its standard error), as well as 25% and 75% distribution, are shown in each panel. There seems to be a marginal trend that M⋆ increases toward high-density environments, while the significance is very low considering the systematic uncertainties in deriving stellar mass (see subsection 3.3). The right-hand panel shows a strong correlation between M⋆ and the colors of Hα emitters, suggesting that the possible color–density and color–radius correlation for Hα emitters reported in figure 6 can be at least partly driven by the massive Hα emitters in the high-density environment.
3.5 Hα-based star formation activity of galaxies along the huge cosmic web
For dust extinction correction, we use the recipe to predict Hα dust extinction (AHα) from stellar mass (M⋆) and EWrest(Hα) established by Koyama et al. (2015):
Figure 8 shows Hα-derived SFRs of Hα emitters against their local density (Σ5th; top panels) and the distance to the twin clusters (Rcl; bottom panels). Although the trend is not significant, we find a possible increase of average SFRHα of Hα galaxies toward high-density cluster environments (i.e., a “reversal” of the SFR–density correlation), likely reflecting the fact that Hα emitters in high-density environments are more massive, as reported in figure 7, and perhaps dustier (Koyama et al. 2013; Sobral et al. 2016). However, we note that this marginal trend disappears when we fix the stellar mass [figure 8 (right)]. We also note that, as we mentioned in subsection 2.1, some of the massive, luminous Hα emitters in high-density environments which seem to contribute to the different nature of Hα galaxies in the highest-density environments could be contributed by AGNs.
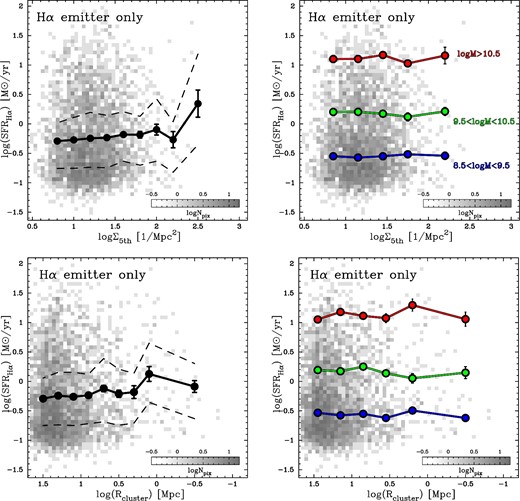
SFR of Hα emitters (after dust extinction correction) plotted against their local density (top panels) and the distance to the twin clusters (bottom panels). The left panels show the results for all Hα emitters, while the right panels show the results of splitting the sample into three M⋆ bins as indicated in the panel. The left panels suggest a possible increase of the average SFR toward high-density environments, while the trend becomes much milder (or disappears) at fixed stellar mass (right panels). (Color online)
We also show in figure 9 the specific SFRs (=SFRHα/M⋆) of Hα emitters against their environment. The left panels of figure 9 show the results for all Hα emitters, while the right panels show the results by splitting the sample into three stellar mass bins. In the left panels of figure 9, we find no significant environmental difference in the average specific SFRs of Hα emitters. There might be a weak, marginal decrease of specific SFR toward high-density cluster environments, but the difference (if any) is only at the ∼0.1–0.2 dex level at maximum.
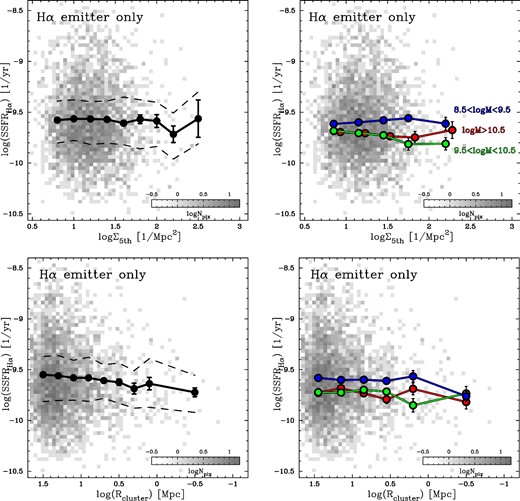
As figure 8, but for the specific SFR of Hα emitters. The bottom-left panel suggest a possible decline in the specific SFR toward high-density, cluster environments (by 0.1–0.2 dex), while the trend becomes much milder (or disappears) at fixed stellar mass (right panels). (Color online)
As shown in the right panels of figure 9, it is also important to note that the trend becomes much less significant (or disappears) if we fix their stellar mass. This is another manifestation of the environmental independence of the star-forming main sequence reported by many recent studies (section 1). We recall that Hα emitters in higher-density environments could be more massive (as reported in figure 7), and as shown in the right panels of figure 9, the specific SFRs of massive Hα emitters tend to be slightly lower. We therefore suggest that the possible decline in the specific SFR reported in the bottom-left panels of figure 9 is primarily driven by the small excess of red/massive Hα emitters in high-density environments, as reported in the previous sections.
3.6 Comparison with other studies on environmental impacts on star-forming galaxies
In this paper, we suggest a possible environmental dependence of colors of Hα emitters in the sense that Hα emitters in higher-density environments tend to show redder colors than those in low-density environments (subsection 3.4). This result is consistent with our previous work focusing on a single cluster at a similar redshift, where we showed an enhanced red Hα emitter fraction in high-density environments (Koyama et al. 2011). We reported that the possible color–density trend amongst Hα-selected galaxies seems to be largely driven by the increase of stellar mass of Hα emitters toward high-density environments (suggesting a dominant role of stellar mass controlling the environmental dependence of various galaxy properties; Muzzin et al. 2012; Sobral et al. 2011; Darvish et al. 2016; Smethurst et al. 2017). We also find that the average SFRs of Hα emitters slightly increases toward high-density environments (subsection 3.5), which is also consistent with some other studies at z ∼ 1 (e.g., Elbaz et al. 2007; Cooper et al. 2008; Li et al. 2011; Koyama et al. 2013).
The environmental independence of specific SFR at fixed stellar mass (subsection 3.5) is also consistent with many recent studies claiming no or little environmental dependence of the SF main sequence (e.g., Balogh et al. 2004; Peng et al. 2010; Wijesinghe et al. 2012; Muzzin et al. 2012; Koyama et al. 2013; Lin et al. 2014; Stroe et al. 2015; Darvish et al. 2016). However, we should note that some studies suggest a possible decline in the SF activity of cluster/group SF galaxies in both the low-z and high-z universe (Vulcani et al. 2010; von der Linden et al. 2010; Haines et al. 2013; Lin et al. 2014; Ziparo et al. 2014; Tran et al. 2015; Allen et al. 2016; Paccagnella et al. 2016; Jian et al. 2018). Although the differences in sSFR between cluster and field galaxies suggested by these studies are not large (∼0.1–0.3 dex levels), it may be important to understand the possible biases associated with each study.
We expect that there are many possible causes of this discrepancy: e.g., different procedure of SF galaxy selection, different definition of environment, different stellar mass range, or different method of SFR measurement exploited by different authors (see also Darvish et al. 2016; Tran et al. 2017). The NB-based Hα approach (like our current work) tends to select galaxies with high EW(Hα) by its nature, and potentially misses low-EW(Hα) galaxies, while an important advantage of an Hα-selected sample is that they do not suffer from contamination due to photo-z error (section 2). Also, Hα-based SFRs are advantageous in that they can provide more direct measurements of SFRs compared to SED-based (or color-based) SFRs, but a potential problem is that there always remain uncertainties regarding the [N ii] line contribution and/or dust extinction correction.
A potentially interesting implication from recent studies (including our current work) is that the effect of environment acts on galaxy colors, mass, or some other spectroscopic properties. For example, dust extinction levels of SF galaxies are higher in higher-density environments (Koyama et al. 2013; Sobral et al. 2016), with potentially higher dust temperatures (Rawle et al. 2012; Matsuki et al. 2017). Some spectroscopic studies also suggest higher gas-phase metallicity in cluster SF galaxies than those in field galaxies (Ellison et al. 2009; Kulas et al. 2013; Shimakawa et al. 2015; Darvish et al. 2015), although environmental impacts on the chemical abundance or dust properties in star-forming galaxies are still under debate (e.g., Patel et al. 2011; Noble et al. 2016; Valentino et al. 2015). Furthermore, Darvish et al. (2015) showed that galaxies in high-density environments show significantly lower electron densities compared with field galaxies. In these ways, our focus is now shifting from simple comparison between cluster galaxies and field galaxies on the SFR–M⋆ diagram to unveiling the environmental effects on other important parameters of galaxies. We believe that future spectroscopic surveys with the Prime Focus Spectrograph (PFS) on Subaru, or wide-field MIR–FIR survey of this field, will allow a more complete census of SF activity in individual galaxies across environments.
3.7 The role of global and local environment
We used the local galaxy number density (Σ5th) and the distance to the twin clusters (Rcl) as indicators of environment in this study. For the results presented throughout this section, it seems that the choice of environmental definition does not strongly affect our results, but it is also interesting to investigate the different roles of Σ5th and Rcl. We attempt this in figure 10 by plotting average color, mass, and sSFR of Hα emitters on the Σ5th–Rcl plane. This plot visually demonstrates that all these galaxy quantities change near the cluster central regions (Rcl ≲ 1 Mpc) and high-density environments (Σ5th ≳ 1.8–2.0), suggesting that the local and global environments both play an important role (see consistent results by, e.g., Balogh et al. 2004; Fadda et al. 2008; Alpaslan et al. 2016), although the relative importance of the local/global environment is not fully understood (e.g., Kauffmann et al. 2004; Blanton et al. 2006; Cucciati et al. 2010).
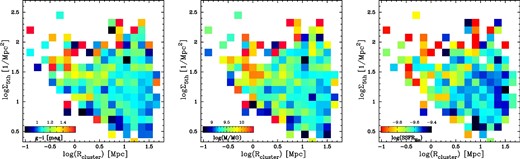
Relation between the local galaxy density (Σ5th) and cluster-centric radius (Rcl) for Hα emitters. The color coding indicates g − i color (left), stellar mass (middle), and specific SFR (right). We apply 20 × 20 gridding and compute the average value in each grid. This plot visually demonstrates that both the local galaxy density and the distance to the cluster can affect the physical quantities studied here (color, mass, sSFR). (Color online)
To study the effect of “more local” environments, we compute here the distance to the nearest-neighbor Hα emitter (Dnearest) of individual Hα emitters, and study their properties as a function of Dnearest. This is another advantage of an NB imaging survey; this kind of analysis is highly uncertain with photo-z information alone because of the increased chance of projection effects. The NB-based Hα emitter samples presented in this study are expected to be within a very narrow redshift slice, and we can more reliably use the projected distance to search for a close companion. In the left panel of figure 11, we plot the specific SFRHα of all Hα emitters as a function of Dnearest. Although the trend is weak again, there might be a mild increase of the specific SFR for Hα emitters having a close companion emitter within ∼30 kpc. This result suggests that SF activity is elevated in interacting systems, while it may be interesting to note that massive Hα emitters show different behavior (see the right panel of figure 11). Unfortunately, with the current sample size, it is not possible to go further into the detail of the nature of Hα emitter pairs (and their relation to their global environment), but we stress that the HSC NB data is ideally suited for this purpose, and it is clearly important future work for us after the HSC survey is completed.
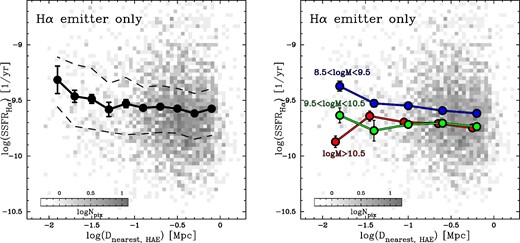
Left: Specific SFRHα plotted against the distance to the nearest-neighbor Hα emitter of each Hα emitter. The meanings of the symbols are the same as the previous figures. Right: The same plot for three stellar mass bins. (Color online)
4 Conclusions
Using the broadband and narrowband (NB921) data from the internal release of the HSC SSP survey (DR1_S15B), we have presented the initial results on the environmental dependence of properties of Hα-selected galaxies at z = 0.4 along the cosmic web over >5 deg2 in the DEEP2-3 field. Our results are summarized as follows:
By mapping the Hα emitters selected by Hayashi et al. (2018) and photo-z-selected galaxies at z ∼ 0.4, we have identified prominent structures hosting (at least) two clusters at z = 0.4 in the DEEP2-3 field. These two clusters are independently identified with a red-sequence finder method by Oguri et al. (2018), for one of which we have confirmed their physical association by using the zspec information available in this paper.
We have defined the environment of galaxies using the local galaxy number density (Σ5th) and the distance to the twin clusters (Rcl). We have confirmed that galaxies in higher-density environments, or galaxies with a smaller distance to the twin clusters, tend to show redder colors.
We have found a possible trend that Hα-selected galaxies in higher-density environments or in the cluster central region tend to show redder colors and higher SFRHα, likely driven by a mild increase of the average stellar mass of Hα galaxies toward high-density environments. This result implies that the “reversal” of the SFR–density correlation reported in the high-z universe can be driven by massive/red Hα galaxies in the highest-density environments, although the sample of Hα galaxies in the highest-density environments is currently too small.
We have found that the average specific SFRHα of Hα emitters does not significantly change with environment. Although there might be a marginal decline in the specific SFRs (by 0.1–0.2 dex levels at maximum) toward the highest-density cluster environments, the trend becomes much milder (or disappears) once we fix their stellar mass. This result is consistent with many recent studies claiming environmental independence of the SF main sequence.
There is a mild increase of specific SFR of Hα emitters for those having a close companion emitter within ≲30 kpc, suggesting elevated SF activity in galaxies due to galaxy–galaxy interaction processes.
This paper has demonstrated the power of HSC, in particular combined with its narrowband data, to study galaxy environments in the distant universe. By incorporating the future data release, we can extend the study toward more complete understanding of galaxy evolution across a wide environmental range from rich clusters, groups, and pairs to isolated galaxies.
Acknowledgements
We thank the referee for their careful reading and constructive comments, which improved the paper.
The Hyper Suprime-Cam (HSC) collaboration includes the astronomical communities of Japan and Taiwan, and Princeton University. The HSC instrumentation and software were developed by the National Astronomical Observatory of Japan (NAOJ), the Kavli Institute for the Physics and Mathematics of the Universe (Kavli IPMU), the University of Tokyo, the High Energy Accelerator Research Organization (KEK), the Academia Sinica Institute for Astronomy and Astrophysics in Taiwan (ASIAA), and Princeton University. Funding was contributed by the FIRST program from the Japanese Cabinet Office, the Ministry of Education, Culture, Sports, Science and Technology (MEXT), the Japan Society for the Promotion of Science (JSPS), the Japan Science and Technology Agency (JST), the Toray Science Foundation, NAOJ, Kavli IPMU, KEK, ASIAA, and Princeton University.
This paper makes use of software developed for the Large Synoptic Survey Telescope. We thank the LSST Project for making their code available as free software at http://dm.lsst.org.
The Pan-STARRS1 surveys (PS1) have been made possible through contributions of the Institute for Astronomy, the University of Hawaii, the Pan-STARRS Project Office, the Max-Planck Society and its participating institutes, the Max Planck Institute for Astronomy, Heidelberg and the Max Planck Institute for Extraterrestrial Physics, Garching, The Johns Hopkins University, Durham University, the University of Edinburgh, Queen’s University Belfast, the Harvard-Smithsonian Center for Astrophysics, the Las Cumbres Observatory Global Telescope Network Incorporated, the National Central University of Taiwan, the Space Telescope Science Institute, the National Aeronautics and Space Administration under Grant No. NNX08AR22G issued through the Planetary Science Division of the NASA Science Mission Directorate, the National Science Foundation under Grant No. AST-1238877, the University of Maryland, Eotvos Lorand University (ELTE), and the Los Alamos National Laboratory.
This work is based on data collected at the Subaru Telescope and retrieved from the HSC data archive system, which is operated by the Subaru Telescope and Astronomy Data Center, National Astronomical Observatory of Japan.
This work was financially supported in part by Grants-in-Aid for Scientific Research (Nos. 26800107, 26707006) from the Japanese Ministry of Education, Culture, Sports and Science.
Footnotes
For sources not detected in the i band, the pipeline attempts to determine the source position in the r-band image as the second priority; the priority is in the order of i, r, z, y, g. Because we apply a broadband magnitude cut (see subsection 2.1), all galaxies used in this paper are detected in the i band.
Following a recommendation by the photo-z code developing team, we use the mode of the probability distribution function of zphot for point estimates of photometric redshift.
We also confirm that the conclusions presented in this paper do not change if we derive the stellar mass of Hα emitters using the SED-fitting code “Mizuki” (by fixing their redshift at z = 0.4) developed by one of the authors (Tanaka 2015).
References
