-
PDF
- Split View
-
Views
-
Cite
Cite
Masahiro Tsujimoto, Kumiko Morihana, Takayuki Hayashi, Takao Kitaguchi, Suzaku and NuSTAR X-ray spectroscopy of γ Cassiopeiae and HD 110432, Publications of the Astronomical Society of Japan, Volume 70, Issue 6, December 2018, 109, https://doi.org/10.1093/pasj/psy111
Close - Share Icon Share
Abstract
γ Cas and its dozen analogs comprise a small but distinct class of X-ray sources. They are early Be-type stars with an exceptionally hard thermal X-ray emission. The X-ray production mechanism has been under intense debate. Two competing ideas are (i) the magnetic activities in the Be star and its disk, and (ii) the mass accretion onto the unidentified white dwarf (WD). We adopt the latter as a working hypothesis and apply physical models developed to describe the X-ray spectra of classical WD binaries containing a late-type companion. Models of non-magnetic and magnetic accreting WDs were applied to γ Cas and its brightest analog HD 110432 using the Suzaku and NuSTAR data. The spectra were fitted by the two models, including the Fe fluorescence and the Compton reflection in a consistent geometry. The derived physical parameters are in a reasonable range in comparison to their classical WD binary counterparts. Additional pieces of evidence in the X-ray spectra—partial covering, Fe L lines, Fe i fluorescence—were not conclusive enough to classify these two sources into a subclass of accreting WD binaries. We discuss further observations, especially long-term temporal behaviors, which are important to elucidate the nature of these sources, if indeed they host accreting WDs.
1 Introduction
γ Cas is a Be star with a spectral type B (B0.5 IVe) showing, at times, prominent emission lines including the Balmer series of H (Jaschek et al. 1981). The emission is considered to originate from the disk, the shell, or both around the rapidly spinning star with a significant mass loss. The source is recognized as an archetype of Be stars and has been studied in great detail in the near-infrared, optical, and ultraviolet bands.
In the X-ray band, however, γ Cas is quite anomalous. Previous observations (Mason et al. 1976; White et al. 1982; Murakami et al. 1986; Frontera et al. 1987; Horaguchi et al. 1994; Haberl 1995; Smith et al. 1998; Kubo et al. 1998; Owens et al. 1999; Robinson & Smith 2000; Robinson et al. 2002; N. Smith et al. 2004; den Hartog et al. 2006; Lopes de Oliveira et al. 2010; Shrader et al. 2015; Hamaguchi et al. 2016) revealed an X-ray luminosity of ∼1032–33 erg s−1, the lack of drastic flux variations such as X-ray outbursts, the presence of the Fe K complex resolved into three emission lines from highly ionized Fe (Fe xxv Heα and Fe xxvi Lyα respectively at 6.7 and 7.0 keV) as well as quasi-neutral Fe (Fe i Kα at 6.4 keV). It has an exceptionally high plasma temperature beyond ∼10 keV, which is unseen in other classes of early-type stars. These distinct characteristics are shared by a dozen other sources, which are called γ Cas analogs1 (Smith et al. 2016; Nazé et al. 2017). The brightest source next to γ Cas is HD 110432 (Smith & Balona 2006; Lopes de Oliveira et al. 2007; Torrejón et al. 2012; Smith et al. 2012). These two sources are used to derive general characteristics of this enigmatic class of sources with their sufficient brightness. We use this duo in the present study.
Over 20 years, there has been an intensive but inconclusive debate about the production mechanism of the hot plasma responsible for the hard thermal X-rays (Motch et al. 2015; Smith et al. 2016). Two competing ideas are (a) the magnetic activities of the Be star and its decretion disk (Robinson & Smith 2000), and (b) the accretion from the Be star to an unidentified white dwarf (WD: Haberl 1995; Kubo et al. 1998). The purpose of this paper is to adopt the latter as a working hypothesis and to investigate how much we can constrain the nature of WDs from X-ray spectroscopy if indeed γ Cas analogs are Be/WD binaries.
In fact, X-ray spectroscopy is one of the most powerful tools to reveal the properties of WDs in classical WD binaries comprised of a WD and a late-type star2 (Mukai 2017). A binary system is called a cataclysmic binary if the companion is a dwarf and a symbiotic star if the companion is a giant. Regardless of the spectral type and the luminosity class of the companion, however, X-rays are produced close to the surface of WDs and hence their spectral shape is primarily governed by the properties of WDs and how the X-ray plasma is fueled. Many physical models have been developed to describe X-ray spectra of different subclasses of classical WD binaries, which can constrain these properties.
The X-ray spectral modeling of γ Cas analogs is far behind these developments. In all previous work, the spectra were fitted only with phenomenological models comprised of several components of isothermal collisionally ionized plasma emission (White et al. 1982; Murakami et al. 1986; Horaguchi et al. 1994; Haberl 1995; Kubo et al. 1998; Owens et al. 1999; Robinson & Smith 2000; Torrejón & Orr 2001; N. Smith et al. 2004; Lopes de Oliveira et al. 2007; Torrejón et al. 2012; Shrader et al. 2015; Hamaguchi et al. 2016). Under the working hypothesis of this paper, we apply physical models developed for classical WD binaries to the two brightest γ Cas analogs. We then investigate if these two sources can be interpreted reasonably by any or none of the subclasses of WD binaries.
The structure, the strategy, and the conclusion of this paper are as follows. In section 2 we describe the instruments that we use for constructing the X-ray spectra of γ Cas and HD 110432. We choose the Suzaku and Nuclear Spectroscopic Telescope Array (NuSTAR) observatories because they cover a wide energy range, including the hard (>10 keV) band. The hottest component of the plasma, which is accessible in the hard band, is produced by converting all the available energy into heat in accreting WDs, hence it is most sensitive to the WD mass.
In section 3 we present the result of the spectral analysis. We employ two physical models routinely used to describe X-ray spectra of non-magnetic accreting WDs (subsection 3.1) and magnetic accreting WDs (subsection 3.2). WD binaries fueled by nuclear fusion—such as classical novae (Starrfield et al. 2016) or super-soft sources (Kahabka & van den Heuvel 1997)—do not share spectral and temporal characteristics with any of the γ Cas analogs, so we do not consider these possibilities.
In section 4 we discuss how much we learn by hypothesizing that γ Cas analogs are WD binaries. In subsection 4.1 we compare the result of these sources with classical WD binaries and show that they are reasonably interpreted within the range of accreting WD binaries. In subsection 4.2 we discuss whether the two γ Cas analogs are non-magnetic or magnetic. We examine additional pieces of evidence in the X-ray spectra, but none of them are conclusive enough to judge whether the two sources are non-magnetic or magnetic. In subsection 4.3 we discuss that further observations, especially of long-term temporal behavior, are important to elucidate the nature of these sources more, if indeed they host accreting WDs. The main results are summarized in section 5.
2 Observations and data reduction
We used the archival data of γ Cas with the Suzaku X-ray observatory (Mitsuda 2007) and NuSTAR (Harrison et al. 2013), and those of HD 110432 with Suzaku (table 1). No observation was made for HD 110432 with NuSTAR. The Suzaku data were presented previously in Torrejón, Schulz, and Nowak (2012), Shrader et al. (2015), and Hamaguchi et al. (2016), whereas the NuSTAR data are presented here for the first time. We used the HEADAS software package version 6.19 for the data reduction and the Xspec package version 12.9 for the spectral fitting throughout this paper.
| Object . | RA . | Dec . | Observatory/instrument . | Sequence . | Observation date . | t exp* . | CR† . |
|---|---|---|---|---|---|---|---|
| . | (J2000.0) . | . | number . | (UT) . | (ks) . | (s−1) . | |
| γ Cas | |${00^{\rm h}56^{\rm m}38{^{\rm s}}}$| | |${+60{^{\circ}}44^{\prime}08{^{\prime\prime}}}$| | Suzaku/XIS, PIN | 406040010 | 2011/07/13–14 | 55.4 | 11/0.59 |
| NuSTAR/FPMA, B | 30001147002 | 2014/07/24–25 | 31.0 | 6.5 | |||
| HD 110432 | |${12^{\rm h}42^{\rm m}50{^{\rm s}}}$| | |${-63{^{\circ}}03^{\prime}31{^{\prime\prime}}}$| | Suzaku/XIS, PIN | 403002010 | 2008/09/09–10 | 25.3 | 2.5/0.64 |
* Net exposure time.
† Source count rate of XIS (FI)/PIN for Suzaku and FPMA for NuSTAR in all energy bands.
| Object . | RA . | Dec . | Observatory/instrument . | Sequence . | Observation date . | t exp* . | CR† . |
|---|---|---|---|---|---|---|---|
| . | (J2000.0) . | . | number . | (UT) . | (ks) . | (s−1) . | |
| γ Cas | |${00^{\rm h}56^{\rm m}38{^{\rm s}}}$| | |${+60{^{\circ}}44^{\prime}08{^{\prime\prime}}}$| | Suzaku/XIS, PIN | 406040010 | 2011/07/13–14 | 55.4 | 11/0.59 |
| NuSTAR/FPMA, B | 30001147002 | 2014/07/24–25 | 31.0 | 6.5 | |||
| HD 110432 | |${12^{\rm h}42^{\rm m}50{^{\rm s}}}$| | |${-63{^{\circ}}03^{\prime}31{^{\prime\prime}}}$| | Suzaku/XIS, PIN | 403002010 | 2008/09/09–10 | 25.3 | 2.5/0.64 |
* Net exposure time.
† Source count rate of XIS (FI)/PIN for Suzaku and FPMA for NuSTAR in all energy bands.
2.1 Suzaku
Suzaku has two instruments in simultaneous operation: the X-ray Imaging Spectrometer (XIS: Koyama et al. 2007) and the Hard X-ray Detector (HXD: Kokubun et al. 2007; Takahashi et al. 2007). We use both instruments to cover a wide energy range of 0.5–70 keV using the screened events through the Suzaku processing pipeline version 2.7.16.30 with the standard set of event screening. The latest calibration databases (20160607 for XIS and 20110913 for HXD) were used.
2.1.1 XIS
We extracted the source events from a circle around the target with a 3΄ radius, whereas the background events from the remaining part of the XIS sensors excluding a 6΄ radius circle around the target, a 3΄ radius circle around the onboard 55Fe calibration sources, and field edges. γ Cas was bright enough to cause a slight photon pile-up (Yamada et al. 2012). We excluded the innermost circle with a 0|${^{\prime}_{.}}$|07 radius in the source region and a 1|${^{\prime}_{.}}$|7 width along the readout in the background region.
2.1.2 HXD-PIN
We retrieved the latest catalogs by the INTEGRAL IBIS (Bird et al. 2010) and Swift BAT (Baumgartner et al. 2013) instruments and confirmed that there are no contaminating sources within the FWZI field of the two observations. We used non-X-ray background (NXB) spectrum version 2.0 distributed by the instrument team (Fukazawa et al. 2009). The cosmic X-ray background (CXB) spectrum, which is another major source of background, was generated by convolving a spectral model (Boldt 1987) with the detector’s spatial and spectral responses. The NXB and CXB spectra were then merged and were subtracted as the PIN background spectrum.
2.2 NuSTAR
NuSTAR has two co-aligned X-ray telescopes. At the focal plane of each telescope a Focal Plane Module (FPM) is placed, called FPMA and FPMB. We reprocessed the γ Cas data using the NuSTAR Data Analysis Software (NuSTARDAS v.1.4.1) and the calibration files (2016 October 21) to obtain a cleaned event list. Source events were extracted from a circle of 3΄ radius, while background events were extracted from an annular region with an inner and outer radius of 4΄ and 6΄.
3 Analysis
Figure 1 shows the Suzaku and NuSTAR spectra of γ Cas and the Suzaku spectra of HD 110432. Both spectra are characterized by a very hard continuum extending beyond 50 keV and spectral features of abundant species. The insets give a close-up view of the Fe K band, in which the prominent emission lines are found at 6.4, 6.7, and 7.0 keV from Fe i, Fe xxv, and Fe xxvi, respectively. The emission lines of highly ionized Fe and other species indicate the presence of thermal plasma of different temperatures, whereas the 6.4 keV line indicates the presence of the reprocessed emission, which presumably occurs at the WD surface. This should accompany a hard Compton reflection continuum, which should be modeled consistently.
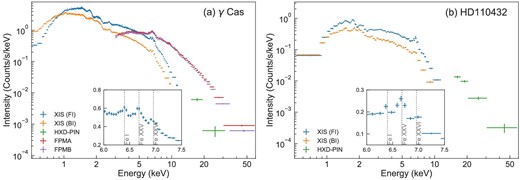
Background-subtracted spectrum of (a) γ Cas and (b) HD 110432. The Suzaku XIS FI, BI, HXD-PIN, and NuSTAR FMPA, FPMB spectra are shown with different colors. An enlarged view of the XIS FI spectrum in the Fe K band is shown in the inset. (Color online)
For the spectral analysis, we generated the XIS redistribution matrix functions and the XRT ancillary response files using the xisrmfgen and xissimarfgen tools, respectively (Ishisaki et al. 2006). The spectra from the two FI sensors were merged for their nearly identical responses, while the BI spectrum was treated separately. We used the entire energy band except for the 1.8–2.0 keV band to avoid the known calibration inaccuracy due to the Si K edge. For the FPMs, we generated the redistribution matrix function and the ancillary response files using the nuproducts tool. Spectra were treated separately for the two units. The normalization relative to XIS (FI) was fixed to the value given by the instrument team3 for XIS (BI) and HXD, while it was treated as a free parameter for the FPMs.
3.1 Non-magnetic accreting WD model
3.1.1 Model
We now apply a physical model first by assuming that the two sources have a non-magnetic accreting WD. In classical WD binaries they are called dwarf novae (DNe: Hellier 2001). The magnetic field (BWD < 0.1 MG) is not strong enough to disturb the mass accretion through the disk. In such systems, the accreting matter rotating at the Keplerian velocity of the disk loses a large amount of kinetic energy when it lands on the WD surface rotating at a much slower speed. The energy is converted to heat and forms a plasma region (called the boundary layer) that expands from the equator to higher latitudes on the WD surface with a temperature gradient (Patterson & Raymond 1985). The emission is optically thin for DNe at quiescence (Pringle & Savonije 1979). During DN outbursts and superoutbursts, the X-ray spectrum deviates from it (Wada et al. 2017). As the two sources are not known to exhibit such episodic events, we do not discuss DNe during outbursts and superoutbursts. Similar but less well-studied systems are nova-like variables. They are considered to be at outburst all the time with a high accretion rate except for the decline in brightness in some sources. The X-ray emission from them in the steady state is also considered from the boundary layer (Pratt et al. 2004).
The X-ray spectrum from the boundary layer is well described by the cooling flow model, which is a convolution of the thin thermal plasma model with a one-dimensional stack of plasma sheets with temperatures changing isobarically. As the name suggests, the model was originally developed for the gas in the cluster of galaxies (Mushotzky & Szymkowiak 1988), which is now considered too simplistic to be relevant (Peterson et al. 2001). However, the model turned out to be very useful to describe the emission from the boundary layer of DNe, which is shown in many sources (Pandel et al. 2005; Wada et al. 2017).
3.1.2 Fitting
3.1.2.1. Continuum
We started with the mkcflow model in the xspec package for the cooling flow emission. The free parameters are the maximum plasma temperature (Tmax), the metal abundance (Z) relative to the ISM value (Wilms et al. 2000), and the mass accretion rate (|$\dot{M}_{\mathrm{X}}$|). The mass accretion rate assessed by the X-ray spectroscopy gives a lower limit of the mass transfer rate from the donor (|$\dot{M}$|) as only a part is dissipated radiatively in the X-ray-emitting region and a part of it is visible. The minimum plasma temperature was fixed at the lowest allowed value in the model (81 eV).
We attenuated the model with extinction by the ISM using the tbabs model (Wilms et al. 2000). This simple model failed to fit the data with three major features in the residuals (the bottom panels in figure 2) for both sources: (i) a large broad deviation in the soft band below ∼1 keV, (ii) a local excess at 6.4 keV, and (iii) a broad curvature beyond 20 keV.
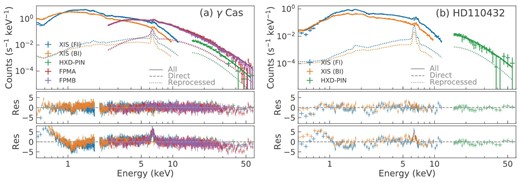
Spectrum and the best-fit non-magnetic accreting WD model of (a) γ Cas and (b) HD 110432. The upper panels show the data (plus marks) and the model (dotted, dashed, and solid curves respectively for the direct, reprocessed, and total components), whereas the middle panels show the residual to the fit. The bottom panel shows the residual to the fit by the simple model of only the cooling flow and the ISM extinction (sub-subsection 3.1.2). (Color online)
3.1.2.2. Absorption
We thus attempt to improve the residual feature (i) first. This structure is typical for spectra that are partially absorbed. In fact, a partial absorption is seen in some DNe (Wada et al. 2017). We separated the absorption into two: that by the ISM and that by the local material. The former was modeled by the full-covering neutral absorber model (tbabs) with the absorption column fixed at the ISM value derived from the E(B − V) measurement of the Be star (Jenkins 2009). The latter was modeled by the partially covering neutral absorber model (tbpcf), in which the absorption column and the covering fraction are the free parameters. This significantly improved the fitting. We also tried the partially covering ionized absorber model (zxipcf) or the two tbpcf models with a different set of parameters. They were not required by the data. As all of them yielded similar parameters for the continuum model, we adopted the simplest one with one tbpcf model for the local absorption.
3.1.2.3.Reflection
We next attempt to improve the residual features (ii) and (iii). They are naturally interpreted respectively as the Fe fluorescence and the Compton hump due to the emission reprocessed at the cold matter in the vicinity of the boundary layer, which is presumably the WD surface. We assumed the reflection geometry as shown in figure 3c. We modeled the former with the gauss model and the latter with the reflect model (Magdziarz & Zdziarski 1995) independently and iterated the fitting until the two yielded a consistent subtended angle dΩ/2π.
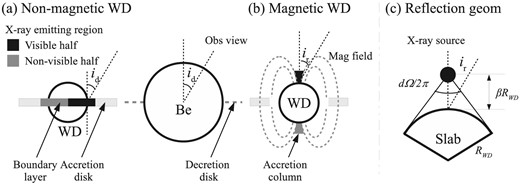
Schematic view of the geometry: (a) non-magnetic WD with the boundary layer as the X-ray-emitting site, and (b) magnetic WD with the accretion column as the X-ray-emitting site. Half of the X-ray-emitting site is assumed visible from the observer. In panel (a), the WD accretion disk and the rotation axis is assumed to align with the Be star decretion disk with a viewing angle of id. (c) The geometry of the reflection modeling with a viewing angle of ir. The WD surface with a radius RWD subtends an angle dΩ/2π seen from a point-like X-ray source at a height of βRWD from the surface, in which |$d\Omega /2\pi = 1- \sqrt{1-\left(\frac{1}{\beta +1}\right)^{2}}$|.
To fix the viewing angle (ir), we made the following assumptions as shown in figure 3a: (i) the orientation is aligned between the Be decretion disk and the WD accretion disk; (ii) half of the boundary layer along the WD equator is visible; and (iii) the reflection occurs only at the WD surface. The viewing angle of the reflection (ir) averaged over the visible half is related to that of the disk (id) by cos ir = 2/πsin id. Here, we assumed that the boundary layer has a negligible spread in the latitude direction of the WD. Based on the optical and near-infrared observations that spatially resolved the decretion disk, id = 42° and 55° (Stee et al. 2012, 2013), thus ir = 65° and 59° respectively for γ Cas and HD 110432.
3.1.3 Result
These modifications improved the fitting significantly as shown in the middle panels of figure 2. We still see a residual structure below 0.6 keV and ∼1.1 keV. These show the limitations of our model due to the too-simplistic assumptions of the cooling flow model to describe the boundary layer, not including the soft (∼0.5 keV) thermal X-ray emission due to the internal shocks of the radiatively driven wind commonly seen in early-type stars (Berghöfer & Schmitt 1997), the too-simplistic assumption of the geometry (figure 3), etc. We obtained some further improvements by, e.g., adding a soft thermal emission attenuated only by the ISM extinction, but not much. These tweaks do not affect the best-fit parameters of the continuum model significantly, as they are derived based on the spectrum above ≈3 keV where the effect of the inaccurate modeling in the soft band is limited. We therefore use this model and ignore the data below 0.6 keV to derive the best-fit values in table 2.
| Model . | Parameter . | γ Cas . | HD 110432 . |
|---|---|---|---|
| (Fixed values) | |||
| Distance† | D (pc) | 188 | 420 |
| Angle | i r (°) | 65 | 59 |
| tbabs ‡ | N H (1020 cm−2) | 1.45 | 15.8 |
| (Fitted values)* | |||
| tbpcf | N H (1022 cm−2) | 0.94|$_{-0.02}^{+0.01}$| | 1.36|$_{-0.03}^{+0.05}$| |
| Covering fraction | 0.486±0.003 | 0.893±0.005 | |
| mkcflow | T max (keV) | 25.0|$_{-0.12}^{+0.13}$| | 48.2|$_{-2.9}^{+1.7}$| |
| Z (solar) | 0.41|$_{-0.01}^{+0.01}$| | 1.23|$_{-0.10}^{+0.07}$| | |
| |$\dot{M}_{\mathrm{X}}$| (10−10 M|$_{\odot}$| yr−1) | 1.61|$_{-0.01}^{+0.01}$| | 1.82|$_{-0.03}^{+0.14}$| | |
| reflect | dΩ/2π | 0.27|$_{-0.01}^{+0.01}$| | 0.52|$_{-0.06}^{+0.05}$| |
| gauss | EWFe (eV) | 54|$_{-4}^{+3}$| | 90|$_{-5}^{+4}$| |
| |$\chi ^{2}_{\mathrm{red}}$| (d.o.f.) | 1.27 (2313) | 1.52 (200) | |
3.2 Magnetic accreting WD model
3.2.1 Model
Next, we apply a physical model assuming that the two sources have magnetic accreting WDs. They are called either intermediate polars (IPs) for a moderate field (0.1–10 MG) or polars for a strong field (>10 MG). In IPs, the accretion disk is truncated and the accreting matter falls along the magnetic field. In polars, the accretion takes place without an intervening accretion disk. Whichever the case, the strong shock is formed above the magnetic poles on the WD surface. The kinematic energy is dissipated into heat at the shock, which cools radiatively. The geometry is different from the boundary layer, which makes some differences in the X-ray spectra in comparison to non-magnetic accreting WDs. Many models have been developed to describe the X-ray emission from the post-shock accretion column with successful applications to real data (Wu et al. 1994; Cropper et al. 1999; Suleimanov et al. 2005; Yuasa et al. 2010; Hayashi & Ishida 2014a, 2014b).
X-ray spectra of magnetic accreting WDs are also characterized by the ubiquitous presence of a partially covering local absorption (Norton & Watson 1989; Patterson 1994; Done & Magdziarz 1998; Ramsay et al. 2008), which is considered to stem from the absorption by the pre-shock accretion flow around the X-ray-emitting post-shock region.
Among the magnetic accreting WD binaries, polars are often characterized by the presence of a very bright soft X-ray emission component (Ishida et al. 1997), which is not seen in the two γ Cas analogs. However, the absence of this component alone does not argue against polars, as some polars do not exhibit such a component (Ramsay & Cropper 2004).
3.2.2 Fitting
We use our model (acrad: Hayashi & Ishida 2014a), which calculates the X-ray emission from the post-shock accretion column of magnetic accreting WDs. This model also calculates the Compton and fluorescence emission consistently (Hayashi et al. 2018) and fits both the direct and reprocessed components simultaneously in the geometry shown in figure 3b. We note, however, that cyclotron cooling is not included in the model, and hence the result is subject to some systematic effects (Wu et al. 1994; Cropper et al. 1999) if the two sources host a strongly magnetic WD.
We started with the acrad model without the reprocessed components modified by the ISM extinction using the tbabs model. As shown in the bottom panels of figure 4, a large residual is found in both sources. This indicates the presence of a partial absorber and the reprocessed component, and thus we took the same approach with the non-magnetic modeling (sub-subsection 3.1.2.2) to add a partial neutral covering model and the reprocessed component. This improved the fit significantly. The result is shown in figure 4 and table 3.
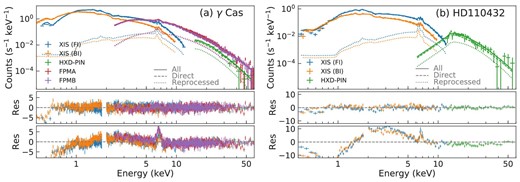
Spectrum and the best-fit magnetic accreting WD model of (a) γ Cas and (b) HD 110432. The symbols follow figure 2. The Compton reflection is modeled only above 1 keV, below which the component is negligible. (Color online)
| Model . | Parameter . | γ Cas . | HD 110432 . |
|---|---|---|---|
| (Fixed values) | |||
| Distance† | D (pc) | 188 | 420 |
| tbabs ‡ | N H (1020 cm−2) | 1.45 | 15.8 |
| (Fitted values)* | |||
| tbpcf | N H (1022 cm−2) | |$0.66_{-0.01}^{+0.02}$| | |$0.94_{-0.02}^{+0.03}$| |
| Covering fraction | 0.453|$_{-0.004}^{+0.004}$| | 0.865 |$_{-0,006}^{+0.006}$| | |
| acrad | M WD (M|$_{\odot}$|) | |$0.72_{-0.06}^{+0.04}$| | |$0.81_{-0.03}^{+0.03}$| |
| Z (solar)§ | 0.37 ± 0.01 | 0.92 ± 0.07 | |
| log a (g cm−2 s−1) | |$-0.61_{-0.11}^{+0.35}$| | |$3.69_{-3.8}^{+\infty }$| | |
| i r (°) | |$68.5_{-1.1}^{+1.2}$| | |$69.2_{-3.6}^{+3.3}$| | |
| (Derived values)‖ | |||
| L X (erg s−1) | 1.0 × 1033 | 2.5 × 1033 | |
| |$\dot{M}_{\mathrm{X}}$| (M|$_{\odot}$| yr−1) | 1.3 × 10⁻¹⁰ | 2.5 × 10⁻¹⁰ | |
| f | (4–6) × 10−3 | >0 | |
| |$\chi ^{2}_{\mathrm{red}}$| (d.o.f.) | 1.23 (2312) | 1.42 (212) | |
* The errors indicate a 1 σ statistical uncertainty.
†The distance is given by van Leeuwen (2007) for γ Cas and by the Gaia data release 2 (Prusti et al. 2016; Brown et al. 2018) for HD 110432.
‡The ISM extinction is derived from the E(B − V) measurement of the Be star (Jenkins 2009).
| Model . | Parameter . | γ Cas . | HD 110432 . |
|---|---|---|---|
| (Fixed values) | |||
| Distance† | D (pc) | 188 | 420 |
| tbabs ‡ | N H (1020 cm−2) | 1.45 | 15.8 |
| (Fitted values)* | |||
| tbpcf | N H (1022 cm−2) | |$0.66_{-0.01}^{+0.02}$| | |$0.94_{-0.02}^{+0.03}$| |
| Covering fraction | 0.453|$_{-0.004}^{+0.004}$| | 0.865 |$_{-0,006}^{+0.006}$| | |
| acrad | M WD (M|$_{\odot}$|) | |$0.72_{-0.06}^{+0.04}$| | |$0.81_{-0.03}^{+0.03}$| |
| Z (solar)§ | 0.37 ± 0.01 | 0.92 ± 0.07 | |
| log a (g cm−2 s−1) | |$-0.61_{-0.11}^{+0.35}$| | |$3.69_{-3.8}^{+\infty }$| | |
| i r (°) | |$68.5_{-1.1}^{+1.2}$| | |$69.2_{-3.6}^{+3.3}$| | |
| (Derived values)‖ | |||
| L X (erg s−1) | 1.0 × 1033 | 2.5 × 1033 | |
| |$\dot{M}_{\mathrm{X}}$| (M|$_{\odot}$| yr−1) | 1.3 × 10⁻¹⁰ | 2.5 × 10⁻¹⁰ | |
| f | (4–6) × 10−3 | >0 | |
| |$\chi ^{2}_{\mathrm{red}}$| (d.o.f.) | 1.23 (2312) | 1.42 (212) | |
* The errors indicate a 1 σ statistical uncertainty.
†The distance is given by van Leeuwen (2007) for γ Cas and by the Gaia data release 2 (Prusti et al. 2016; Brown et al. 2018) for HD 110432.
‡The ISM extinction is derived from the E(B − V) measurement of the Be star (Jenkins 2009).
4 Discussion
4.1 Comparison to typical classical WD binaries
We applied the physical models of non-magnetic and magnetic accreting WDs for the two γ Cas analogs (subsections 3.1 and 3.2, respectively). We now compare the result with that of their typical counterparts in classical WD binaries. We argue that the two γ Cas analogs can be interpreted reasonably by both of the models within a parameter range of MWD and |$\dot{M}_{\mathrm{X}}$| obtained for the classical WD binaries.
4.1.1 Non-magnetic case
For comparison we used the result by Wada et al. (2017), who compiled the X-ray spectra of 14 DNe at quiescence (qDNe) using the archival Suzaku data and fitted them with the cooling flow model. We plotted Tmax and |$\dot{M}_{\mathrm{X}}$| in figure 5a.
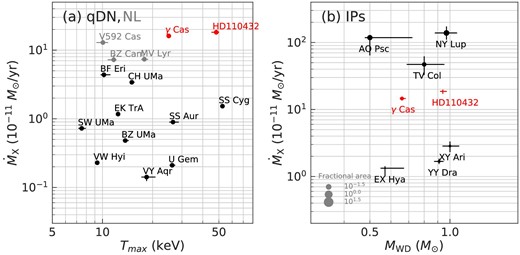
Comparison between the γ Cas analogs (red) and classical WD binaries: (a) DNe at quiescence (qDNe; black) and nova-like variables (NL; gray); and (b) intermediate polars (IPs; black). In panel (b), the symbol size represents the fractional area of the accretion column f, which was not constrained for HD 110432. The values for DNe are from Wada et al. (2017) using Suzaku XIS, those for NLs are from this work using Swift X-Ray Telescope and NuSTAR FPM, and those for IPs are also from this work using Suzaku XIS and HXD. The distance is based on Gaia data release 2 (Prusti et al. 2016; Brown et al. 2018) when available. (Color online)
On the one hand, the Tmax values of the two γ Cas analogs are comparable to those of qDNe, indicating that the WD mass is in a reasonable range. A relation is known between Tmax and MWD for qDNe with an optical MWD estimate (Byckling et al. 2010). We approximated their physical relation with a linear regression, based on which we estimated MWD from Tmax (figure 6). γ Cas is placed along the linear regression line with its optically derived compact star mass of 0.7–1.9 M⊙ (Harmanec et al. 2000).
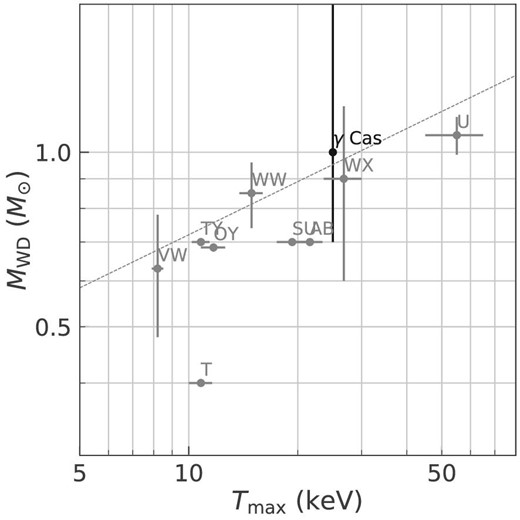
Scatter plot of DNe at quiescence between MWD by optical spectroscopy versus Tmax by X-ray spectroscopy. DNe data are from Pandel et al. (2005) for T Leo, OY Car, VW Hyi, WX Hyi, SU UMa, TY, PsA, AB Dra, WW Cet, and U Gem. The optical data of γ Cas are from Harmanec et al. (2000). The linear regression line is shown with the dotted line.
On the other hand, the |$\dot{M}_{\mathrm{X}}$| values of the two γ Cas analogs are significantly higher than those of qDNe. This is still the case when we compare with the nova-like variables; we plotted results by applying the same model for three sources using the Swift and NuSTAR data in figure 5a. In fact, |$\dot{M}_{\mathrm{X}}$| values of nova-like variables are not very high despite the fact that the |$\dot{M}$| estimates by optical and ultraviolet are much higher than those of qDNe (Balman et al. 2014). However, this alone does not argue against the possibility that the two γ Cas analogs host non-magnetic accreting WDs. The optically thin boundary layer may be maintained at a much higher mass accretion rate of ≈10−9 M⊙ yr−1 (Luna et al. 2018) if the form of accretion is different. The two γ Cas analogs may be such cases.
4.1.2 Magnetic case
For the magnetic case, we applied the same model described in subsection 3.2 to several selected IPs using the Suzaku data for comparison. We plotted MWD and |$\dot{M}_{\mathrm{X}}$| in figure 5b. Both γ Cas and HD 110432 are comparable to known IPs in both parameters. The validity of the MWD estimates based on the X-ray spectral modeling is confirmed in several studies (Suleimanov et al. 2005; Yuasa et al. 2010). The f value in equation (2), which is expressed by the size of the symbol in figure 5b, is well constrained for γ Cas with a small value of ≲1%. Such a small value is common in IPs, and is confirmed in eclipsing systems (Hellier et al. 1997). The X-ray estimate of MWD for γ Cas is again consistent with the optically derived one.
4.2 Comparison between non-magnetic and magnetic cases
We examine additional pieces of evidence to discriminate between the non-magnetic and magnetic cases. There are several spectral features that appear differently between these two for classical WD binaries. We argue, here, that the two γ Cas analogs cannot be classified conclusively as either one of them because the two sources exhibit mixed features of the two cases and these features have overlapping distributions in classical WD binaries.
4.2.1 Partial covering
The partial covering absorber is the first feature to examine. It is seen in the majority of IPs (Ramsay et al. 2008). In contrast, DNe do not show evidence of partial absorption in general (Wada et al. 2017), but some DNe do, especially those with high inclination angles (e.g., OY Car and V893 Sco; Pandel et al. 2005; Mukai et al. 2009). In such systems, a part of the boundary layer emission can be partially covered by the inner part of the accretion disk.
The amount of partial covering column is subject to a large systematic uncertainty depending on the continuum model to be applied. In order to avoid this, we employed the same model for the comparison sources in figure 5 for the amount of partial covering column and its covering fraction. Figure 7 shows a scatter plot to compare the two γ Cas analogs and DNe requiring a partial absorption (Wada et al. 2017), one nova-like variable among three that requires a partial absorption, and several IPs. Some sources required double partial covering, for which we plotted the one with a larger covering fraction. γ Cas has a small absorption column for an IP, which may argue against the magnetic case. Both γ Cas and HD 110432 exhibit a column smaller than the two DNe in the comparison set, but they are distinctively different from other DNe not requiring the partial absorption. Given the poor characterization of the comparison sources and the mixed feature of the two γ Cas analogs, it is difficult to conclude for either of the two cases.
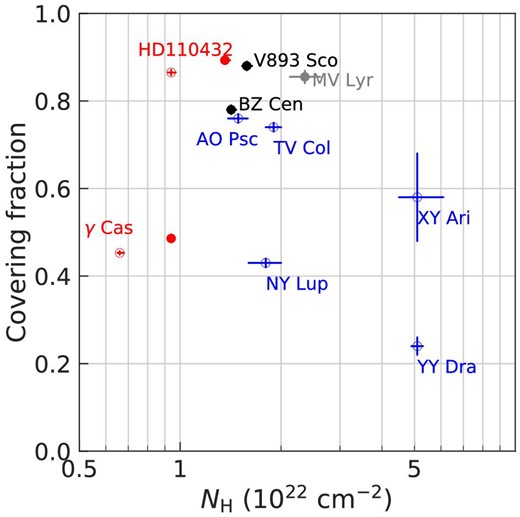
Scatter plot of partial covering absorber. The two γ Cas analogs (red), one nova-like variable (filled gray), DNe at quiescence (filled black; Wada et al. 2017), and IPs (open blue), in which a partial covering absorber is required in the fitting. For the two γ Cas analogs, the result by the non-magnetic model (open; table 2) and that by the magnetic model (filled; table 3) are shown separately. (Color online)
4.2.2 Fe L lines
In the soft X-ray band, it is known that DNe at quiescence and IPs show a clear dichotomy, though with some exceptions, in high-resolution grating spectra (Mukai et al. 2003; Pandel et al. 2005). The most prominent difference is found in the moderately ionized Fe xix–xiv lines at 10–12 Å and Fe xvii lines at 15–17 Å as opposed to the highly ionized Fe xxv–xxvi lines at 1.7–2.0 Å.
Mukai et al. (2003) argued that the moderately ionized lines should appear in the cooling flow model as it is a synthesis of plasma emission of a wide range of temperatures. In fact, the X-ray spectra of DNe at quiescence show these features (Mukai et al. 2003; Pandel et al. 2005). Similar features are found in nova-like variables (Zemko et al. 2014). On the other hand, the X-ray spectra of IPs in this wavelength range is represented by a photo-ionized plasma model, so the moderately ionized Fe lines are weak in contrast to the highly ionized lines, with the exception of EX Hya (Mukai et al. 2003).
In figure 8, archival Chandra high-energy transmission grating (HETG) spectra are compared between the two γ Cas analogs and some classical WD binaries. The moderately ionized Fe lines are detected in γ Cas (M. A. Smith et al. 2004), though not as strongly as the non-magnetic WD samples shown in the figure. HD 110432 is noisy due to its larger extinction than γ Cas. A more qualitative assessment is needed in both classical WD binaries and the γ Cas analogs to use these features for classification.
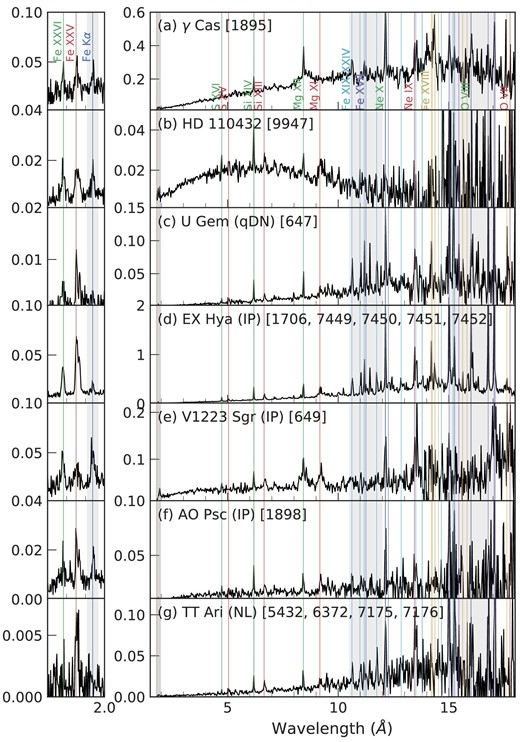
Chandra HEG (left) or MEG (right) ±1-order spectra combined respectively for 1.7–2.0 or 1.8–20 Å of the two γ Cas analogs, a DN at quiescence (qDN; U Gem), three IPs (EX Hya, V1223 Sgr, and AO Psc), and one nova-like variable (NL). The numbers in parenthesis show the Chandra observation number. The ordinate shows the observed count rate divided by the effective area at the wavelength averaged over multiple observations. The gray shaded regions are the conspicuous differences between DNe and IPs for Fe xix–xiv lines (in cyan) at 10–12 Å, Fe xvii lines (in purple) at 15–17 Å, and Fe Kα line (in blue) at 1.9 Å. (Color online)
4.2.3 Fe Kα line
Another feature is the equivalent width (EW) of the Fe i fluorescence. In figure 8 (left panels), the same data are compared in the 1.7–2.0 Å range. IPs are known to have a stronger Fe fluorescence line than DNe and nova-like variables in general. However, the distribution has a large overlap. In figure 9 we have plotted a stacked histogram of the EW of the two γ Cas analogs (table 2) and the comparison sources of the classical WD binaries. The two γ Cas analogs are distributed in the overlapped region of the non-magnetic and magnetic cases, and a firm conclusion cannot be derived.
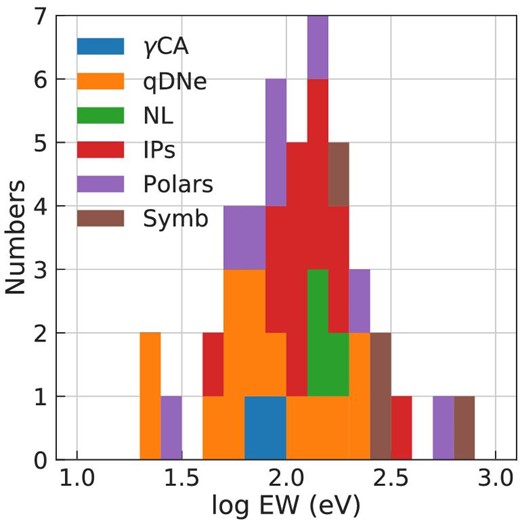
Histogram of the EW of the Fe i fluorescence for the two γ Cas analogs, DNe at quiescence (Wada et al. 2017), nova-like variables (NL; this work), IPs and polars (Ezuka & Ishida 1999), and hard symbiotic stars (Symb; Mukai et al. 2007; Smith et al. 2008; Kennea et al. 2009; Eze et al. 2010; Luna et al. 2018). (Color online)
In the comparison, we added a small group of symbiotic stars with exceptionally hard X-ray emissions. Four such sources are known (RT Cru, T CrB, CD-57 3057, and CH Cyg; Mukai et al. 2007; Smith et al. 2008; Kennea et al. 2009; Eze et al. 2010; Luna et al. 2018). The origin of the hard X-ray emission is debated as to whether it is from the boundary layer or not (Ducci 2016; Luna et al. 2018). These sources are characterized by an exceptionally large EW of the Fe i fluorescence, suggesting that the reprocessed emission is enhanced in a geometry different from the ones assumed in figure 3. The two γ Cas analogs do not show such a large EW, and thus are not likely akin to the hard symbiotic stars.
4.3 Further observations
We have presented the X-ray spectral data in this paper and discussed that the two γ Cas analogs can be interpreted as accreting WD binaries, though they are not conclusively classified as either non-magnetic or magnetic WD binaries. Finally, we discuss some observations, especially long-term temporal behaviors in the X-rays, which are important to elucidate the nature of the γ Cas analogs further.
4.3.1 X-ray pulsation
A defining characteristic of an IP is a coherent X-ray pulsation due to the WD spin and the localized X-ray emitting region (Mukai 2017). For a similarly small fractional area f of the X-ray emitting region, at least for γ Cas when applying the magnetic model (subsection 3.2), we would naturally expect a coherent pulsation in the X-ray light curves. However, no such signal is confirmed to date. There are two possibilities. One is that the magnetic pole is almost completely aligned to the rotational axis (figure 3b), and thus the flux change is too small to be detected. Another is that the coherent signals are not investigated well in the expected range of the periods.
Harmanec et al. (2000) and Miroshnichenko, Bjorkman and Krugov (2002) discovered that γ Cas is a binary system with an orbital period of 202.59 d. Relations are known between the spin (Pspin) and the orbital (Porb) periods for some established classes of binaries hosting a compact source (figure 10). For IPs, Pspin ∼ 0.1Porb, while for polars, Pspin ∼ Porb. This is not applicable to γ Cas analogs as they are not Roche-lobe-filling systems, unlike IPs. A better analogy is Be/NS binaries. Corbet (1984) found a relation |$P_{\mathrm{spin}} \propto P_{\mathrm{orb}}^{2}$| in observations (gray symbols in figure 10), which was later explained by Waters and van Kerkwijk (1989) in theory; if the binary separation is larger, hence Porb is longer, the density of the Be star wind or decretion disk is smaller close to the NS. As a result, a smaller mass accretion rate is achieved by the Bondi–Hoyle accretion (Bondi & Hoyle 1944), and a slower spin is needed to balance the in-falling ram pressure.
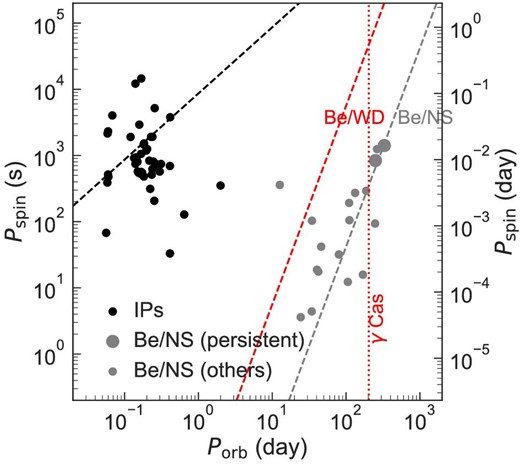
Relations between the orbital period (Porb) and the spin period (Pspin) for IPs (black; Mukai 2017) and Be/NS binaries (gray; Reig 2011). For the latter, a larger symbol size is used for the persistent (X Per-type) sources than for the others. The phenomenological linear relation is shown with dashed lines for each class. The relation for Be/WD binaries scaled from the one for the Be/NS binaries (Apparao 2002) is shown with the red dashed line. Porb is shown for γ Cas (Harmanec et al. 2000) with the red dotted vertical line. (Color online)
4.3.2 X-ray outbursts
In Be/NS binary systems, three major types of X-ray temporal behaviors are known: (1) persistent low-luminosity (∼1034 erg s−1) emission, (2) type I outbursts associated with an orbital motion with emission elevated by 102–103 times, and (3) type II outbursts with even larger emission but not associated with orbital periods. The different behavior is well understood as a dynamical interaction between the Be decretion disk and the NS, as is shown in a series of smoothed particle hydrodynamic simulations. The Be disk is effectively truncated at a tidal resonance radius where the mass accumulates (Osaki 1996). The persistent emission is due to the mass leaking from the truncated disk, type I outbursts occur when the NS passes close to the disk at periastron, and type II outbursts occur when the disk is drastically disturbed (Okazaki et al. 2002, 2012).
The theory explains various observations very well; in particular, the presence of type I outbursts in some systems and the absence thereof in others. In systems with a low eccentric orbit, as represented by X Per, the disk is truncated at a 3:1 resonance radius. The gap between the truncation point and the first Lagrangian point of the binary is so large that the elevated mass accretion at periastron (type I outbursts) does not take place, unlike systems with a highly eccentric orbit (Okazaki & Negueruela 2001). If the underlying physics is the same, the theory also applies to the Be/WD systems. It is therefore quite important to verify if there is any behavior similar to type I outbursts of Be/NS binaries. If none is found, this would suggest that the γ Cas analogs have a wide and low (≲0.3) eccentric orbit.
4.3.3 Dwarf or classical novae
Yet another interesting clue is dwarf or classical novae. If a γ Cas analog hosts a non-magnetic WD, we would expect changes in the X-ray spectral shape associated with the changes of the mass accretion rate. In general, the X-ray spectra become softer when the accretion rate increases during outbursts because the boundary layer emission becomes optically thick to itself (Pringle & Savonije 1979).
Classical novae would occur if sufficient mass is accumulated on the WD surface to ignite a thermonuclear runaway. For γ Cas and HD 110432, the lack of classical nova detection to date is reasonable considering their low MWD and |$\dot{M}_{\mathrm{X}}$| values. Kato et al. (2014) presented the minimum accreted mass to ignite an explosion as a function of MWD and the mass accretion rate (|$\dot{M}$|). For MWD ∼ 1 M|$_{\odot}$| and |$\dot{M} \sim 10^{-10}\, M_{\odot }\:$|yr−1, >0.3 Myr is required to accumulate the ignition mass, which is too long to be observed by chance. If there are any γ Cas analogs with a much higher MWD and |$\dot{M}_{\mathrm{X}}$|, the chance of detection would be better.
5 Summary
A debate is ongoing as to the X-ray production mechanism of the γ Cas analogs. We adopt the Be/WD scenario as a working hypothesis and applied the physical models developed for classical accreting WD binaries to the X-ray spectra of two representative γ Cas analog sources using the Suzaku and NuSTAR data in a wide energy range.
We found that both sources are reasonably explained by the models of non-magnetic or magnetic accreting WD binaries with physical parameters in a range consistent with the classical WD binaries. We investigated the additional spectral evidence, but none was conclusive enough to classify the two sources as either non-magnetic or magnetic accreting WD binaries. Further observations, especially long-term X-ray temporal behaviors, would be useful to understand the nature of these sources.
We should note here that there is no reason that all γ Cas analogs belong to the same subclass of accreting WDs: some γ Cas analogs may host magnetic WDs while others might be non-magnetic WDs. The present study should be expanded to other γ Cas analogs to investigate their diversity with respect to classical WD binaries.
We intentionally did not argue for or against the other scenario—magnetic Be star—for γ Cas analogs. However, we hope that the presented result by our approach advances the debate by (1) facilitating discussion to focus on more specific questions, such as how the observed |$\dot{M}_{\mathrm{X}}$| can be achieved, and (2) motivating observations that are useful to further understanding of the system.
Acknowledgements
The authors express their gratitude to the anonymous reviewer for many insightful comments that improved the draft significantly. We also acknowledge Takeshi Shionome, Misaki Mizumoto, Yasuharu Sugawara, Reiho Shimomukai, and Tae Furusho at JAXA ISAS and Hirokazu Odaka at the University of Tokyo for help in data reduction, and Atsuo T. Okazaki at Hokkai Gakuen University for discussion on Be/NS binary systems. This work was supported by the Hyogo Science and Technology Association, JSPS Grants-in-Aid for Scientific Research JP17K18019, JP16K05309, and JP15H03642, and Grant-in-Aid for Scientific Research on Innovative Areas JP24105007. This research made use of data obtained from the Data ARchives and Transmission System (DARTS), which is provided by the Center for Science-satellite Operation and Data Archives (C-SODA) at ISAS/JAXA and from the European Space Agency (ESA) mission Gaia 〈https://www.cosmos.esa.int/gaia〉, processed by the Gaia Data Processing and Analysis Consortium (DPAC: https://www.cosmos.esa.int/web/gaia/dpac/consortium). Funding for DPAC has been provided by national institutions; in particular, the institutions participating in the Gaia Multilateral Agreement.
Footnotes
In this paper, we include γ Cas itself among the γ Cas analogs.
In this paper, WD binaries are used for all systems including a WD and a star. Classical WD binaries are used when we specifically refer to those with a late-type companion.
References


