-
PDF
- Split View
-
Views
-
Cite
Cite
Takuma Izumi, Supermassive black holes with higher Eddington ratios preferentially form in gas-rich galaxies, Publications of the Astronomical Society of Japan, Volume 70, Issue 3, June 2018, L2, https://doi.org/10.1093/pasj/psy045
Close - Share Icon Share
Abstract
The Eddington ratio (λEdd) of supermassive black holes (SMBHs) is a fundamental parameter that governs their cosmic growth. Although gas mass accretion onto SMBHs is sustained when they are surrounded by large amounts of gas, little is known about the molecular content of galaxies, particularly those hosting super-Eddington SMBHs (λEdd > 1: the key phase of SMBH growth). Here, we have compiled reported optical and 12CO(1–0) data of local quasars to characterize their hosts. We found that higher-λEdd SMBHs tend to reside in gas-rich (i.e., high gas mass to stellar mass fraction = fgas) galaxies. We used two methods to make this conclusion: one uses black hole mass as a surrogate for stellar mass by assuming a local co-evolutionary relationship, and the other directly uses stellar masses estimated from near-infrared observations. The fgas–λEdd correlation we found concurs with the cosmic decreasing trend in λEdd, as cold molecular gas is primarily consumed by star formation. This correlation qualitatively matches predictions of recent semi-analytic models of the cosmic downsizing of SMBHs as well. As the gas mass surface density would eventually be a key parameter controlling mass accretion, we need high-resolution observations to identify further differences in the molecular properties around super-Eddington and sub-Eddington SMBHs.
1 Introduction
The huge amount of energy emitted by active galactic nuclei (AGNs) and high-redshift quasars is commonly ascribed to gas accretion by supermassive black holes (SMBHs). The co-evolution of SMBHs and galaxies is supported by the tight correlations between SMBH mass (MBH) and some properties of their host galaxies such as bulge stellar mass and stellar velocity dispersion (for a review, see Kormendy & Ho 2013), as well as the similarity of the global history of star formation and AGN activity (for a review, see Madau & Dickinson 2014).
The evolutionary stage of an AGN/SMBH can be characterized by its Eddington ratio (λEdd).1 Kawaguchi et al. (2004) indicated that the cosmic SMBH growth by gas accretion is dominated by the super-Eddington phase (i.e., λEdd > 1), rather than the sub-Eddington phase common among low-redshift AGNs (e.g., Shen & Kelly 2012). Such a mass accretion process would be sustained by large amounts of cold molecular gas in the central regions of galaxies (e.g., Kawakatu & Wada 2008; Vollmer et al. 2008). Indeed, recent millimeter/submillimeter observations have shown that the mass surface density of a sub-kpc scale dense molecular gas structure is a key parameter controlling the mass accretion rate of an SMBH (e.g., Monje et al. 2011; Izumi et al. 2016; Husemann et al. 2017), although those works focused mostly on sub-Eddington objects. Hao et al. (2005) showed that infrared-luminous quasars tend to possess super-Eddington SMBHs. Therefore it is plausible that super-Eddington objects occur in young starburst galaxies (Xia et al. 2012), corresponding to the early/gas-rich phase of galaxy evolution, which is indeed expected in a number of theoretical/numerical models (e.g., Hopkins et al. 2006).
The space density of AGNs over cosmic time can also be a stringent constraint on SMBH/galaxy evolutionary models. In this sense, AGN downsizing or anti-hierarchical evolution is another key trend that we should consider: both ultraviolet (e.g., Croom et al. 2009; Ikeda et al. 2012) and X-ray (e.g., Hasinger et al. 2005; Ueda et al. 2014) observations have revealed that the space densities of luminous AGNs peak at a redshift higher than those of faint AGNs. If the AGN luminosity reflects MBH, the downsizing indicates that the more massive systems formed at earlier cosmic times. This seems to contradict the hierarchical structure formation in the cold dark matter (CDM) universe. However, if a super-Eddington SMBH, which would occur in the dominant phase of mass accumulation (Kawaguchi et al. 2004), is characteristic of a specific environment that is common at high-z, this trend could be natural.
In this article we first compile galaxy-scale 12CO(1–0) emission line measurements of low-redshift (z ≲ 0.3) quasars, for which rich multi-wavelength data are available, to estimate their global cold molecular mass (Mgas). The relevance of the gas mass fraction to λEdd is then explored in two different ways. Hereafter, we define the gas mass fraction as fgas ≡ Mgas/M⋆, where M⋆ denotes the galaxy total stellar mass. The standard Λ-CDM cosmology with H0 = 70 km s−1 Mpc−1, ΩM = 0.3, and ΩΛ = 0.7 is adopted throughout this work.
2 Method and data
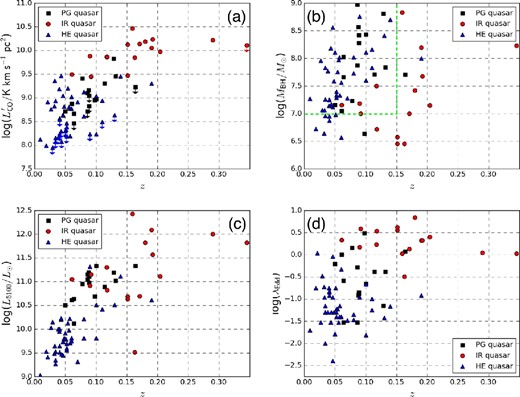
Our immediate objective is to examine the connection between λEdd and fgas to characterize the nature of the host galaxies of super-Eddington SMBHs. For this purpose, we applied two methods. The first indirect method uses MBH as a surrogate for M⋆ by assuming that the local co-evolutionary relationship also holds in our samples. The second direct method faithfully uses M⋆ derived from near-infrared (NIR; H- or K-band) imaging studies to estimate fgas. Although the latter is more straightforward, the number of sample quasars decreases (subsection 2.4), as high-resolution NIR observations are required to separate AGN light from stellar light. Considering the above methods, we compiled multi-wavelength literature data for low-redshift quasars as described below. The relevant properties of our samples are visualized in figure 1.

Distributions of our samples as functions of the redshift for (a) 12CO(1–0) line luminosity, (b) MBH, (c) L5100, and (d) λEdd. PG quasars (black squares), IR quasars (red circles), and HE quasars (blue triangles) are shown. The dashed green lines in (b) define our subsample, i.e., MBH ≳ 107 M⊙ ∩ z < 0.15 (see details in section 3). (Color online)
2.1 PG quasars
As our base sample, we first compiled optically luminous local quasars (5100 Å continuum luminosity, L5100 ≃ 1044 − 45 erg s−1) from the Palomar–Green (PG) Bright Quasar Survey (Schmidt & Green 1983) with galaxy-scale 12CO(1–0) measurements (Evans et al. 2001, 2006, 2009; Scoville et al. 2003). All of the 12CO(1–0) observations were made with the Owens Valley Radio Observatory (OVRO) interferometer, providing angular resolutions of ∼4″–5″ (corresponding to ∼4–5 kpc). These still cover a large fraction of their galaxy-scale 12CO(1–0) emissions, given that low-J CO emissions typically come from the innermost ≲5 kpc regions of both nearby Seyfert-class AGNs and high-redshift quasars (e.g., Wang et al. 2011; Izumi et al. 2015).
We applied the Galactic CO-to-Mgas conversion factor of αCO = 4 M⊙ (K km s−1 pc2)−1 (Bolatto et al. 2013) to the line luminosities |$L^{\prime }_{\rm CO}$|, as the 12CO(1–0) data cover both the circumnuclear ≲100 pc region, where lower αCO may apply, and rather quiescent >kpc-scale regions where interstellar medium with properties similar to those of our Galaxy would be expected. Although the actual value of αCO would vary with the source, we use the above αCO throughout this work to maintain consistency among the samples. The typical uncertainty of αCO is ∼0.3 dex (Bolatto et al. 2013).
M BH of those PG quasars was estimated with the so-called single-epoch method (e.g., Kaspi et al. 2000; Bentz et al. 2006) that uses Hβ FWHM and L5100, with a virial factor of 1, which are collected from Hao et al. (2005) and Du et al. (2015). A typical uncertainty of MBH based on this method is ∼0.3 dex (Shen et al. 2008), which stems from the dispersion in the reverberation-mapped MBH calibration. The AGN bolometric luminosities (LBol) are also derived from L5100, by applying a bolometric correction factor of 9 (Kaspi et al. 2000), which has a typical uncertainty of ∼0.3 dex. Therefore, we expect that the uncertainty of λEdd is ∼0.4 dex. These procedures were applied to the following samples as well. After reclassifying three PG quasars as IR quasars (subsection 2.2) due to their high IR luminosity, 16 quasars were categorized in this PG quasar sample.
2.2 IR quasars
Local quasars showing high IR luminosity (L8-1000 μm > 1012 L⊙; IR quasar) compiled in Hao et al. (2005) were matched with the 12CO(1–0) measurements with the IRAM 30 m telescope presented in Xia et al. (2012). The achieved angular resolutions were ∼22″, so their galaxy-scale 12CO(1–0) emissions should be fully recovered. After adding the three reclassified PG quasars, our IR quasar sample consisted of 16 quasars to widen the range of λEdd, as they tend to show λEdd ≳ 1 (Hao et al. 2005). MBH, Mgas, and λEdd for the sample IR quasars are calculated in the same manner as for the PG quasar sample. Note that, although one would expect that the IR quasars possess huge amounts of Mgas, which is actually the case as judged from figure 1, their fgas is not so obvious.
2.3 HE quasars
Our sample was further extended toward the optically lower luminosity regime (L5100 ≲ 1044 erg s−1) by adding quasars from the Hamburg/ESO (HE) Survey (Wisotzky et al. 2000). Systematic measurements of their 12CO(1–0) emission line with the IRAM 30 m telescope were performed by Bertram et al. (2007) and Husemann et al. (2017). Then, we matched their data with the MBH and L5100 (or λEdd) data presented in Schulze and Wisotzky (2010) and Husemann et al. (2014, 2017) to construct the HE quasar sample. There were 44 quasars in this sample.
2.4 Stellar mass
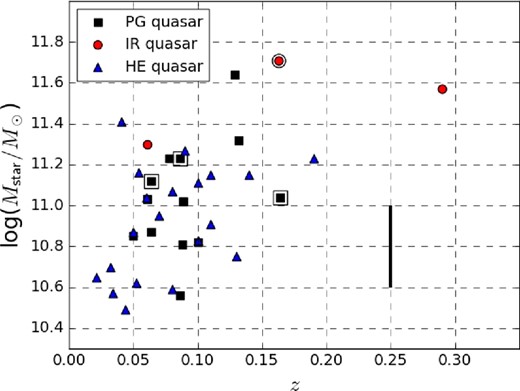
M ⋆ data for 11 of our PG quasar samples (69%; Zhang et al. 2016), two of the IR quasar samples (13%; Zhang et al. 2016), and 20 of the HE quasar samples (45%; Jahnke et al. 2004; Busch et al. 2014), are available from the literature. The M* estimates were based on high-resolution H- or K-band photometry with the Hubble Space Telescope or ground-based AO-assisted systems. Mass-to-luminosity ratios (M/L) of −0.017 (H) and −0.08 (K) on a logarithmic scale were assumed to maintain consistency with Zhang et al. (2016). A typical uncertainty in NIR-based M⋆ due to the assumed M/L is ∼0.2 dex (Zhang et al. 2016). Their M⋆ range was ∼1010.6–1011.6 M⊙ (PG quasar), ∼1011.3–1011.6 M⊙ (IR quasar), and ∼1010.5–1011.4 M⊙ (HE quasar), respectively, which constitute the high-mass part of the local M⋆ function (e.g., Ilbert et al. 2013). These M⋆, for which figure 2 shows the distribution as a function of the redshift, are used to calculate fgas directly.

M ⋆ distribution of our sample of PG (black squares), IR (red circles), and HE (blue triangles) quasars as a function of the redshift. These were measured with NIR (H- or K-band) photometric observations. The black bar indicates the expected uncertainty due to the assumed mass-to-light ratio (∼0.2 dex; Zhang et al. 2016). The double symbols denote the secondary data, for which M* was measured with V-band photometry.
Furthermore, we also found one IR and three PG quasars in the optical V-band-based M⋆ catalog of Zhang et al. (2016). These will be appended in subsection 3.2 as secondary data. The inclusion of this optical data does not affect our conclusion.
3 Relationship of λEdd and fgas
In this section, we investigate the relationship between λEdd and fgas using the indirect and direct methods mentioned in section 2.
3.1 Indirect method with MBH
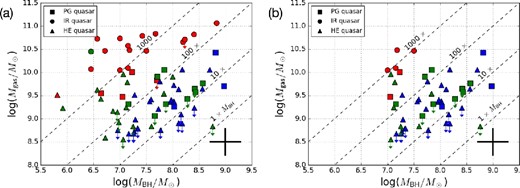
All of the quasars described in section 2 (total number = 76) are plotted on the MBH–Mgas plane (figure 3a). Here, we classify the samples into three groups based on their λEdd: (i) the super-λEdd group with λEdd > 1, (ii) the mid-λEdd group with 1 ≥ λEdd > 0.1, and (iii) the low-λEdd group with 0.1 ≥ λEdd. While λEdd > 1 defines super-Eddington objects, there is no physical motivation to set λEdd = 0.1 as the threshold. Rather, these thresholds are adopted to clarify the dependence of λEdd on fgas. The figure also shows the fractions of Mgas with respect to MBH. Note that the actual λEdd of the super-λEdd group spans from 1.0 to 7.0.

(a) Scatterplot of MBH and Mgas for our sample of PG (squares), IR (circles), and HE (triangles) quasars. Colors indicate the Eddington ratio: λEdd > 1 (red), 1 ≥ λEdd > 0.1 (green), and 0.1 ≥ λEdd (blue). The dashed diagonal lines indicate that Mgas is 1, 10, 100, and 1000 times MBH. One can estimate Mgas/Mbulge from these lines by assuming the local co-evolutionary relationship such as MBH ≃ 0.005 × Mbulge (Kormendy & Ho 2013). The black cross shows the typical uncertainty (0.3 dex for both MBH and Mgas). (b) As (a), but for the subsample (see subsection 3.1 for details).
In figure 3a, we observed a clear trend: most of the super-λEdd quasars were located in the region of Mgas/MBH ≳ 1000, whereas the low-λEdd quasars were in Mgas/MBH ≲ 10–100. The mid-λEdd quasars tended to occupy the gap between the others. If we assume that the local co-evolutionary relationship (e.g., Kormendy & Ho 2013) also holds for our quasar samples, i.e., MBH ≃ 0.005 × Mbulge (here, Mbulge denotes galaxy bulge mass), the Mgas/MBH ratio can be transformed into Mgas/Mbulge. As such, we argue that the super-λEdd SMBHs occur in galaxies with a higher Mgas/Mbulge, i.e., in gas-rich systems, where we can also expect a high fgas.
However, care should be taken about the bias on our sample selection that prefers optically bright objects as they were basically selected in flux-limited manners (figure 1c): the SMBHs with lower MBH could have been detected only when they have high enough λEdd, while those with high MBH could have been detected irrespective of their λEdd. Thus, here we try another version of this method by only using those with MBH ≥ 107 M⊙ and z ≤ 0.15 (figure 1b: total number = 47). The low-mass cut is applied to ensure that objects with low λEdd are not omitted in this subsample. Then the MBH–Mgas distribution is replotted (figure 3b). Here we again observe the same trend as in figure 3a: high-λEdd SMBHs reside in gas-rich systems in a qualitative manner. Thus the trend we see in figure 3a would not be significantly affected by the selection bias.
3.2 Direct method with M⋆
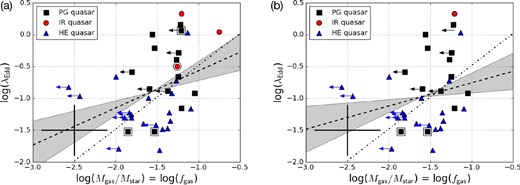
Next, we directly estimate fgas by dividing Mgas by M⋆. In this manner, 33 quasars with NIR-based M⋆ (hereafter the NIR-M⋆ sample) and four ancillary quasars with V-band-based M⋆ (the optical-M⋆ sample) described in section 2 are plotted together in figure 4a. The fgas of the quasars (e.g., ∼10−1.5 in the PG quasar sample) agrees well with the model prediction at z = 0 by Enoki et al. (2014). Although a substantial fraction of the samples only has upper limits on fgas due to the non-detection of 12CO(1–0) emissions, there could be a positive correlation between the two quantities.

(a) fgas–λEdd correlation for the local quasar samples in the logarithmic space. In total, 37 quasars (33 NIR-M⋆ samples and 4 optical-M⋆ samples) are plotted. The doubled symbols indicate the ancillary optical-M⋆ samples. The cross in the bottom left indicates the expected typical uncertainty (0.4 dex for both fgas and λEdd). The dashed line shows the best-fit linear regression, log(λEdd) = (0.583 ± 0.265) × log(fgas) + (0.017 ± 0.416), with its uncertainty (gray-shaded region). See more details in section 4. The dot-dashed line indicates the scaling of λEdd invoked in Hirschmann et al. (2012), which has a slope of unity. (b) As (a), but for the subsample (see subsection 3.2 for details). The best-fit linear regression here indicates log(λEdd) = (0.364 ± 0.259) × log(fgas) + (−0.393 ± 0.415). (Color online)
We thus performed the generalized Kendall’s non-parametric correlation test to estimate the significance of the correlation, by using the IRAF2 STSDAS3 package. The program can treat mixed censored data, including censoring in the independent variable. The resultant Kendall’s tau correlation coefficient for the NIR-M⋆ sample only is 0.49 and the probability that the data are uncorrelated is 3%. The probability is reduced to 2% if we use the full NIR- and optical-M⋆ samples, with almost the same coefficient of 0.49. With these values, we then suggest that fgas and λEdd are (marginally) correlated.
If we use the subsample data (i.e., MBH ≥ 107 M⊙ ∩ z ≤ 0.15) only, as was performed in subsection 3.1, the resultant correlation becomes weaker (figure 4b; correlation coefficient = 0.36 and the probability of no correlation = 10%), although it still suggests a marginal and positive correlation. On the other hand, if we focus on the CO-detected objects (i.e., gas-rich systems) only, the data distribution is almost vertical in both figures 4a and 4b. This would suggest the importance of expanding the sample to gas-poorer systems to depict the true galaxy distribution on this plane.
4 Discussion
Both the indirect and direct methods in section 3 support the idea that fgas and λEdd are positively correlated, although the latter method only gives tentative support. From this, we argue that super-Eddington SMBHs, which are in the stage of rapid mass accumulation (Kawaguchi et al. 2004), tend to reside in relatively gas-rich galaxies. Our results are consistent with the observed decrease in λEdd over cosmic time (e.g., Trakhtenbrot et al. 2016), as fgas of a galaxy is essentially a decreasing function with time, primarily due to star formation. This in turn implies that super-Eddington accretion could be a more common phenomenon at higher z, where plenty of gas is expected. Indeed, such efficient accretion onto black hole seeds formed from the collapse of primordial stars (for a recent review see, e.g., Gallerani et al. 2017) are thought to be one of the most plausible paths for the formation of high(est)-z SMBHs with MBH ≃ 109 M⊙ (e.g., Bañados et al. 2018).
The fgas–λEdd correlation provides a clue to solving the cosmic downsizing problem too. For example, the recent semi-analytic galaxy formation model of Hirschmann et al. (2012) reproduced the downsizing trend by modifying several of their physical recipes, including a ceiling of λEdd that depends on fgas, particularly at z ≤ 1. Enoki et al. (2014) also reproduced the trend with a decreasing amount of cold gas inside a galaxy with time, as well as with some other processes. In either model, a positive correlation of λEdd and fgas is mandatory, which accords with our results (figure 4) in a qualitative sense.
However, the fgas–λEdd correlation observed here seems to be a bit shallower than the linear correlation in Hirschmann et al. (2012) with a logarithmic slope of unity: the two-dimensional Kaplan–Meier test using the same STSDAS package produces a linear regression in our data of log(λEdd) = (0.583 ± 0.265) × log(fgas) + (0.017 ± 0.416), as shown in figure 4a. Indeed, it is difficult to generate super-Eddington objects from this shallow best-fit relation. Further sensitive observations to reduce the samples with upper limits on fgas, increase those of high fgas (e.g., fgas ≳ 0.3; these are particularly rare in the local universe), as well as a large number of samples to statistically overcome the time-variable nature of the AGN continuum that hampers accurate determination of λEdd (see Novak et al. 2011, and references therein), are required to achieve a firmer fgas–λEdd relationship.
The underlying factors driving the fgas–λEdd correlation could be (i) a co-evolutionary relationship and (ii) the positive correlation between Mgas and the accretion rate of AGNs, |$\dot{M}_{\rm BH}$| (e.g., Monje et al. 2011; Husemann et al. 2017). Note that we invoked this idea in subsection 3.1. Indeed, there is no clear correlation between Mgas itself (i.e., without dividing by MBH) and λEdd (Husemann et al. 2017), suggesting the influence of (i). As expected in many mass accretion models (e.g., Kawakatu & Wada 2008; Hopkins & Quataert 2010), a key parameter controlling accretion is the gas mass surface density (Σgas) at the central ∼100 pc circumnuclear disk (CND) around an AGN. Indeed, Izumi, Kawakatu, and Kohno (2016) observationally suggested the importance of the CND-scale Σgas. The correlation of Mgas at a galaxy scale and |$\dot{M}_{\rm BH}$| implies that there is a type of scaling between Mgas and a CND-scale gas mass or Σgas.
In addition to the above, as a gaseous disk with higher fgas is more susceptible to gravitational collapse (e.g., Genzel et al. 2011; Sani et al. 2012), an induced series of gravitational instability will increase the mass inflow to the CND scale or further inward, enhancing Σgas there, and eventually leading to a higher λEdd. Violent gravitational instability is particularly important for triggering AGNs in a high-z universe (e.g., Bournaud et al. 2012), which even competes with another favored triggering mechanism, galaxy mergers/interactions (Hopkins et al. 2006; Menci et al. 2014). While it is difficult to investigate systematic differences in Σgas around super- and low-λEdd SMBHs with the current dataset, a systematic and statistical high-resolution study using the Atacama Large Millimeter/submillimeter Array (ALMA) should shed light on this.
Acknowledgments
We acknowledge the anonymous referee for his/her careful reading and insightful comments/suggestion which improved this paper. We are grateful to A. Schulze for providing his HE quasar data. T.I. greatly appreciates M. Imanishi, T. Kawamuro, and A. Schulze at NAOJ for fruitful discussions. T.I. is supported by JSPS KAKENHI Grant Number 17K14247.
Footnotes
The ratio of an AGN’s bolometric luminosity (LBol) to its Eddington luminosity (LEdd), where LEdd [erg s−1] = 1.26 × 1038 MBH [M⊙].
IRAF is distributed by the National Optical Astronomy Observatory, which is operated by the Association of Universities for Research in Astronomy, Inc. under cooperative agreement with the National Science Foundation.
STSDAS is a product of the Space Telescope Science Institute, which is operated by AURA for NASA.
References
Author notes
NAOJ Fellow.


