


Abstract
Recent detection of gravitational waves from a neutron star (NS) merger event GW170817 and identification of an electromagnetic counterpart provide a unique opportunity to study the physical processes in NS mergers. To derive properties of ejected material from the NS merger, we perform radiative transfer simulations of kilonova, optical and near-infrared emissions powered by radioactive decays of r-process nuclei synthesized in the merger. We find that the observed near-infrared emission lasting for >10 d is explained by 0.03 M⊙ of ejecta containing lanthanide elements. However, the blue optical component observed at the initial phases requires an ejecta component with a relatively high electron fraction (Ye). We show that both optical and near-infrared emissions are simultaneously reproduced by the ejecta with a medium Ye of ∼0.25. We suggest that a dominant component powering the emission is post-merger ejecta, which exhibits that the mass ejection after the first dynamical ejection is quite efficient. Our results indicate that NS mergers synthesize a wide range of r-process elements and strengthen the hypothesis that NS mergers are the origin of r-process elements in the Universe.
1 Introduction
The first gravitational wave (GW) detection from a neutron star merger was successfully made for GW170817 (Abbott et al. 2017). The detection of GW170817 triggered electromagnetic (EM) observations over the entire wavelength range. Gamma-ray signals were detected about two seconds after the coalescence (Connaughton et al. 2017; Savchenko et al. 2017a). Then, a promising optical and near-infrared counterpart was discovered (Coulter et al. 2017a; Allam et al. 2017; Yang et al. 2017; Coulter et al. 2017b; M. Soares-Santos et al. in preparation; S. Valenti et al. in preparation) within a localization area estimated from the three GW detectors (Advanced LIGO Livingston/Hanford and Advanced Virgo). The object, named as SSS17a (or DLT17ck), is located in NGC 4993, a galaxy at a distance of 40 Mpc. The object was also detected subsequently in ultraviolet (Evans et al. 2017), X-ray (Fong et al. 2017; Troja et al. 2017), and radio (Mooley et al. 2017; Corsi et al. 2017; Hallinan et al. 2017) wavelengths.
Among various EM signals from NS mergers, optical and near-infrared emissions are in particular of interest. When two NSs merge, a small part of NS material (∼10−3–10−2 M⊙) is ejected into interstellar space (e.g., Rosswog et al. 1999; Ruffert & Janka 2001; Goriely et al. 2011; Hotokezaka et al. 2013; Bauswein et al. 2013). In the ejected material, the rapid neutron capture nucleosynthesis (r-process) takes place (e.g., Lattimer & Schramm 1974; Eichler et al. 1989; Korobkin et al. 2012; Wanajo et al. 2014). Then, radioactive decays of r-process nuclei powers EM emission especially in the optical and near-infrared wavelengths (Li & Paczyński 1998; Kulkarni 2005; Metzger et al. 2010; Kasen et al. 2013; Barnes & Kasen 2013; Tanaka & Hotokezaka 2013). This emission is called “kilonova” or “macronova” (see Fernández & Metzger 2016; Tanaka 2016; Metzger 2017, for reviews).
NS mergers eject material by several mechanisms. The first and robust mechanism is a dynamical mass ejection, which is driven by tidal disruption as well as shock heating. Properties of the dynamical ejecta depend on the mass ratio of two NSs and the equation of state for a NS (e.g., Hotokezaka et al. 2013). After the dynamical ejection, there may also be additional mass ejection (“post-merger” ejecta or “wind” ejecta) by viscous heating and neutrino heating (e.g., Dessart et al. 2009; Fernández & Metzger 2013; Perego et al. 2014; Shibata et al. 2017). However, detailed properties of the post-merger ejecta, such as the ejecta mass, electron fraction (Ye, number of protons per nucleon which controls the final element abundances), and its spatial distribution, are still unclear due to difficulties in resolving the turbulence and sophisticated treatment of neutrinos in numerical simulations (see, e.g., Price & Rosswog 2006; Kiuchi et al. 2014; Giacomazzo et al. 2015; Siegel & Metzger 2017).
The optical and near-infrared counterpart to GW170817, SSS17a, provides an excellent opportunity to study the mass ejection mechanisms of NS mergers and nucleosynthesis in the ejecta. The observed properties of SSS17a are summarized as follows (Utsumi et al. 2017). (1) The optical and near-infrared brightnesses reach absolute magnitudes of −15 or −16 mag (AB magnitude). (2) The optical light curves decline rapidly while the near-infrared light curves evolve more slowly: the flux is dominated by near-infrared light at t > 5 d after GW170817 (hereafter t denotes the time after GW170817). (3) The emission at the initial phase (t < 2 d) is relatively blue, dominated by the optical light. (4) A non-thermal afterglow component is likely to be negligible since the optical and near-infrared spectra of SSS17a are dominated by a thermal component from the initial phases, at least t = 1.5 d (Pian et al. 2017). Utsumi et al. (2017) shows that rapid evolution of SSS17a is consistent with the expection of kilonova models. In this paper, we perform radiative transfer simulations of kilonovae, and study the mass ejection from the NS merger event GW170817.
2 Radiative transfer simulations
We perform radiative transfer simulations to calculate light curves and spectra of kilonovae. We use a wavelength-dependent radiative transfer code (Tanaka & Hotokezaka 2013; Tanaka et al. 2014; Tanaka 2016; Tanaka et al. 2017). For a given ejecta model, i.e., a density structure and element abundances, the code calculates photon transfer by the Monte Carlo method. For a given Ye (or distribution of Ye), the code adopts nuclear heating rates by r-process nucleosynthesis calculations by Wanajo et al. (2014). Then, time-dependent thermalization efficiency is taken into account by following the analytic methods presented by Barnes et al. (2016).
A transfer of optical and near-infrared photons is calculated by taking into account bound–bound, bound–free, and free–free transitions and electron scattering. Among them, the bound-bound transitions have a dominant contribution in the optical and near-infrared wavelengths. For the bound–bound transitions, the formalism of the expansion opacity (Eastman & Pinto 1993; Kasen et al. 2006) is used as in the previous kilonova simulations (Kasen et al. 2013; Barnes & Kasen 2013; Tanaka & Hotokezaka 2013). For atomic data, we use a line list by Tanaka et al. (2017), which is constructed by the atomic structure calculations for Se (Z = 34), Ru (Z = 44), Te (Z = 52), Nd (Z = 60), and Er (Z = 68) and supplemented by Kurucz’s line list for Z < 32 (Kurucz & Bell 1995). Note that since the atomic data include only up to doubly ionized ions, our calculations are applicable only after t > 0.5 d, when the temperature is low enough. The number density of each ion is calculated under an assumption of local thermodynamic equilibrium, and populations of excited levels are calculated by assuming the Boltzmann distribution.
For a density distribution in the ejecta, we adopt a simple power-law form (r−3) from v = 0.05c to 0.2c, which gives the average velocity of 〈v〉 = 0.1c, as a representative case (Metzger et al. 2010; Metzger 2017). We test three different element abundances, which approximate the dynamical ejecta and post-merger ejecta. The first case depicts the abundances in the dynamical ejecta. Numerical relativity simulations of NS mergers predict wide ranges of Ye in the dynamical ejecta (Sekiguchi et al. 2015, 2016; Radice et al. 2016; Foucart et al. 2016), which results in a wide elemental distribution from Z ∼ 30 to 100. Such element abundances are shown in the orange line in figure 1, which are calculated by assuming a flat Ye distribution from 0.10 to 0.40 (Wanajo et al. 2014). The second and third cases are for the post-merger ejecta. Since the element abundances are subject to uncertainties, we approximately take two representative values of Ye: high Ye (Ye = 0.30, blue line) and medium Ye (Ye = 0.25, green line). The high Ye model is completely lanthanide-free while the medium Ye model contains a small fraction of lanthanide elements. For all the models in this paper, the element distribution in the ejecta is assumed to be spatially homogeneous. Validity of this assumption is discussed in section 4.
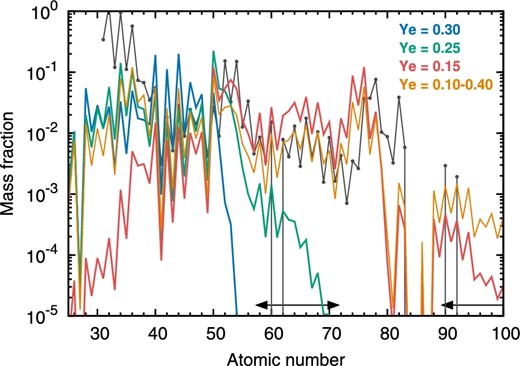
Element abundances at 1 d after the merger. The blue, green, and red lines show the abundance patterns calculated with Ye = 0.30, 0.25, and 0.15, respectively (Wanajo et al. 2014). The abundance patterns of Ye = 0.30 and 0.25 approximate the post-merger ejecta. The orange line shows the abundance by assuming a flat distribution of Ye from 0.10 to 0.40, which depicts the properties of the dynamical ejecta. The black line shows the solar abundances. Below show the arrows the lanthanide and actinide elements with high opacities.
3 Results
The left-hand panel of figure 2 compares the observed light curves of SSS17a (Utsumi et al. 2017) and the model with Ye = 0.10–0.40 (the dynamical ejecta model). We find that the ejecta mass of 0.03 M⊙ reasonably reproduces the near-infrared brightness near the peak. However, the calculated optical light curves are systematically fainter than the observations by 1.0–1.5 mag at the initial phases (t < 2 d). This is due to high optical opacities of lanthanide elements (Z = 57–71, Kasen et al. 2013; Barnes & Kasen 2013; Tanaka & Hotokezaka 2013; Fontes et al. 2017; Wollaeger et al. 2017). Because this model has a considerable fraction of lanthanide elements, the resulting kilonova at the initial phases is too red compared with the observations. The faint optical flux is also shown in figure 3, where the spectral energy distribution of SSS17a is compared with simulated spectra (orange line for Ye = 0.10–0.40). To explain the optical brightness, ejecta mass of ∼0.06 M⊙ is required, although such a model gives too bright near-infrared light curves.
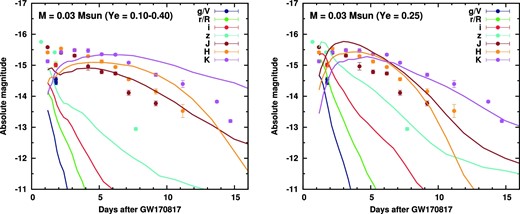
Optical and near-infrared light curves of SSS17a compared with kilonova models with (left) Ye = 0.10–0.40 and (right) Ye = 0.25. The optical and near-infrared data are taken from Utsumi et al. (2017). For the observed data, the line-of-sight extinction of E(B − V) = 0.1 mag has been corrected. All the magnitudes are given in AB magnitudes.
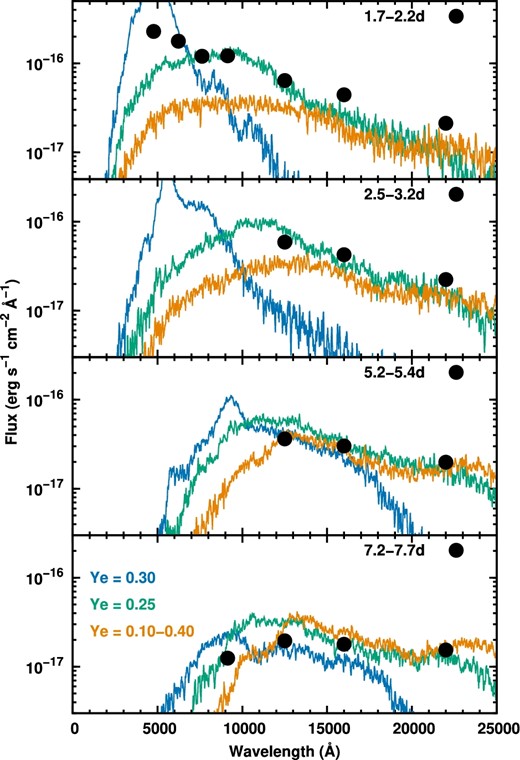
Time evolution of optical and near-infrared spectral energy distribution of SSS17a compared with three models. The observational data are taken from Utsumi et al. (2017). All of the three models assume the same ejecta mass (0.03 M⊙) and the same average velocity (〈v〉 = 0.1c). Orange curves show the model of the dynamical ejecta (Ye = 0.10–0.40) while blue and green curves show the models with the elemental abundances calculated with high Ye (Ye = 0.30) and medium Ye (Ye = 0.25), respectively.
The observed blue emission at the initial phases indicates a presence of the ejecta with relatively low opacities. The green curves in figure 3 show simulated spectra of the model with the ejecta mass of 0.03 M⊙ and Ye = 0.25. The overall agreement between the observed spectral energy distribution and that of the medium Ye model is satisfactorily well in both the optical and the near-infrared wavelengths from t = 2 d to 7 d. As expected from the good agreement with the spectral energy distribution, the model with medium Ye also reproduces the overall properties of the multicolor light curves (right-hand panel of figure 2). If the ejecta are completely free from lanthanide elements (Ye = 0.30, blue lines in figure 3), the spectra are too blue and do not produce enough flux in the near-infrared wavelengths (>10000 Å) at all the epochs.
4 Discussion
A comparison between our radiative transfer simulations and the observations of SSS17a provides insight on the ejected material in the NS merger event GW170817. We show that the observed near-infrared emission is nicely explained by 0.03 M⊙ of ejecta containing lanthanide elements (Ye = 0.10–0.40 or Ye = 0.25). However, the model with Ye = 0.10–0.40 does not reproduce the blue optical emission at the initial phases. On the other hand, if the ejecta are completely lanthanide free (Ye = 0.30), the emission is too blue compared with the observations. We find that, as far as a single component model is considered, the model with Ye = 0.25 containing a small fraction of lanthanide elements reproduces both optical and near-infrared emissions reasonably well.
What is the origin of such ejecta? The simulations of the dynamical mass ejection show that a stronger mass ejection occurs when radii of the NSs are smaller (i.e., when the equation of state of the NSs is soft), and thus, shock heating is more efficient. However, a possible maximum mass of the dynamical ejecta is about 0.01 M⊙ with currently available equations of states (e.g., Hotokezaka et al. 2013; Sekiguchi et al. 2015, 2016; Radice et al. 2016). An even higher mass ejection might be possible for a merger with an extreme mass ratio of two NSs. However, in such cases, a tidally disrupted component with a low Ye dominates (see the red line in figure 1 for the abundances with Ye = 0.15) and the emission would become even redder at the initial phases. By virtue of these facts, it is unlikely that the dynamical ejecta alone can power the entire optical and near-infrared emissions of SSS17a.
We suggest that a kilonova from post-merger ejecta plays a dominant contribution for SSS17a. The observed properties are nicely explained if the entire ejecta are moderately lanthanide-rich as in the case of Ye = 0.25. However, it does not necessarily mean that the ejecta should have only a single component. In reality, the ejecta would have an angular distribution of Ye, having higher Ye near a polar region (Perego et al. 2014; Fujibayashi et al. 2017). Therefore, more realistic situation may be a combination of spatially separated high-, medium-, and possibly low-Ye components as illustrated in figure 4. In fact, the model with medium Ye does not perfectly reproduce the flux at <5000 Å at t = 2 d and the agreement can be improved with a presence of small amount of high-Ye ejecta probably near the pole. Then, our line of sight may be somewhat off-axis so that we can observe both high- and medium-Ye regions. This may also explain the weakness of the gamma-ray emission (Connaughton et al. 2017; Goldstein et al. 2017; Savchenko et al. 2017a, 2017b).
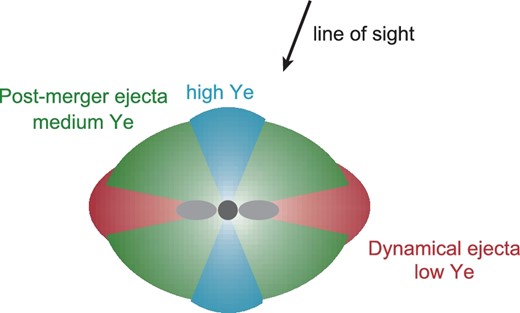
Schematic picture of the ejecta of the NS merger event GW170817.
Our interpretation implies that a large amount of ejecta with medium or high Ye is ejected during the post-merger phase. The large ejecta mass suggests that the viscous mass ejection is quite efficient in the NS merger event GW170817. A required dimensionless viscous α parameter is α ≳ 0.03 (Shibata et al. 2017). In addition, we speculate that a relatively long-lived massive NS is present after the merger (Metzger & Fernández 2014; Kasen et al. 2015; Lippuner et al. 2017) so that neutrino emission from the central NS can increase Ye of the surrounding disk as well as the ejecta from the disk. It is, however, noted that self-consistent simulations from merger to kilonova are necessary for drawing more quantitative conclusions.
5 Conclusions
We perform the radiative transfer simulations of kilonovae for the optical and near-infrared counterpart of GW170817. We show that the ejecta of 0.03 M⊙ containing lanthanide elements explain the observed near-infrared emission. However the low-Ye component alone cannot explain the optical emission at the initial phases. As far as a single component model is considered, the ejecta with medium Ye (∼0.25), which contain a small fraction of lanthanide elements, nicely explain both the optical and near-infrared emissions simultaneously. We suggest that the post-merger mass ejection plays a dominant contribution to the emissions.
Our results have implications to the origin of r-process elements. It is known that abundances of r-process elements in Galactic stars show an universal pattern similar to those of the Sun (e.g., Sneden et al. 2008), which implies that a certain phenomenon produces a wide range of r-process elements simultaneously. The observed properties of SSS17a suggest that the NS mergers eject not only dynamical ejecta producing r-process elements beyond the second peak, but also a substantial amount of post-merger ejecta with medium- or high-Ye material producing elements from the first to the second peaks. Therefore, the NS mergers seem to synthesize a full range of r-process elements (e.g., Just et al. 2015; Wu et al. 2016). A mass ejection with an order of 0.01 M⊙ is also enough to explain the total amount of r-process elements in our Galaxy (e.g., Piran et al. 2014; Hotokezaka & Piran 2015; Rosswog et al. 2017) with the current estimates of the event rate. These strengthen the hypothesis that the NS mergers are the origin of r-process elements in the Universe.
Acknowledgements
We thank Kenta Hotokezaka and Shinya Wanajo for fruitful discussion. Numerical simulations were carried out on the Cray XC30 at the Center for Computational Astrophysics, National Astronomical Observatory of Japan. This research was supported by the NINS program for cross-disciplinary science study, Inoue Science Research Award from Inoue Foundation for Science, the research grant program of the Toyota Foundation (D11-R-0830), the natural science grant of the Mitsubishi Foundation, the research grant of the Yamada Science Foundation, the MEXT KAKENHI (JP17H06363, JP15H00788, JP24103003, JP10147207, JP10147214), and JSPS KAKENHI (JP16H02183, JP15H02075, JP25800103, JP26800103). The IRSF project is a collaboration between Nagoya University and the South African Astronomical Observatory (SAAO) supported by Optical & Near-Infrared Astronomy Inter-University Cooperation Program from MEXT of Japan and the National Research Foundation (NRF) of South Africa.
References
