


Abstract
GW170817 is the first detected gravitational wave source from a neutron star merger. We present the Japanese collaboration for gravitational-wave electro-magnetic (J-GEM) follow-up observations of SSS17a, an electromagnetic counterpart of GW170817. SSS17a shows a 2.5 mag decline in the z band during the period between 1.7 and 7.7 d after the merger. Such a rapid decline is not comparable with supernovae light curves at any epoch. The color of SSS17a also evolves rapidly and becomes redder during later epochs: the z − H color has changed by approximately 2.5 mag during the period between 0.7 and 7.7 d. The rapid evolutions of both the color and the optical brightness are consistent with the expected properties of a kilonova that is powered by the radioactive decay of newly synthesized r-process nuclei. Kilonova models with Lanthanide elements can reproduce the aforementioned observed properties well, which suggests that r-process nucleosynthesis beyond the second peak takes place in SSS17a. However, the absolute magnitude of SSS17a is brighter than the expected brightness of the kilonova models with an ejecta mass of 0.01 M⊙, which suggests a more intense mass ejection (∼0.03 M⊙) or possibly an additional energy source.
1 Introduction
After the first detections of gravitational wave (GW) events from binary black hole (BBH) coalescence (Abbott et al. 2016a, 2016b, 2017a), the detection of GWs from a compact binary coalescence including at least one neutron star (NS) has been eagerly awaited. This is because the compact binary coalescence including an NS is expected to be accompanied by a variety of electromagnetic (EM) emissions. An optical and near-infrared (NIR) emission driven by the radioactive decays of r-process nuclei, “kilonova” or “macronova” (Li & Paczyński 1998; Kulkarni 2005; Metzger et al. 2010), is one of the most promising EM counterparts. Optical and NIR observations of these events enable us to understand the origin of r-process elements in the Universe as emission properties reflect the ejected mass and abundances of r-process elements (e.g., Kasen et al. 2013; Barnes & Kasen 2013; Tanaka & Hotokezaka 2013; Tanaka et al. 2014; Metzger & Fernández 2014; Kasen et al. 2015).
On 2017 August 17, 12:41:04 GMT, the LIGO (Laser Interferometer Gravitational-Wave Observatory) Hanford observatory (LHO) identified a GW candidate in an NS merger (The LIGO Scientific Collaboration and the Virgo Collaboration 2017b). The subsequent analysis with three available GW interferometers including the LIGO Livingston Observatory (LLO) and the Virgo shrank the localization to 33.6 deg2 for a 90% credible region (The LIGO Scientific Collaboration and the Virgo Collaboration 2017c) and confirmed the detection (GW170817: Abbott et al. 2017b). A Fermi-GBM trigger, approximately 2 s after the coalescence, coincided with this GW event and provided additional initial information regarding the localization with an error radius of 17.°45 (The LIGO Scientific Collaboration and the Virgo Collaboration 2017a), which covers the area localized by the GW detectors. Coulter et al. (2017a, 2017b) reported a possible optical counterpart SSS17a, within the localization area, near NGC 4993. The source located at (α, δ) = (13h09m48|${^{\rm s}_{.}}$|07, −23°22΄53|${^{\prime\prime}_{.}}$|3), 10″ away from NGC 4993 (figure 1), is an S0 galaxy at a distance of ∼40 Mpc (Freedman et al. 2001).
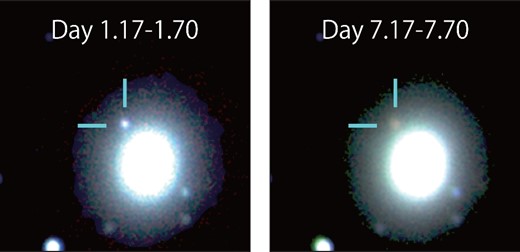
Three-color composite images of SSS17a using z-, H-, and Ks-band images. The size of the image is 56″ × 56″. From left to right, the combined images created from the images taken between t = 1.17 and 1.70 d and between t = 7.17 and 7.70 d are shown.
We conducted coordinated observations in the framework of Japanese collaboration for Gravitational-wave Electro-Magnetic follow-up (J-GEM) (Morokuma et al. 2016; Yoshida et al. 2017; Utsumi et al. 2017) immediately after the discovery of the strong candidate SSS17a and investigated the characteristics of the optical and NIR emission. In this paper, we present the results of the J-GEM follow-up observations of SSS17a. All magnitudes are given using the unit of AB.
2 J-GEM Observations
A broad geometrical distribution of observatories was required to observe SSS17a because it was visible for a limited amount of time after sunset in the northern hemisphere. J-GEM facilities were suitable for observing this target because they are distributed all over the Earth in terms of the longitude, which included the southern hemisphere where the visibility was better. We used the following facilities to perform follow-up optical observations of GW170817: 8.2 m Subaru/HSC (Miyazaki et al. 2012) and MOIRCS (Suzuki et al. 2008) at Mauna Kea in the United States; 2.0 m Nayuta/NIC (near-infrared imager) at the Nishi-Harima Astronomical Observatory in Japan; 1.8 m MOA-II/MOA-cam3 (Sako et al. 2008; Sumi et al. 2016) and the 61 cm Boller & Chivens telescope (B&C)/Tripol5 at the Mt. John Observatory in New Zealand; 1.5 m Kanata/HONIR (Akitaya et al. 2014) at the Higashi-Hiroshima Astronomical Observatory in Japan; 1.4 m IRSF/SIRIUS (Nagayama et al. 2003) at the South African Astronomical Observatory; and 50 cm MITSuME (Kotani et al. 2005) at the Akeno Observatory in Japan.
J-GEM measurements of SSS17a.
| Epoch | Filter | Mag* | MagErr | Instrument |
|---|---|---|---|---|
| (d) | (AB) | (AB) | ||
| 0.70 | z | 17.40 | 0.01 | Subaru/HSC |
| 1.17 | J | 17.51 | 0.03 | IRSF/SIRIUS |
| 1.17 | H | 17.64 | 0.04 | IRSF/SIRIUS |
| 1.17 | K s | 17.91 | 0.05 | IRSF/SIRIUS |
| 1.70 | z | 17.74 | 0.01 | Subaru/HSC |
| 1.78 | g | 18.80 | 0.07 | B&C/Tripol5 |
| 1.78 | r | 18.26 | 0.04 | B&C/Tripol5 |
| 1.78 | i | 18.19 | 0.06 | B&C/Tripol5 |
| 1.78 | R | 18.32† | 0.07 | MOA-II/MOA-cam3 |
| 1.79 | V | 18.89† | 0.07 | MOA-II/MOA-cam3 |
| 2.17 | J | 17.69 | 0.04 | IRSF/SIRIUS |
| 2.17 | H | 17.52 | 0.04 | IRSF/SIRIUS |
| 2.17 | K s | 17.61 | 0.04 | IRSF/SIRIUS |
| 3.17 | J | 17.78 | 0.05 | IRSF/SIRIUS |
| 3.17 | H | 17.57 | 0.04 | IRSF/SIRIUS |
| 3.17 | K s | 17.55 | 0.05 | IRSF/SIRIUS |
| 4.18 | J | 18.13 | 0.12 | IRSF/SIRIUS |
| 4.18 | H | 17.77 | 0.04 | IRSF/SIRIUS |
| 4.18 | K s | 17.57 | 0.07 | IRSF/SIRIUS |
| 5.18 | J | 18.31 | 0.06 | IRSF/SIRIUS |
| 5.18 | H | 17.94 | 0.05 | IRSF/SIRIUS |
| 5.18 | K s | 17.68 | 0.04 | IRSF/SIRIUS |
| 6.20 | J | 18.36 | 0.05 | IRSF/SIRIUS |
| 6.20 | H | 18.12 | 0.04 | IRSF/SIRIUS |
| 6.20 | K s | 17.69 | 0.03 | IRSF/SIRIUS |
| 7.17 | J | 18.98 | 0.08 | IRSF/SIRIUS |
| 7.17 | H | 18.51 | 0.05 | IRSF/SIRIUS |
| 7.17 | K s | 17.95 | 0.04 | IRSF/SIRIUS |
| 7.70 | z | 20.21 | 0.04 | Subaru/HSC |
| 9.18 | J | 19.32 | 0.08 | IRSF/SIRIUS |
| 9.18 | H | 18.90 | 0.09 | IRSF/SIRIUS |
| 9.18 | K s | 18.34 | 0.06 | IRSF/SIRIUS |
| 11.17 | H | 19.53 | 0.21 | IRSF/SIRIUS |
| 11.17 | K s | 18.64 | 0.12 | IRSF/SIRIUS |
| 14.27 | K s | 19.35 | 0.04 | Subaru/MOIRCS |
| 15.27 | K s | 19.97 | 0.05 | Subaru/MOIRCS |
*The magnitudes listed here are the values before the Galactic extinction correction.
†MOA-II/MOA-cam3 measurements are calibrated using the empirical relation. Uncertainties regarding the conversion are large but not taken into account in the error.
We reduced all the raw images obtained using the aforementioned instruments in a standard manner. After eliminating the instrumental signatures, we made astrometric and photometric calibrations. The astrometric calibrations were performed with astrometry.net (Lang et al. 2010) using the default reference catalog USNO-B1.0 (Monet et al. 2003), while the PanSTARRS catalog (Chambers et al. 2016) was used for the HSC calibration because it is a standard catalog for the HSC reduction. The number density of stars in the B&C/Tripol5 images was not sufficient for solving the astrometric solution using astrometry.net. We therefore used Scamp (Bertin 2006) for the B&C/Tripol5 image astrometric calibration instead. The photometric calibrations were performed using the PanSTARRS catalog for the optical data and the 2MASS catalog (Cutri et al. 2003) for the NIR data. We did not apply system transformation for adjusting small differences between the band systems because it required the assumption of a spectrum of the source, except in the case of the MOA-cam3 photometry. The R band used by MOA-cam3 of MOA-II is largely different from the standard Johnson system. We determined an empirical relation for the differences between the catalog magnitudes and the instrumental magnitudes as a function of the color constructed from the instrumental magnitudes (e.g., Koshimoto et al. 2017). Using Lupton’s equation, the catalog magnitudes were converted from the PanSTARRS magnitude to the Johnson system.1 We converted Vega magnitudes to AB magnitudes using the method specified in Blanton and Roweis (2007).
A large contamination from NGC 4993 was a problem in performing an accurate measurement of the flux of SSS17a (figure 1). In order to minimize the systematic uncertainties in the techniques of background subtraction and photometry used for obtaining our measurements, we applied the same procedure for all the data, which is described as follows. First, we subtracted the host galaxy component from the reduced image using GALFIT (Peng et al. 2002). The model employed was a Sersic profile with free parameters describing the position, integrated magnitude, effective radius, Sersic index, axis ratio, and position angle. A point-spread function (PSF) model constructed using PSFEx (Bertin 2011) was used in the fitting procedure. Once the fitting converged, GALFIT generated residual images. We obtained photometry from the images in which the target was clearly visible after the subtraction. We then ran SExtractor 2.19.5 (Bertin & Arnouts 1996) on the residual images, thus enabling the local sky subtraction with a grid size of 16 pixels—which was larger than the seeing size for all measurements—and the PSF model fitting for photometry. The residuals of the host galaxy subtraction could be reduced owing to this local sky subtraction. We adopted MAG_POINTSOURCE, an integrated magnitude of the fitted PSF, as a measure of magnitude and MAGERR_POINTSOURCE as the error of the measurements. We confirmed that the measurements for z band obtained from SExtractor were consistent with those of hscPipe, which is a standard pipeline of HSC reduction (Bosch et al. 2017). We also confirmed that the brightness of a reference star was constant in all the measurements for an individual instrument. The measurements are presented in table 1.
3 Results
The top panel of figure 2 shows the light curves of SSS17a in various bands based on our photometry. The magnitudes have been corrected for the Galactic extinction by assuming E(B − V) = 0.10 mag (Schlafly & Finkbeiner 2011). We do not consider the measurements obtained using Kanata/HONIR, Nayuta/NIC, and MITSuME because the measurements are not reliable owing to the strong contamination from twilight or bad weather.
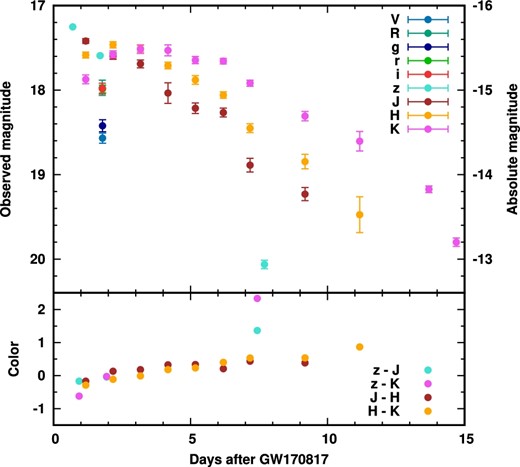
Light curves and color evolution of SSS17a. The face color is changed with the respective bands. The Galactic extinction has been corrected by assuming E(B − V) = 0.1 mag (Schlafly & Finkbeiner 2011).
A remarkable feature of SSS17a is the rapid decline in the z-band brightness by 2.5 mag in 6 d. In contrast, the fluxes in the NIR bands decline more slowly than those in the optical band. The densely sampled observations by IRSF/SIRIUS exhibit a slight brightening at the earliest epochs in the H and Ks bands and demonstrate that the light curves in the redder bands start to decline subsequently and fade more slowly. The declines in 6 d after the peak are 1.47 mag, 1.33 mag, and 0.96 mag in the J band, H band, and Ks band, respectively.
These features are also depicted in the evolution of colors in the z, J, H, and Ks bands (as shown in the bottom panel of figure 2). The colors in the z band and the NIR band rapidly become redder, and the reddening in 6 d are 2.43 mag and 1.00 mag in the z − Ks color and z − J color respectively. In contrast, the reddening in the colors in the NIR bands are as slow as 0.34 mag in the J − H color and 0.83 mag in the H − Ks color. As a result, the optical-NIR color of SSS17a progressively becomes redder with time (figure 1).
4 Origin of SSS17a
Figure 3 shows the z-band light curves for SSS17a, Type Ia supernova (SN Ia: Nugent et al. 2002), Type II plateau supernova (SN IIP: Sanders et al. 2015), and three kilonova models with an ejecta mass of Mej = 0.01 M⊙ as mentioned by Tanaka et al. (2017a). The kilonova models are a Lanthanide-rich dynamical ejecta model and post-merger wind models with a medium Ye of 0.25 and high Ye of 0.30. The model with Ye = 0.25 contains a small fraction of Lanthanide elements while that with Ye = 0.30 is Lanthanide-free. The rapid decline of SSS17a is not similar to the properties of known supernovae, and the z-band magnitude of SSS17a at t = 7.7 d is >3 mag fainter than supernovae Ia and IIP. However, the rapid decline of SSS17a is consistent with the expected properties of kilonovae, although SSS17a is 1–3 mag brighter than all the three kilonova models.
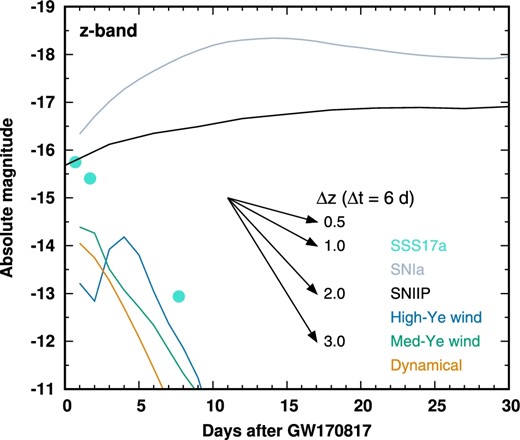
Absolute magnitude of z-band observations (dots) compared with models of supernovae (SN Ia and SN IIP in gray curves) and kilonovae (colored curves). The kilonova models are calculated assuming that the mass of the ejecta from a neutron star merger Mej is 0.01 M⊙. The absolute magnitudes of the kilonova models quickly decline as compared with supernovae. The z-band light curve of SSS17a follows the decline of the kilonova models although the observed magnitudes are 1–3 magnitude brighter than the model predictions. The arrows indicate the behaviors of the brightness decline corresponding to various Δz, which is the difference in the magnitude of the two epochs for an interval of Δt = 6 d.
The rapid evolution of SSS17a is characterized by a magnitude difference in the z band (Δz) between t = 1.7 d and 7.7 d (6 d interval). The red point in figure 4 shows the Δz and i − z color at t = 1.7 d (see Utsumi et al. 2017). For the purpose of comparison, we show Δz in a 6 d interval and (i − z)1st color at the 1st epoch for supernovae using the spectral template of Nugent, Kim, and Perlmutter (2002). The points show Δz and (i − z)1st with a 1 d step from the day of the merger, and their time evolutions are connected by lines. The fastest decline observed for supernovae is approximately 0.5 mag in 6 d, and therefore, models of supernovae cannot explain the rapid decline of SSS17a. The wind model with medium Ye (Ye = 0.25) at t = 1 d or 2 d provides the best agreement with the observation.
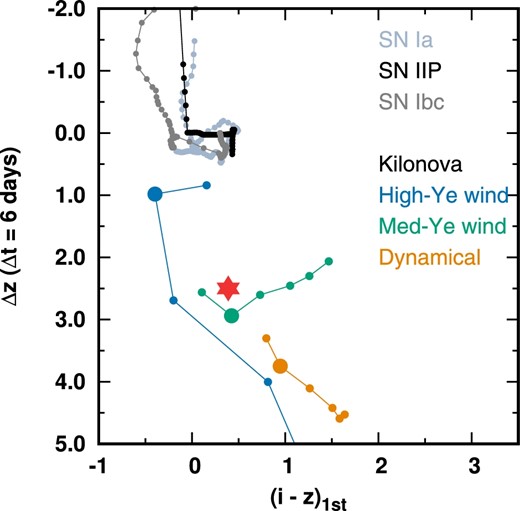
Result of the photometry of SSS17a is plotted on Δz and (i − z)1st plane with kilonova and supernova models. For SSS17a (red symbol), Δz is the magnitude difference between the two epochs, t = 1.7 and 7.7 d (Δt = 6 d) after the detection of GW170817, and (i − z)1st is the color at the first epoch (t = 1.7 d). The models for kilonovae and supernovae are shown by colored dots and gray dots, respectively. Each dot corresponds to different starting epoch of Δt with an increment of 1 d. The larger dots in the kilonova model loci show the values for the case that the starting epoch of Δt is the 2nd day from the merger. The kilonova models are located far from the crowds of those for supernovae at 40 Mpc, especially in terms of Δz. The data point of SSS17a is consistent with the model of medium Ye wind.
The color evolution of SSS17a is also consistent with that of kilonova models. Figure 5 shows the z − H and J − H color curves of SSS17a as compared with those of the three kilonova models. The J − H color and the absence of the strong evolution are broadly consistent with the models. The z − H color and its temporal reddening are similar to those of the models comprising Lanthanide elements. In contrast, the z − H color of SSS17a is not consistent with the Lanthanide-free model (blue curve in figure 5), i.e., the high opacities of Lanthanide elements provide a better description of SSS17a.
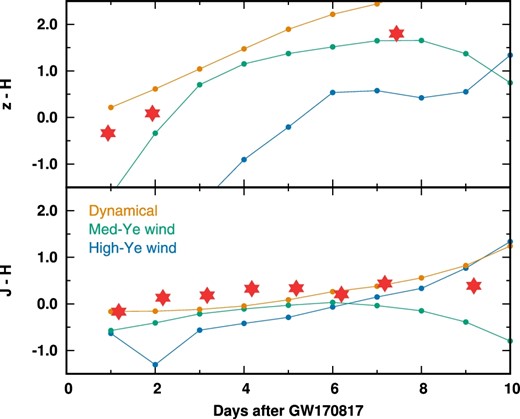
Time evolutions of z − H and J − H colors compared with the kilonova models.
The properties of SSS17a—the rapid evolution, red color, and rapid reddening—are consistent with the standard model of a kilonova. The color evolution suggests that the ejecta contain a small amount of Lanthanide elements. This means that r-process nucleosynthesis beyond the 2nd peak takes place in the NS merger event GW170817/SSS17a. However, the absolute magnitude of the brightness of SSS17a is greater than that of the kilonova models of Mej = 0.01 M⊙. This discrepancy can be explained by adopting a larger ejecta mass, e.g., Mej = 0.03 M⊙, which gives a higher radioactive luminosity. Since the high ejecta mass makes the timescale of the longer, a higher ejecta velocity may also be required to keep the good agreement in the timescale shown in our paper (Tanaka et al. 2017b). Or possibly, a higher luminosity can be accounted for by an additional energy source, such as the cocoon emission (Gottlieb et al. 2018).
5 Summary
We present J-GEM observations of SSS17a, a promising EM counterpart to GW170817. Intensive observations are performed with Subaru (z and Ks bands), IRSF (J, H, and Ks bands), B&C (g, r, and i bands), MOA-II (V and R bands), Nayuta (J, H, and Ks band), Kanata (H band), and MITSuME (g, r, and i band) telescopes. SSS17a exhibits an extremely rapid decline in the z band, which is not explained by any type of supernova at any epoch. In addition, the evolution of the color is quite rapid; the z − H color is changed by approximately 2.5 mag in 7 d. We show that the observational properties, i.e., rapid evolution of the light curves, the red color, and its rapid evolution, are consistent with models of kilonovae having Lanthanide elements. This indicates that r-process nucleosynthesis beyond the second peak takes place in the NS merger event GW170817. However, the absolute magnitude of SSS17a is brighter than that of kilonova models of Mej = 0.01 M⊙. This suggests that the mass ejection is more vigorous (∼0.03 M⊙) or that there is an additional energy source.
Acknowledgements
We are grateful to the staff of Subaru Telescope, South African Astronomical Observatory, and University of Canterbury Mt. John Observatory for their help for the observations of this work. We thank Dr. Masato Onodera and Prof. Takashi Nakamura who provided insightful comments, and Dr. Nobuhiro Okabe who provided a computational resource. This work was supported by MEXT KAKENHI (JP17H06363, JP15H00788, JP24103003, JP10147214, JP10147207) and JSPS KAKENHI (JP16H02183, JP15H02075, JP15H02069, JP26800103, JP25800103), the research grant program of the Toyota Foundation (D11-R-0830), the natural science grant of the Mitsubishi Foundation, the research grant of the Yamada Science Foundation, the National Institute of Natural Sciences (NINS) program for cross-disciplinary science study, Inoue Science Research Award from Inoue Foundation for Science, Optical & Near-Infrared Astronomy Inter-University Cooperation Program from the MEXT, and the National Research Foundation of South Africa. This work is based on data collected at the Subaru Telescope, which is operated by the National Astronomical Observatory of Japan, NINS.
References
