


Abstract
We report on simultaneous very long baseline interferometry (VLBI) mapping of 28SiO v = 1, 2, 3, and 29SiO v = 0 J = 1 → 0 maser lines at the 7 mm band toward the semi-regular variable star, W Hydrae (W Hya), using the new data acquisition system (OCTAVE-DAS), installed in the VLBI Exploration of Radio Astrometry (VERA) array and temporarily operated in the 45 m telescope of the Nobeyama Radio Observatory. Although these masers were spatially resolved, their compact maser spots were fortunately detected in the 1000 km baselines of VERA. We found the locations of the v = 3 maser emission which are unexpected from the currently proposed maser pumping models. Mapping of the 29SiO maser line in W Hya is the third result after those in WX Psc and R Leo. This paper shows the scientific implication of simultaneous VLBI observations of multiple SiO maser lines as realized by using the OCTAVE system.
1 Introduction
Very long baseline interferometry (VLBI) observations with a wider bandwidth enable us to improve sensitivity to continuum spectrum sources. With a high dispersion spectroscopic signal correlation and data processing, one may also be able to simultaneously observe multiple spectral lines such as masers, the rest frequencies of which are located within a single wide-band receiver channel. Such VLBI observations have recently become realistic through the new signal recording systems that cover a total bandwidth of over 1 GHz and the new correlation systems that can deal with data divided into over 10000 spectral channels. One can find some combinations of maser lines within such a wide band: silicon monoxide (SiO) molecules have four detectable maser lines—the v = 1, 2, and 3 J = 1 → 0 transitions and the v = 0 J = 1 → 0 transition of 29SiO—and a thermal (or possible maser) line of the v = 0 J = 1 → 0 transition within 1 GHz at the 7 mm band. Completely simultaneous line observations provide advantages of more efficient observation operations and a more reliable comparison of flux density scales and relative locations among the masers (e.g., Imai et al. 2012).
SiO masers are expected to provide an important probe into the dynamical structures and the physical conditions in the innermost part of the circumstellar envelopes (CSEs) of asymptotic giant branch (AGB) stars and post-AGB stars. However, the pumping mechanism of SiO masers is still a puzzling question and the understanding of the mechanism is essential to the diagnostics of the CSEs. Theoretical models of SiO maser excitation have proposed mainly two different types of maser pumping on the basis of collisional and radiative pumping schemes (e.g., Humphreys et al. 2002; Soria-Ruiz et al. 2004 and references therein). 28SiO maser lines of v = 1 and v = 2 J = 1 → 0 at the 7 mm band have been main targets of VLBI imaging. However, it is difficult to identify the most plausible pumping scheme with only images of these lines.
The v = 1 J = 2 → 1 maser line at the 3 mm band has also been mapped together with the J = 1 → 0 lines. The locations of the J = 2 → 1 lines at a larger distance from the central star than those of the J = 1 → 0 lines suggest the line-overlapping scheme as the more plausible one, in which SiO molecules are excited by mid-infrared radiation from H2O molecules (e.g., Soria-Ruiz et al. 2004 and references therein). On the other hand, one can find and observe the v = 3 J = 1 → 0 line simultaneously with the brighter v = 1 and v = 2 lines mentioned above. The v = 3 line seems to perform differently from other J = 1 → 0 lines (Imai et al. 2010; Desmurs et al. 2014), but its dominant pumping scheme is still unclear.
The v = 0 J = 1 → 0 maser line of 29SiO is also a unique one and is proposed to be dominated by the line-overlapping pumping, similarly in the case of 28SiO masers (Soria-Ruiz et al. 2004, 2007). The v = 0 J = 1 → 0 maser line of 30SiO was detected by Barcia, Alcolea, and Bujarrabal (1989), but no VLBI mapping has yet been performed, probably because of too large a separation of its rest frequency (42.37 GHz) from those usually observed in VLBI (≥42.5 GHz). In this paper, we report the first spectral line VLBI observations of circumstellar SiO maser lines using our new OCTAVE system. This paper focuses on the issues of the reduction of wide-band spectroscopic VLBI data taken using this system. We discuss the scientific implications of the SiO masers based on the initial results of the present observations.
2 Overview of the OCTAVE system
The OCTAVE system, which is composed of a new data acquisition system (hereafter abbreviated to OCTAVE-DAS) and Correlator systems belonging to the “OCTAVE-Family” (Oyama et al. 2012), has been developed since the Optically Connected Array for VLBI Exploration (OCTAVE) experiments (Kawaguchi et al. 2001; Fujisawa et al. 2001; Hasegawa et al. 2004; Takaba et al. 2008; Doi et al. 2009; Kono et al. 2012). The OCTAVE system has been developed on the basis of the VLBI Standard Hardware Interface (VSI-H)1 and the VLBI Data Interchange Format (VDIF)2 specifications. It consists of four functions: (1) high-speed sampler, at a rate of 8 giga-samples per second (Gsps) in a 3-bit quantization radio frequency (RF) direct analog-to-digital converter (OCTAD), which enables us to acquire not only wide intermediate frequency (5–7 GHz) but also radio frequency up to 50 GHz with digital base-band converter (DBBC) functions for the VLBI Global Observing System (VGOS);3 (2) converters (OCTAVIA and OCTAVIA2) between one 10 GigE port and four 2 Gbps (gigabits per second) input and output ports conformable to VSI-H; (3) high speed recorders (OCTADISK, OCTADISK2, and VSREC) enable us to record raw data at a rate of 4.5 Gbps and above 8 Gbps; and (4) real-time hardware XF-type correlators (OCTACOR) and software FX-type correlators (OCTACOR2) based on the GICO3 (e.g., Kimura & Nakajima 2002). These are connected via 10 GigE networks with VDIF and VSI specifications. Figure 1 shows an example of the OCTAVE system. Each OCTAVE instrument is compliant with VSI-H and 10 Gb Ethernet protocol (GbE), so it is possible to replace old instruments of VSI-H with new instruments of 10 GbE gradually, and these can be connected to other recorders named Mark5B, C, developed by Haystack observatory (Whitney et al. 2010), and to other software correlators such as DiFX (Deller et al. 2007). Because the sampled data are transferred through a 10-GbE hub, it is easy to duplicate data using multicast protocol and the data are simultaneously transferred to each instrument (such as spectrometers, digital filters, and recorders). This digital signal equipment is currently designed based on personal computing architecture. Because this has an affinity for Ethernet protocol, it is easy to develop digital systems at a low cost. These components have been used for the VLBI Exploration of Radio Astrometry (VERA), the Japanese VLBI Network (JVN) and the Korea–Japan Correlation Center (KJCC) processor. The specifications and technical issues of the OCTAVE system will be published in a separate paper. The new OCTAVE system and accompanying instruments, which have recently been installed in the back-end of VERA, can cover a total frequency bandwidth of up to 3 GHz, enabling us to observe simultaneously all the SiO maser lines described above.
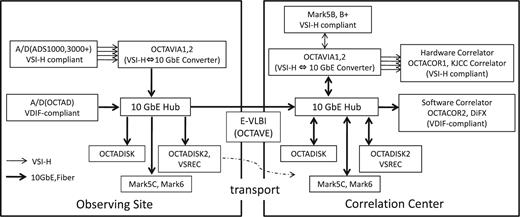
Example of a block diagram using OCTAVE-DAS.
3 Observations and data reduction
3.1 Observation setups
We have conducted VLBI observations of SiO masers associated with the semiregular variable star W Hya at three epochs during 2013 May–June using four 20 m telescopes of VERA and the 45 m telescope of the Nobeyama Radio Observatory (NRO). A typical system-noise temperature was 350–500 K in the VERA telescopes and 250–400 K in the NRO 45 m telescope toward W Hya at low antenna elevations. The observation of each epoch originally aimed to map, by using old VLBI back-end systems within two days, 28SiO maser emission of the v = 1, 2, and 3 J = 1 → 0 transition and 29SiO maser emission of v = 0 J = 1 → 0 transition. Their rest frequencies are 43.122027, 42.820582, 42.519340, and 42.879850 GHz, respectively. The observing sequence involved scans on W Hya as a target source and on 3C 273B and J133739.8–125725 as bandpass calibrators. These sources were achieving each 1500 s and 180 s of on-source time for one sequence. This sequence was repeated in every 40 min. Using the dual-beam system, the VERA telescopes simultaneously observed the reference source J135146.8−291218 with W Hya for high-precision maser astrometry. Figure 2 shows a block diagram of the present VERA back-end system for broad-band observations. The present observations received radio signals in left circular polarization and they were converted to signals of an intermediate frequency (IF) band of 4.7–7 GHz. The IF signals were split and converted further down to base-band channels to be digitized using the ADS1000 and ADS3000+ formatters developed by NICT (Takeuchi et al. 2006; Takefuji et al. 2010), both in four quantized levels. The formatter outputs had one and four base-band channels (BBCs), each with a bandwidth of 512 MHz.
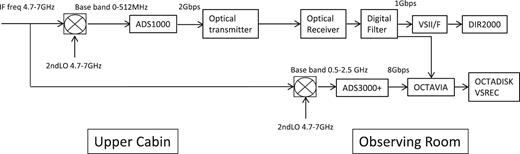
Block diagram of the present VERA back-end system for broad-band observations.
The ADS1000 output signals were filtered using the VERA digital filter unit that yielded 16 BBCs, each with a bandwidth of 16 MHz (Iguchi et al. 2005), and were recorded onto SONY DIR1000 and DIR2000 tapes, which were conventional in the VERA back-end system. Two out of the 16 BBCs were used for the maser observations and their signals were recorded onto the DIR1000 and DIR2000 tapes. The other BBCs were used as reference source observations and their signals were recorded onto the DIR2000 tapes. In order to observe all the target maser transitions, each observation epoch lasted for two days, so as to observe the v = 3 and 2 lines on the first day and the v = 2 and 1 lines on the second day. Each observation lasted for six hours on each day.
In addition to the conventional system, the ADS3000+ output signals were transferred to OCTAVIA and then recorded onto OCTADISKs. Because the signals in two out of four BBCs were recorded, this formatter yielded a total bandwidth of 1024 MHz, sufficient to cover all the target maser lines, except the 30SiO line, at the same time. Because the frequency coverage of the IF channel was switched on the first and second days, all the maser lines including the v = 3 line was observed only on the first day in each epoch. In the NRO, only DIR1000 and OCTAVE-DAS (temporarily installed) were available. As such, we used conventional systems (DIR1000 and DIR2000) for 2-beam phase-reference astrometry observations with VERA, in spite of the narrow-band width, and the new broad-band OCTAVE-DAS for simultaneous VLBI mapping of 28SiO v = 1, 2, 3 and 29SiO v = 0 J = 1 → 0 SiO maser lines with VERA and the NRO 45 m. Table 1 gives the basic information of all observations discussed in this paper.
Summary of the VERA observations of the W Hya SiO masers.
| Code* | Date/ | Telescopes,† SiO maser lines‡ and back-end | Remarks§ | |||||
|---|---|---|---|---|---|---|---|---|
| UT time | OCTAVE | DIR1000 | DIR2000 | |||||
| (in 2013) | Antennas | SiO lines | Antennas | SiO lines | Antennas | SiO lines | ||
| r13128a | May 8 | MROS | v = 1 | MROSN | v = 2,3 | MROS | v = 2,3 | a, c, d |
| 10:41–15:37 | ||||||||
| r13129a | May 9 | MROSN | v = 0,1,2 | MROSN | v = 2 | MROS | v = 2 | a, c, e |
| 10:37–15:33 | ||||||||
| r13146a | May 26 | MROS | v = 0, 1, 2, 3 | – | – | – | – | a, f |
| 09:46–14:28 | ||||||||
| r13147a | May 27 | MROS | v = 0, 1, 2, 3 | – | – | – | – | b, f |
| 09:42–14:24 | ||||||||
| r13158a | June 7 | MROS | v = 0, 1, 2, 3 | MROSN | v = 2,3 | MROS | v = 2,3 | a, c |
| 09:00–13:41 | ||||||||
| r13159a | June 8 | MROS | v = 0, 1, 2, 3 | MROSN | v = 2 | MROS | v = 2 | b, c, d, g |
| 08:55–13:37 | ||||||||
*Observation code r13dddx, where ddd indicates the current day of the year 2013 when the observation was made and x (a,b,...) the order of the observation in the same day.
†Telescope in which the data recorded with the used system were available. M: the 20 m telescope at the VERA Mizusawa station; R: VERA Iriki; O: VERA Ogasawara; S: VERA Ishigakijima; N: the 45 m telescope of the Nobeyama Radio Observatory.
‡SiO J = 1 → 0 maser lines successfully recorded using the OCTAVE-DAS (v = 0 for 29SiO and v = 1, 2, and 3 for 28SiO).
§Remarks. a: SiO J = 1 → 0 v = 0 for 28SiO thermal or maser lines successfully recorded using the OCTAVE-DAS; b: SiO J = 1 → 0 v = 0 for 30SiO maser lines successfully recorded using the OCTAVE-DAS; c: The maser astrometry was successful with the DIR2000 data; d: Missing recorded data in one of the base-band channels; e: Mistake in frequency band allocation in the Digital Filter Unit, causing the v = 1 data missing in the DIR1000 and 2000 outputs; f: Mistake in VERA dual beam setting, causing the maser data missing; g: Too high system noise temperature (Tsys > 600 K) in Iriki and Ogasawara.
3.2 Data correlation, data reduction, and image cube synthesis
The data correlation was processed with the Mitaka FX correlator for the DIR1000 and DIR2000 data and with the software correlator OCTACOR2 for the OCTADISK data respectively. The “zoom modes” of the data correlation for narrow bandwidths of maser emission (16 and 8 MHz) yielded velocity channel spacings of 0.22 and 0.11 km s−1 for these correlator outputs, respectively. The data of all the BBCs were again correlated to obtain the continuum source data for fine delay calibration. In this paper, we mainly report the results of processing the data obtained from the OCTADISK/OCTACOR2 outputs. We also report on the DIR2000 data processing in order to superimpose the obtained SiO maser maps onto a common coordinate system built by the fringe phase-referencing to visibility data of the reference source.
Data reduction and image cube synthesis were performed using the NRAO AIPS package, which is now externally controlled by the ParselTongue/python pipeline scripts.4 First, calibrations of visibility amplitudes for antenna gains and bandpass characteristics and of visibility phases for instrumental group-delay and phase residuals were made in a standard manner by using scans of the continuum calibrators. The uncertainty of the group-delay residuals is as small as 50 pico-seconds, causing only 0.03 fringe phase rotation along a total frequency width of ∼600 MHz to cover the target maser lines. The phase residual solutions obtained using the calibrator scans were edited to obtain those at the reference frequencies of the maser data. We developed a Python script that reads the information necessary for this calculation, deals with the calculation itself, and uploads the calculation solutions into AIPS.
Here, one may note that the reduction of such wide-band VLBI data requires careful calibration of geometrical and instrumental delays for data from a telescope that is not necessarily dedicated to high-precision VLBI astrometry. In the Appendix, we attach the report of measuring the station coordinates of the NRO 45 m telescope in order to explain our recent efforts on the coordinate measurement and the calibration of the instrumental delay of the telescope.
Secondly, fringe fitting and self-calibration were performed using visibilities in the velocity channel that included a bright v = 2 maser spot (velocity component). The Doppler velocity was given with respect to the local standard of rest (LSR). The calibration solutions were applied to the data in the other velocity channels of the v = 2 maser and to those in the other maser lines. Note that the post-processing software for precise delay-tracking (Jike et al. 2005) is still in the development of the OCTAVE-DAS output, causing imperfect delay-tracking. This significantly affected the quality of the v = 1 maser: the difference between its rest frequency and that of the v = 2 maser is relatively large (304 MHz). In order to obtain a better quality of the v = 1 map, we calibrated the v = 1 maser data independently using the v = 1 maser emission itself. Finally, maser image cubes were synthesized using naturally weighted visibilities through CLEAN deconvolution.
We have also conducted astrometric data processing using the DIR2000 data as previously made (Imai et al. 2012) by determining the relative coordinates of the reference continuum source J135146.8−291218 and the v = 1 and v = 3 maser spots with respect to the phase-reference maser spot in the v = 2 maser. Thus a composite map was yielded from these maser maps, which were put in a common reference frame. The possible systematic positional shifts claimed by Imai et al. (2010, 2012) in the phase-referenced maps were expected to be less than 0.6 mas (see subsection 4.2). Therefore, a lack of astrometric information does not affect the interpretation of relative angular distributions of the different maser lines in this paper as long as the phase-referenced maps are used in the composite maps.
The present observations were composed of six observation codes (r13128a, r13129a, r13146a, r13147a, r13158a, and r13159a), each of which corresponds to an observation made on a specific date (e.g., r13128a for 2013 May 8). However, the data outputs from the OCTAVE-DAS were only available from a limited fraction of the observations because the operation of the OCTAVE-DAS was unstable in its commissioning phase. In this paper, we show the preliminary results of the May 9 and 27 data to be available for analysis. We also show the results obtained from the May 8 DIR2000 output, yielding a composite map of the v = 2 and v = 3 masers for comparison with that yielded from the May 9 OCTAVE-DAS output.5 Table 2 gives the parameters of the data calibration and image cubes reported in this paper.
Parameters of the present image syntheses using the outputs of the OCTAVE-DAS and the DIR2000 recorder.
| Code | Antennas | SiO line* | Recorder | vLSR† | Beam‡ | 1σ noise§ | Remarks‖ | |
|---|---|---|---|---|---|---|---|---|
| v = 1 | v = 2 | |||||||
| r13128a | MROS | v = 2, 3 | DIR20000 | – | 34.7 | 1.12 × 0.42, −21° | 0.15 | a |
| r13129a | MROSN | v = 0, 1, 2 | OCTADISK | 39.3 | 39.4 | 1.53 × 1.03, −7° | 0.10 | b |
| r13147a | MROS | v = 1, 2, 3 | OCTADISK | 43.9 | 39.3 | 1.15 × 0.48, −23° | 0.53 | c |
*SiO J = 1 → 0 maser lines whose image cubes were successfully synthesized.
†LSR velocity, in units of km s−1, of the 28SiO v = 2 J = 1 → 0 maser spot adopted as phase-reference.
‡Major- and minor-axis lengths of the synthesized beam in units of mas, and position angle in the 28SiO v = 2 map.
§Minimum root-mean-square noise level, in units of Jy beam−1, of emission-free regions in the v = 2 maser image cube. An emission-free spectral channel map was chosen for the calculation.
‖Remarks. a: Phase calibration solutions were transferred from the v = 2 data; b: The v = 1 maser image cube was synthesized independently of the v = 0 and 2 cubes; c: The v = 1 maser image cube was synthesized independently of the v = 0 and 1 cubes.
We also tried to detect the v = 0 J = 1 → 0 transition of 30SiO maser emission, but this resulted in negative detection even in the total power spectra of the VERA telescopes. We do not report the results of 30SiO maser observations in detail in this paper.
4 Results
4.1 Maser spectra
Figure 3 shows the total power spectra of the W Hya SiO masers taken on 2013 May 9 and 27. Even though the uncertainty of gains and system temperatures of the telescopes (∼10%) has to be taken into account, one can still see rapid growth of the 28SiO v = 1 and 2 and the 29SiO v = 0 maser flux densities by a factor of 3–4 for 19 days. According to the optical light curve found in the data available from the American Association of Variable Star Observers (AAVSO),6 our maser observations were made a few weeks before the light maximum and when the SiO masers are expected to be growing (e.g., Pardo et al. 2004).
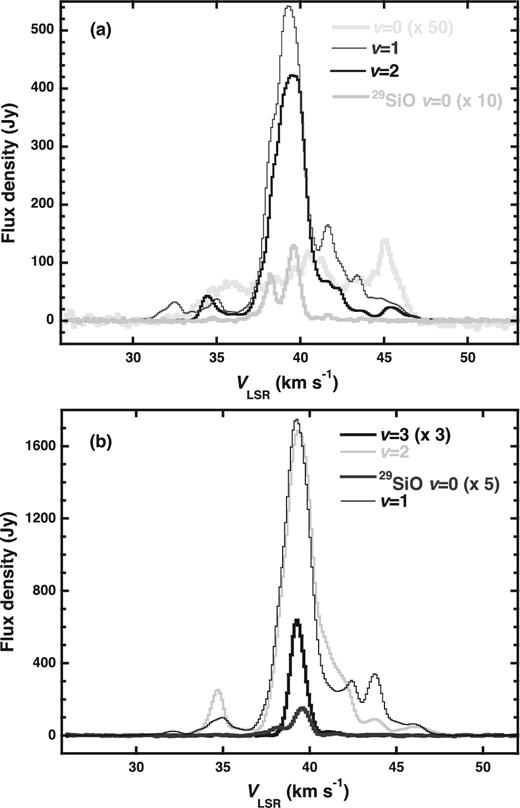
Total power spectra of the SiO maser lines in W Hya found in the VERA observations, with polynomial emission-free spectral baselines subtracted. (a) v = 1 (gray thick line) and v = 2 (black thin line) 28SiO J = 1 → 0 and v = 0 29SiO J = 1 → 0 maser lines, which were observed using the NRO 45 m telescope on 2013 May 9. The detected thermal line of the SiO v = 0 J = 1 → 0 transition (light-gray thick line) is also displayed. (b) v = 1 (black thin line), v = 2 (light-gray thin line), v = 3 (dark-gray thick line) 28SiO J = 1 → 0, and v = 0 (gray thick line) 29SiO J = 1 → 0 maser lines observed on 2013 May 27. The spectra were obtained by combining those of four telescopes of VERA (Mizsawa, Iriki, Ogasawra, Ishigaki).
The 28SiO v = 3 maser, as well as the brighter v = 1 and v = 2 masers, was detected on May 8, 26, and 27, and June 7 and 8. Its total-power spectral profile is confirmed to be growing. However, on June 8, the phase-referencing of the v = 3 maser data to those of the brighter v = 2 maser failed due to poor data quality affected by high system temperatures. As a result, the information on the position of the v = 3 maser spot with respect to other maser lines was lost. Therefore, the map of the v = 3 maser spot, which is just located at the map origin through the self-calibration procedures, is not shown in this paper. The 29SiO v = 0 map was obtained only from the epoch of May 9 when the emission was successfully recorded with the NRO 45 m telescope and OCTAVE-DAS.
In the NRO and Ogasawara spectrum of May 9, the thermal line of the SiO v = 0 emission is also detected thanks to the NRO 45 m large aperture and to good weather conditions. It exhibits multiple narrow velocity components, indicating a maser action. However, it was too weak to be detected in the VLBI angular resolution even though the emission was really maser emission.
4.2 VERA astrometry and application to the maser map registration
The maser source astrometry using the VERA dual beam system and the DIR2000 recorder was successful on May 8 and 9 and on June 7 and 8. We adopted the following source coordinates for delay-tracking in the data correlation: RA (J2000.0) = 13h49m01|${^{s}_{.}}$|9455, Dec (J2000.0) = − 28°22΄04|${^{\prime\prime}_{.}}$|386 for W Hya and RA (J2000.0) = 13h51m46|${^{s}_{.}}$|838765, Dec (J2000.0) = − 29°12΄17|${^{\prime\prime}_{.}}$|65002 for J135146.8−291218. Table 3 gives the summary of the VERA astrometry using only the May 8 and 9 data. The v = 2 maser spots, whose offsets from the delay-tracking center are given in table 3, become the position reference of the v = 3 maser spots mapped with the DIR2000 data (subsection 3.2).
Results of the VERA astrometry for the source pair of W Hya and J135146.8−291218.
| Code | vref | Offsets (mas)† | Synthesized | Peak intensity | |
|---|---|---|---|---|---|
| (km s−1)* | RA | Dec | beam pattern‡ | (mJy beam−1)§ | |
| r13128a | 34.7 | 16.024 ± 0.025 | 79.502 ± 0.061 | 1.31 × 0.35, −17° | 111 ± 13 |
| r13129a | 35.3 | 15.210 ± 0.021 | 79.724 ± 0.046 | 1.11 × 0.50, −7° | 88.8 ± 8.6 |
*LSR velocity of the 28SiO v = 2 J = 1 → 0 maser spot adopted as phase-reference.
†Offsets of the phase-reference maser spot from the delay-tracking center.
‡Major- and minor-axis lengths and the position angle of the reference source obtained in the Gaussian fitting.
§Its uncertainty corresponds to 1σ noise level in the reference source image.
We needed to correct a systematic shift of the v = 3 map to register it onto the v = 2 map as described by Imai et al. (2010, 2012). The shift of (0.11, 0.56)[mas] for the v = 3 map was derived from the offset of the v = 2 maser spot as reference postion given in table 3 and from the relative difference of the sky frequencies between the v = 2 and v = 3 spots with respect to the v = 2 sky frequency. In the May 9 data, the different velocity channels were chosen as the phase reference between the data reduction procedures for the DIR2000 and OCTAVE-DAS outputs (35.3 km s−1 and 39.4 km s−1, respectively). They were adopted because a velocity channel with a higher correlated flux density would yield better calibration solutions and such a channel was found in different velocity channels in the two data outputs. However, a possible map shift, expected from the difference in the maser position (∼20 mas), is less than 0.2 mas; therefore, we could adopt a map shift roughly equal to that obtained above. For the May 27 data, we can assume that the same v = 2 maser spot can be used as phase-reference as was the case for the calibration of the May 9 and 27 OCTAVE-DAS data, because almost the same velocity was chosen as a reference velocity channel in the calibration procedures (table 2). The intrinsic proper motion of the reference maser spot is expected to be ∼2 mas in two weeks, from the Hipparcos measurement (van Leeuwen 2007), but its effect on the v = 3 map shift is negligible (∼0.02 mas).
4.3 Composite maser maps
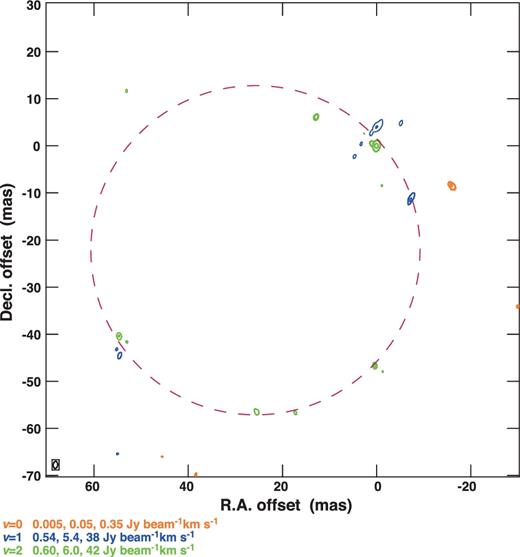
Figure 4 shows the composite contour map of the 28SiO v = 2 and 3 masers observed on May 8 with DIR2000. The correlated flux densities are much lower than the total power flux densities, indicating that the maser spots are extended and spatially resolved out in the synthesized VLBI beam. One can roughly recognize a ring-shaped distribution (with a diameter of ∼70 mas) of the v = 2 maser. Because of the relatively poor (u, v) plane coverage of the visibility data obtained from the DIR2000 output available only in VERA, the obtained map is contaminated by bright side lobes. There are many bright side lobes, as seen in the contours in figure 4. It is difficult to know which emission exhibits, an artifact or a true maser emission. One can consider that a large fraction of them are distributed northward and southward from bright v = 2 maser spots with two or three levels of contours, suggesting that they are artifacts. On the other hand, one of the two brightest v = 3 maser spot, at (−11 mas, 20 mas), is located outside of or far away from any of these v = 2 spots. Even conservatively speaking, it is difficult to recognize a spatial correlation between the bright v = 2 and v = 3 spots, quite different from the clear correlation found in W Hya (Imai et al. 2010). Nevertheless, through phase-referencing with a bright v = 2 maser feature to the v = 3 maser data, we clearly find the brightest v = 3 maser feature that is located at the outer side of any of the bright v = 2 maser features. This is a surprising result because the v = 3 maser features were located inside the rings of the v = 1 and 2 maser feature distributions in the previous results (Imai et al. 2010, 2012).
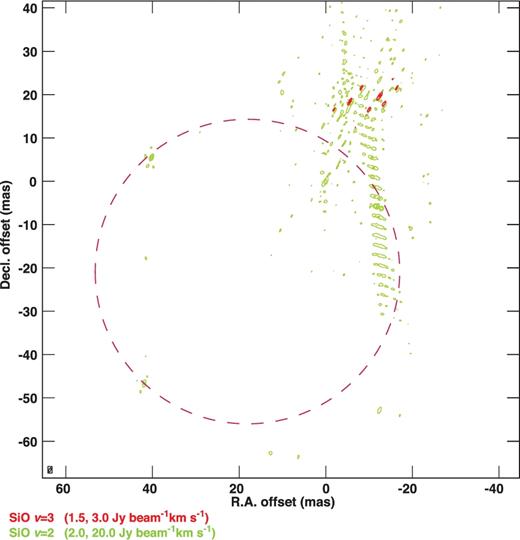
Velocity-integrated brightness contour maps of v = 2 (yellow-green contours) and v = 3 (red) 28SiO J = 1 → 0 maser lines observed on 2013 May 8. A magenta dashed circle indicates a 70 mas ring approximating the distribution of the 28SiO v = 2 maser emission. (Color online)
Figure 5 shows the composite contour map of the 28SiO v = 1 and 2 and 29SiO v = 0 masers observed on May 9 with VERA and the NRO 45 m telescope with OCTAVE-DAS. Because the v = 1 and 2 maser data were independently calibrated, the information of the maser relative positions was missing. Just for comparison, in figure 5, one of the v = 1 maser features was set at 5 mas north of the brightest v = 2 maser feature, whereas the locations of 29SiO v = 0 masers were measured with respect to those of the v = 2 masers in the phase-referencing.
Same as figure 4 but for the v = 1 (blue contours), v = 2 (yellow-green) 28SiO J = 1 → 0 and v = 0 29SiO v = 0 (orange) J = 1 → 0 maser lines observed on 2013 May 9. A magenta dashed circle indicates a 70 mas ring approximating the distribution of the 28SiO v = 2 maser emission. (Color online)
The distribution of the v = 2 masers partly changed from May 8 (figure 4) to May 9 (figure 5). Although some instrumental factors are supposed to be the cause of this variation, the intrinsic variation is recognized in the total-power spectra (figure 3), which may not be so affected by those factors. Such a rapid variation in the maser distributions has been confirmed to be more or less intrinsic to the maser source (Imai et al. 2010). Nevertheless, there is a resemblance in the relative positions between the four south, one northeast and two strong northwest maser features for the two days, confirming that even the different telescope configurations of VLBI observations can trace the same bright v = 2 features. Roughly speaking, the v = 1 and 2 masers are located in one ring with a diameter of 70 mas (a magenta dashed circle in figure 5), consistent with the typical relative distributions of these masers (e.g., Soria-Ruiz et al. 2004; Yi et al. 2005). On the other hand, the 29SiO v = 0 maser feature is located outside the v = 1 and 2 maser ring, which is consistent with that found in WX Psc (Soria-Ruiz et al. 2005). This result is the third example of a VLBI map of the 29SiO v = 0 maser after those of WX Psc and R Leo (Soria-Ruiz et al. 2007).
Figure 6 shows the composite contour map of the 28SiO v = 1, 2, and 3 masers observed on May 27 with only VERA using the OCTAVE-DAS. Although the map of the v = 1 masers obtained through the self-calibration is displayed, the relative positions of the v = 1 masers with respect to the v = 2 masers are found by using the map of the v = 1 masers obtained through phase-referencing to the v = 2 maser data. The v = 2 masers have a large deviation from a thin-ring morphology. The v = 1 masers are located near the ring, while the v = 3 maser is located outside of the ring, consistent with the case on May 8 (figure 4). However, it is unlikely that the v = 3 maser found on May 27 is the same as that found on May 8.
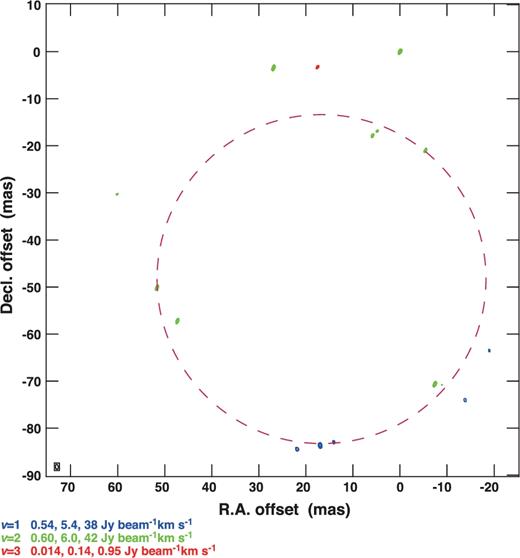
Same as figure 4 but for the v = 1 (blue contours), v = 2 (yellow-green), and v = 3 (red) 28SiO J = 1 → 0 maser lines observed on 2013 May 27. A magenta dashed circle indicates a 70 mas ring approximating the distribution of the 28SiO v = 2 maser emission. (Color online)
5 Discussion and future perspectives
The present VLBI observations aimed to demonstrate the scientific feasibility of the OCTAVE system that can record received signals of all SiO maser lines at 7 mm when signals from all the four 512 MHz base-band channels are recorded. Although the long baselines of our VLBI observations spatially resolved the maser emission, the relative positions of the different SiO maser lines could still be determined. After the software for precise delay-tracking of the software correlator (OCTACOR2) output is available, the composite map of the SiO maser lines will be more reliably synthesized on the basis of a common phase-referencing procedure (subsection 3.2). In this paper, we confirmed at least two findings, as follows.
First, 29SiO maser emission is likely always located outside the v = 1 and 2 28SiO masers. At least, we confirmed that the 29SiO maser feature was located outside of any of the bright v = 1 and 2 masers in the whole observing sessions even although the latter masers were highly variable. This is supported by the consistency of our result with the previous one found in other maser sources (Soria-Ruiz et al. 2005). Secondly, the v = 3 maser distribution has large offsets from rings of the v = 1 and 2 masers sometimes, and chaotically. Imai et al. (2010) found that the v = 3 maser is spatially well-consistent with the v = 1 and 2 masers during a specific phase of stellar pulsation, likely after the light maximum, but that it has large angular offsets from the v = 1 and 2 masers in other phases. The present result likely corresponds to the latter case. However, it is an open question why the v = 3 maser emission can be located outside the v = 1 and 2 masers although the energy level of v = 3 is much higher than those of v = 1 and 2.
Desmurs et al. (2014) propose a model of the v = 1, 2, and 3 masers. They consider that the line-overlapping scheme enhances the rovibrational transition from v = 1 J = 0 to the v = 2 J = 1 level in mid-infrared transition of H2O molecules. Although they do not mention the excitation mechanism of the v = 3 maser in detail, their model explains the spatial overlap of the v = 1, 2, and 3 masers well. They also predict that these masers have larger angular offsets from each other without assuming the line-overlapping mechanism. When we revisit the results of Imai et al. (2010), we note that the distance to the v = 3 maser features from the possible position of the central star remained constant, while those of v = 2 maser features decreased so as to overlap with the v = 3 masers. If the v = 2 masers shifted further inward because of the brighter mid-infrared radiation yielding higher excitation of the masers, as suggested by Desmurs et al. (2014), they would be located inside the v = 3 maser ring, as shown in this paper (figure 6). This implies the importance of monitoring VLBI campaigns of stellar SiO masers that aim to trace the variation of the dominant mechanism of the maser excitation through a stellar pulsation cycle. Further discussion will appear in a separate paper with more comprehensive data analyses (Oyadomari et al. in preparation).
The current OCTAVE-DAS installed in VERA can deal with a total data recording rate of 12 Gbps (up to 32 Gbps now in a commissioning phase). It can cover a total bandwidth of 3 GHz. One of its benefits is that we can simultaneously observe a combination of maser and thermal lines. Such a VLBI observation enables us to simultaneously make diagnostics of the physical condition in the maser source through long integration of the thermal lines during the observation. Such integration is possible without antenna nodding by using a digital back-end and employing optimized source scans, as proposed by Yamaki et al. (2012). Possible, scientifically feasible combinations of maser and thermal lines in the VLBI bands are as follows: the H2O maser line at 22.2 GHz and the NH3 lines around 23.7 GHz; the Class I maser line of CH3OH (70–61A+) at 44.07 GHz (recently mapped in VLBI by Matsumoto et al. 2014); the thermal line of SiO v = 0 J = 1 → 0 at 43.42 GHz. If the total bandwidth is split into two band channels in VERA, one can still observe most of the SiO maser lines in one antenna beam with a bandwidth of 1024 MHz and a continuum reference source in the other beam with a bandwidth of 2048 MHz. The precision of the maser map registration will be guaranteed by the high-precision astrometry conducted simultaneously with the multi-line maser source mapping.
Acknowledgments
We acknowledge Y. Tamura, T. Umemoto, and all staff members and students who have helped in array operation including the OCTAVE system and in data correlation of VERA. The VERA/Mizusawa VLBI observatory and NRO are branches of the National Astronomical Observatory of Japan, and the inter-university research institute operated by the Ministry of Education, Culture, Sports, Science and Technology. T.H. was supported by the MEXT/JSPS KAKENHI Grant Numbers 24684011, and H.I. was supported by by the Korea Astronomy and Space Science Institute (KASI) supervised by the Ministry of Science, ICT and Future Planning.
Appendix. Revised station coordinates of the NRO 45 m telescope and instrumental calibration for the NRO data
The revised coordinates obtained from the data of X3 and M6 coincide within ≈5 mm. The uncertainties of the determined positions of X3 and M6 were 1–2 cm and ∼5 cm, respectively. Note that the T's coordinates in this comparison are not independent of each other; that is, relative position between T and X3 was determined from that between X4 and X3, determined by the previous and present GPS measurement results, and subtracted by that between X4 and T. The X4's coodinates as well as the X3's ones were well determined with respect to those of M6 in an uncertainty of ∼5 mm. Although the GPS measurement yielded consistency of the reference positions within 5 mm, there still exists a large uncertainty in relative positions of the antenna position to be up to 10 cm with respect to the GPS position, especially in the height of antenna position on the ground. The uncertainty of T's coordinates in the ITRF thus may be smaller than 10 cm, dependent on the uncertainty of the relative height of T with respect to X3 and X4, which will be measured in the near future.
They are available in the wiki page 〈http://mwg.sci.kagoshima-u.ac.jp/wiki/pages/v3m7U6P5/Data_Analysis__Image_Processing.html〉. See also the ParselTongue wiki page 〈http://www.jive.nl/jivewiki/doku.php?id=parseltongue:parseltongue〉.
Unfortunately the v = 1 maser map from the May 9 DIR2000 output was unavailable due to a mistake in the frequency band allocation.
