


Abstract
Risk stratification tools for patients with advanced melanoma (AM) treated with immune checkpoint inhibitors (ICI) are lacking. We identified a new prognostic model associated with overall survival (OS).
A total of 318 treatment naïve patients with AM receiving ICI were collected from a multi-centre retrospective cohort study. LASSO Cox regression identified independent prognostic factors associated with OS. Model validation was carried out on 500 iterations of bootstrapped samples. Harrel’s C-index was calculated and internally validated to outline the model’s discriminatory performance. External validation was carried out in 142 advanced melanoma patients receiving ICI in later lines.
High white blood cell count (WBC), high lactate dehydrogenase (LDH), low albumin, Eastern Cooperative Oncology Group (ECOG) performance status ≥1, and the presence of liver metastases were included in the model. Patients were parsed into 3 risk groups: favorable (0-1 factors) OS of 52.9 months, intermediate (2-3 factors) OS 13.0 months, and poor (≥4 factors) OS 2.7 months. The C-index of the model from the discovery cohort was 0.69. External validation in later-lines (N = 142) of therapy demonstrated a c-index of 0.65.
Liver metastases, low albumin, high LDH, high WBC, and ECOG≥1 can be combined into a prognostic model for AM patients treated with ICI.
Five baseline characteristics can be combined into a prognostic model for advanced melanoma patients treated with ICI: white blood cell count (WBC) > upper limit of normal, lactate dehydrogenase (LDH) > upper limit of normal, albumin < lower limit of normal, Eastern Cooperative Oncology Group (ECOG) performance status ≥1, and the presence of liver metastases. This prognostic model is simple to use and parses patients effectively into distinct risk groups that carry both high internal and external validity. This model provides overall survival (OS) benchmarks that can be used for patient counseling and future trial design.
Introduction
Immune checkpoint inhibitors (ICI) have heralded a paradigm shift in outcomes for patients with advanced melanoma.1,2 Several agents including pembrolizumab and nivolumab, anti-programmed cell death protein 1 monotherapies (anti-PD1i), and the combination of nivolumab with cytotoxic T-cell lymphocyte-antigen 4 targeted ipilimumab are established standards of care.3 Trial data identified a subgroup of patients that experience long-term durable responses to ICI4,5; however, survival in the real-world setting varies markedly, with only 40% of patients treated with anti-PD1i alive at 3 years.6 Reliable prognostic markers and validated models to facilitate risk stratification are lacking.5
Since the adoption of ICI for advanced melanoma multiple baseline variables were examined as potential prognostic factors associated with response and survival. Tumor characteristics (programmed death-ligand 1 expression, serum lactate dehydrogenase (LDH) levels, tumor mutational burden, tumor-infiltrating lymphocytes, and interferon gamma gene expression) and clinical parameters (anemia, sites of metastatic disease, neutrophil to lymphocyte (NLR), and hypoalbuminemia) were previously implicated as candidate factors.7-11 Attempts to discriminate patient populations utilizing prognostic models are infrequent12-15 with a notable absence of studies examining treatment naïve patients treated with ICI in the real-world setting.
Given this evidence gap, we used a real-world observational cohort study to create a validated prognostic model for overall survival (OS), with a focus on clinically accessible parameters available at the start of ICI therapy.
Methods
Study Design
We used a 3-pronged discovery, internal validation, and external validation strategy to identify and validate a prognostic model for advanced melanoma patients treated with ICI. Model discovery was performed in cohort of advanced melanoma patients receiving first-line ICI therapy. Following identification of a prognostic risk model, internal validation was performed in the discovery cohort using 500× bootstrapping to assess the optimism-corrected prognostic utility of our model. Finally, external validation was carried out on an independent cohort of advanced melanoma patients receiving later-line ICI therapy.
Patient Selection
The Alberta Immunotherapy Database (AID) is a multi-center, province-wide observational cohort study. AID retrospectively captures baseline demographic, histological, clinical, laboratory, and imaging data utilizing a standardized template.16 Baseline variables of interest at commencement of ICI therapy were chosen. Inclusion criteria for our discovery cohort required patients with histologically confirmed locally advanced or metastatic melanoma, with receipt of at least 1 cycle of ICI (single agent nivolumab, pembrolizumab, or combination ipilimumab and nivolumab). Inclusion criteria for our validation cohort also required patients with histologically confirmed locally advanced or metastatic melanoma, who received at least 1 cycle of later line ICI therapy. Patients received treatment between August 2013 and May 2020, with statistical analysis in February 2022. Centralized institutional review board ethics approval was obtained prior to undertaking data collection.
Outcomes of Interest
The primary time to event endpoint of this study was OS, defined as the time from commencement of ICI to death from any cause or censored at last follow up. The cut off data collection date of the discovery cohort was December 31, 2021. We sought to identify clinically accessible, baseline variables independently associated with adverse OS and combine them into a prognostic model with a high discriminatory ability to parse patients into meaningfully different prognostic groups.
Statistical Analyses
Baseline demographic, clinical, laboratory, and treatment characteristics were described with frequencies and proportions for categorical variables and median (IQR) for continuous variables. We dichotomized all baseline characteristics considered in the analyses, based on either the lower or upper limit of normal range (Laboratory markers), or a pre-defined cutoff point (Eastern Cooperative Oncology Group Performance Status [ECOG PS], presence of organ metastasis). Multiple imputation by chained equations was used to address missing values. Five cycles of chained equation process with logistic regression were used to impute the missing values. OS curves were estimated using the Kaplan-Meier method, with survival analysis being conducted via multivariable and univariate Cox proportional hazards (CoxPH) regression. Discriminatory performance was estimated using the Harrell’s c-index in all cohorts.
We selected clinical, laboratory, and demographic features significantly associated with OS in univariate CoxPH for inclusion as candidates for our model. Subsequently, we used a least absolute shrinkage and selection operator (LASSO) Cox regression, which performed variable selection and penalization simultaneously to identify the subset of features that minimized model error. Our LASSO Cox regression was fit on the discovery dataset with 10-fold cross-validation to identify the shrinkage parameter λ that yielded the model with the lowest error for the Harrell’s c-index loss parameter. Following identification of this subset of features, a stepwise CoxPH approach was used to incrementally add these factors together in a multivariable CoxPH model to identify a subset that had a strong discriminatory performance as assessed via c-index, and in which all variables remained significantly important contributors to the model overall. This method identified 5 variables of importance which formed our prognostic model. Once this final model was identified, its performance in the discovery cohort was assessed using CoxPH and c-index analysis.
Based on the features selected, we developed a continuous risk score for our model by scoring the presence/absence of the characteristics identified. Absence of any of the final selected 5 features received a score of 0, whereas presence of all conditions received a score of 5. Presence of each selected baseline variable generated a maximum score of 1. This risk score was then divided into poor, intermediate, and favorable risk groups using different cut-points, the utility of which was evaluated in the discovery cohort c-index and CoxPH modeling. The cut point which demonstrated optimal utility was retained for internal and external validation. Conventionally used thresholds for laboratory and clinical parameters were used. Additional subgroup analyses were conducted in patients receiving single-agent anti-PD1i therapy and combination ICI therapy.
Internal model validation was carried out on 500 iterations of bootstrapped samples. In each bootstrap sample, the same variable selection process through LASSO Cox regression was performed to develop a prediction model. The performance of this model on the bootstrap sample (bootstrap performance) and in the original sample (test performance) were assessed with c-indices. Optimism, the difference between training error and test error, was estimated as the mean difference between the bootstrapped performance and the test performance after 500 iterations. The optimism-corrected c-index was reported as the apparent c-index of the original sample subtracted with the mean optimism. The SE of the optimism-corrected c-index was calculated as:
[SE (optimism-corrected c-index)]2 = [SE (apparent c-index)]2 + [SE (optimism)]2 – 2 × Corr (c-index, optimism) × SE (apparent c-index) × SE (optimism). The optimism-corrected c-index indicates the expected performance when the model is applied to an external dataset with similar inclusion criteria.
External model validation was carried out on an independent cohort of advanced melanoma patients receiving later-line ICI therapy within AID. Prognostic scores were calculated in this cohort using the same features identified in the discovery cohort, with identical stratification into poor, intermediate, and favorable risk groups. The performance of this signature was assessed using c-index and CoxPH analysis, and the independent prognostic utility of the signature was assessed using multivariable CoxPH with the treatment line as a co-variate.
This study followed the transparent reporting of a multivariable prediction model for individual prognosis or diagnosis guidelines on reporting predictive models.17 All statistical analyses were carried out in R v 4.0.2 (R foundation for statistical computing, Vienna, Austria).
Results
Cohort Characteristics
Our discovery cohort examined 318 treatment naïve patients treated with single-agent anti-PD1i (66.5% 211/318) with pembrolizumab or nivolumab or combination of ipilimumab and nivolumab (33.5% 107/318). Seventy-two percent (229/318) of patients had a cutaneous primary site, and 22.0% (70/318) were BRAF mutation-positive, the majority of which were V600E (55/70). A large percentage of these patients had liver metastases, 26.7% (85/318) or central nervous system involvement, 13.5% (43/318) at the commencement of ICI. Our validation cohort included 142 advanced melanoma patients receiving later-line therapy, most in second-line, 52.8% (75/142), or third-line, 39.4% (56/142). Most of these patients also had a cutaneous primary site, 74% (106/142). These patients were more likely to be BRAF mutation positive 55.6%, (79/142) and have liver, 30.3% (43/142) or central nervous system, 32.4% (46/142) metastases at the time of ICI treatment initiation. The median follow-up time of the discovery and validation cohorts was 34.7 months (95% CI, 22.9-48.9) and 11.7 months (95% CI, 7.8-15.1), respectively. These cohorts are characteristic of contemporary real-world experience in the treatment of advanced melanoma. Baseline patient, laboratory, and tumor characteristics for discovery and validation cohorts are outlined in Table 1.
Melanoma ICI validation cohort demographics and clinical characteristic table. P values for continuous variables are via non-parametric t-test, and categorical variables are via chi-squared test.
| First line (N = 318) | Later line (N = 142) | P-value | |
|---|---|---|---|
| Median age (IQR) | .004 | ||
| Median (IQR) | 63.0 (20.0) | 59.5 (20.5) | |
| Gender (%) | .164 | ||
| Female | 102 (32.1%) | 55 (38.7%) | |
| Male | 216 (67.9%) | 87 (61.3%) | |
| Median BMI (IQR) | .569 | ||
| Median (IQR) | 27.8 (7.37) | 26.8 (7.49) | |
| Missing | 43 (13.5%) | 14 (9.9%) | |
| Primary site (%) | .355 | ||
| Cutaneous | 229 (72.0%) | 106 (74.6%) | |
| Cutaneous desmoplastic | 8 (2.5%) | 0 (0%) | |
| Mucosal | 13 (4.1%) | 7 (4.9%) | |
| Mucosal + anal | 1 (0.3%) | 0 (0%) | |
| Anal | 6 (1.9%) | 2 (1.4%) | |
| Vulva | 4 (1.3%) | 4 (2.8%) | |
| Ungual | 3 (0.9%) | 0 (0%) | |
| Muscle primary | 0 (0%) | 1 (0.7%) | |
| Unknown primary | 53 (16.7%) | 22 (15.5%) | |
| Pontine angle | 1 (0.3%) | 0 (0%) | |
| ECOG (%) | .002 | ||
| 0 | 144 (45.3%) | 40 (28.2%) | |
| 1 | 131 (41.2%) | 82 (57.7%) | |
| 2 | 37 (11.6%) | 18 (12.7%) | |
| 3 | 5 (1.6%) | 2 (1.4%) | |
| Missing | 1 (0.3%) | 0 (0%) | |
| Stage (%) | <.001 | ||
| III | 28 (8.8%) | 2 (1.4%) | |
| IIIA | 1 (0.3%) | 0 (0%) | |
| IIIB | 8 (2.5%) | 0 (0%) | |
| IIIC | 15 (4.7%) | 0 (0%) | |
| IV | 266 (83.6%) | 140 (98.6%) | |
| Liver metastases (%) | .432 | ||
| Absent | 233 (73.3%) | 99 (69.7%) | |
| Present | 85 (26.7%) | 43 (30.3%) | |
| Brain metastases (%) | <.001 | ||
| Absent | 275 (86.5%) | 96 (67.6%) | |
| Present | 43 (13.5%) | 46 (32.4%) | |
| BRAF mutation, ve (%) | <.001 | ||
| Absent | 200 (62.9%) | 51 (35.9%) | |
| Present | 70 (22.0%) | 79 (55.6%) | |
| Missing | 48 (15.1%) | 12 (8.5%) | |
| LDH (%) | .012 | ||
| Normal | 177 (55.7%) | 64 (45.1%) | |
| >ULN | 81 (25.5%) | 52 (36.6%) | |
| Missing | 60 (18.9%) | 26 (18.3%) | |
| Albumin (%) | .027 | ||
| Normal | 208 (65.4%) | 80 (56.3%) | |
| >ULN | 52 (16.4%) | 35 (24.6%) | |
| Missing | 58 (18.2%) | 27 (19.0%) | |
| Hemoglobin (%) | .113 | ||
| Normal | 205 (64.5%) | 83 (58.5%) | |
| <LLN | 97 (30.5%) | 55 (38.7%) | |
| Missing | 16 (5.0%) | 4 (2.8%) | |
| Platelets (%) | .123 | ||
| Normal | 279 (87.7%) | 123 (86.6%) | |
| >ULN | 23 (7.2%) | 17 (12.0%) | |
| Missing | 16 (5.0%) | 2 (1.4%) | |
| Leukocytes (%) | .459 | ||
| Normal | 268 (84.3%) | 129 (90.8%) | |
| >ULN | 30 (9.4%) | 11 (7.7%) | |
| Missing | 20 (6.3%) | 2 (1.4%) | |
| Neutrophil leukocyte ratio (%) | .426 | ||
| ≤4 | 270 (84.9%) | 122 (85.9%) | |
| >4 | 31 (9.7%) | 18 (12.7%) | |
| Missing | 17 (5.3%) | 2 (1.4%) | |
| Corrected calcium (%) | 1.00 | ||
| Normal | 271 (85.2%) | 116 (81.7%) | |
| >ULN | 4 (1.3%) | 1 (0.7%) | |
| Missing | 43 (13.5%) | 25 (17.6%) | |
| Creatinine (%) | .519 | ||
| <120 umol/L | 265 (83.3%) | 129 (90.8%) | |
| >120 umol/L | 24 (7.5%) | 9 (6.3%) | |
| Missing | 29 (9.1%) | 4 (2.8%) | |
| Treatment line (%) | <.001 | ||
| 1 | 318 (100%) | 0 (0%) | |
| 2 | 0 (0%) | 75 (52.8%) | |
| 3 | 0 (0%) | 56 (39.4%) | |
| 4 | 0 (0%) | 10 (7.0%) | |
| 5 | 0 (0%) | 1 (0.7%) | |
| Median no. cycles ICI (IQR) | .171 | ||
| Median (IQR) | 6.00 (11.0) | 5.00 (12.0) | |
| Missing | 10 (3.1%) | 1 (0.7%) | |
| Median OS time (IQR) | <.001 | ||
| Median (IQR) | 618 (833) | 352 (673) | |
| Number of events (%) | <.001 | ||
| Censor | 156 (49.1%) | 26 (18.3%) | |
| Event | 162 (50.9%) | 116 (81.7%) |
As in the pivotal trials, the median OS (mOS) for patients treated with combination ICI compared to single agent anti-PD1i was improved, P = .00255, (Fig. 1). Patients treated with nivolumab and pembrolizumab had overlapping OS curves, P = .747, (Fig. 2). The overall population of the discovery cohort had a mOS of 20.6 months (IQR 27.8) and the validation cohort had a mOS of 11.7 months (IQR 22.4).
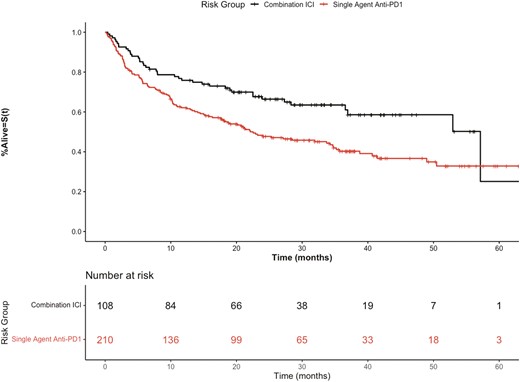
Kaplan-Meier overall survival curves of discovery cohort stratified by combination ICI therapy (ipilimumab + nivolumab) versus single-agent anti-PD1 therapy.
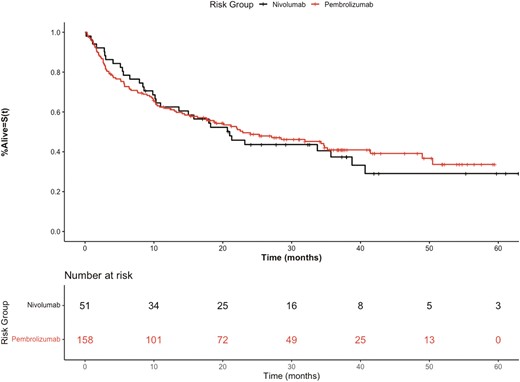
Kaplan-Meier overall survival curves of discovery cohort stratified by anti-PD1 therapy nivolumab versus pembrolizumab.
Identifying Prognostic Variables
Our discovery cohort experienced 162 death events over the follow-up period. The entire discovery cohort was used when identifying baseline prognostic variables of interest associated with OS. Eighteen candidate features were examined (Supplementary Table S1). Univariate CoxPH identified 13 candidate features significantly associated with survival, which was retained for further analysis (Supplementary Table S2). LASSO Cox regression identified a subset of 12 features for inclusion in the model. These were added in a stepwise fashion to produce a model with the good discriminatory performance and in which all included factors remained significantly associated with overall survival in multivariable CoxPH analysis. The final model included 2 clinical (ECOG performance status and presence of liver metastases) and 3 laboratory (low albumin, elevated LDH, and elevated WBC count) variables. Other potential models including other variables selected by LASSO with associated C-index values are outlined in Supplementary Table S3. Lymphocytosis, age, thrombocytosis, presence of CNS metastasis, elevated creatinine, dNLR, and neutrophilia did not remain significant in multivariable CoxPH or improve the performance of this model and were excluded.
In the resulting Cox proportional hazards model, each selected adverse prognostic factor was independently associated with OS on multivariable analysis: LDH > upper limit of normal (ULN) HR 1.72 (95% CI, 1.24-2.39, P = .001), ECOG PS ≥ 1 HR 1.80 (95% CI, 1.27-2.57 P = .001), WBC ≥ ULN HR 1.57 (95% CI, 1.02-2.40, P .038), albumin < lower limit of normal (LLN) HR 1.72 (95% CI, 1.18-2.51, P < .005) and the presence of liver metastases HR 1.67 (95% CI, 1.20-2.33, P = .002) Supplementary Table S4.
Risk Stratification and Model Performance
Supplementary Fig. 1 outlines the negative prognostic relationship between the presence of increasing numbers of these candidate predictor variables and worse OS (log-rank P < .0001). After comparing several prognostic risk grouping models based on different permutations of the above 5 factors (Supplementary Table 5) patients were parsed utilizing unweighted scoring into prognostic risk groups, to give the optimum combination of a high discriminatory capacity, C-index of 0.69 (95% CI, 0.67-0.77). Three risk groups were identified: favorable (0-1 prognostic factors, 56.6% of the cohort) mOS of 52.9 months (95% CI, 41.4 months-not evaluable) and 1 year OS of 83.7%, intermediate (2-3 prognostic factors, 34.9% of the cohort) mOS 13.0 months (95% CI, 7.97-19.3 months) and 1 year OS of 50.3% and poor (≥4 prognostic factors, 8.5% of the cohort) mOS 2.7 months (95% CI, 1.4-6.5 months) and 1 year OS of 22.2%. Hazard ratios between groups were: intermediate vs. favorable HR 2.81 (95% CI, 2.01-3.93 P < .001); poor vs. favorable: HR 7.84 (95% CI, 4.77-12.87, P < .001), Table 2. The OS of the 3 risk categories is shown in Fig. 3.
Survival outcomes for patient risk groups as stratified by the risk model in the advanced melanoma discovery cohort.
| Risk group | Number of adverse prognostic factors | Number of patients (%) | Number of events | HR (95% CI) | CoxPH P-value | Median OS in months (95% CI) | 1-year OS % (95% CI) |
|---|---|---|---|---|---|---|---|
| Favorable | 0-1 | 180 (56.6) | 66 | Ref | 52.9 (41.4, NE) | 83.7 (78.4-89.3) | |
| Intermediate | 2-3 | 111 (34.9) | 74 | 2.81 (2.01, 3.929) | <.001 | 13.0 (7.97, 19.3) | 50.3 (41.8-60.6) |
| Poor | ≥4 | 27 (8.5) | 22 | 7.84 (4.77, 12.87) | <.001 | 2.7 (1.4, 6.5) | 22.2 (10.9-45.0) |
Abbreviations: OS, overall survival; HR, hazard ratio.
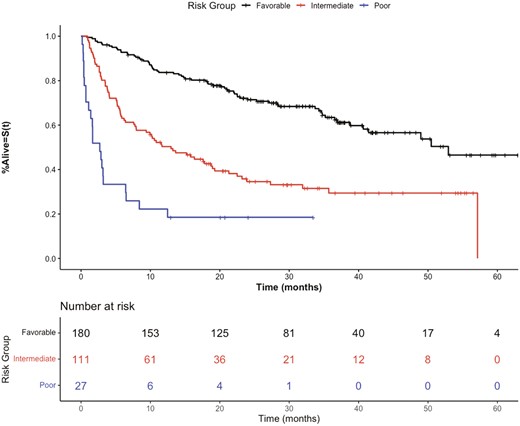
Kaplan-Meier overall survival curves of the discovery cohort stratified by prognostic risk groups.
The chosen model retained the ability to separate patients into prognostically discrete groups, irrespective of the type of ICI received. Supplementary Table 6 outlines OS outcomes and hazard ratios in this regard, with favorable risk patients (54.5% 115/211) treated with anti-PD1i experiencing a mOS of 41.4 months, similar to the pivotal trial data,4,18 compared to a mOS of only 2.7 months with poor-risk patients (9% 19/211), HR 7.95 (95% CI, 4.49-14.05, P < .001). Similar capacity to identify a group with prolonged OS was seen in the combination ICI-treated cohort, with favorable risk patients compared to poor risk patients HR 7.74 (95% CI, 2.77-21.6, P < .001). Therefore, the risk model is still able to robustly stratify patients within immunotherapy treatment groups as shown in Supplementary Fig. 2A, 2B.
Model Validation
We undertook a 2-phase validation process for our findings. For internal validation, we performed 500 random bootstrapped resampled datasets to derive an optimism corrected c-index of the final 3 group model post bootstrap procedures which was 0.67 (95% CI, 0.64-0.73) suggesting robust internal validation of the proposed model.
We further evaluated the performance of the risk model in an independent cohort of advanced melanoma patients receiving later-line therapy (n = 142). Analysis demonstrated a c-index of 0.65 (95% CI, 0.62-0.70) in this population, comparable to the discovery and internal validation values. The model demonstrated utility as a stratification tool with the hazard ratio between groups showing: intermediate vs favorable HR 2.44 (95% CI, 1.63-3.66, P < .001) and poor vs. favorable: HR 4.60 (95% CI, 2.53-8.34, P < .001) (Table 3). The risk stratification in this validation cohort is demonstrated in Fig. 4. These results demonstrate robust stratification in advanced melanoma patients in this validation set, in both statistical performance and clinical utility.
Survival outcomes for patient risk groups as stratified by the risk model in the advanced melanoma validation cohort.
| Risk group | Number of adverse prognostic factors | Number of patients (%) | Number of events | HR (95% CI) | CoxPH P-value | Median OS in months (95% CI) | 1-year OS % (95% CI) |
|---|---|---|---|---|---|---|---|
| Favorable | 0-1 | 60 (42.3) | 40 | Ref | 24.1 (16.5, 48.9) | 68.3 (57.5-81.2) | |
| Intermediate | 2-3 | 66 (46.4) | 60 | 2.44 (1.63, 3.66) | <.001 | 6.77 (3.5, 12.1) | 34.9 (25.0-48.5) |
| Poor | ≥ 4 | 16 (11.3) | 16 | 4.60 (2.53, 8.34) | <.001 | 2.57 (0.87, 15.1) | 18.8 (6.8-52.0) |
Abbreviations: OS, overall survival; HR, hazard ratio.
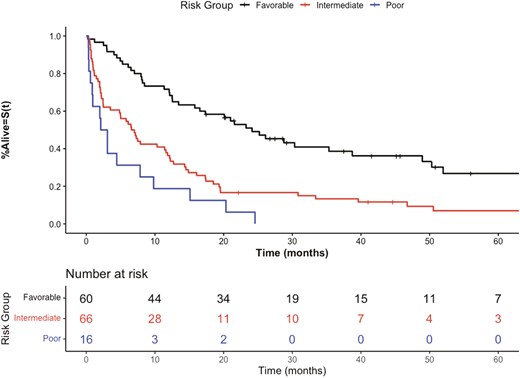
Kaplan-Meier overall survival curves of external validation cohort stratified by prognostic groups.
Discussion
Using data from 318 patients we derived a simple 5-factor prognostic model for OS by including only accessible clinical variables present at the start of first-line ICI treatment. The final 3 group risk scores including these prognostic factors yielded a C-index of 0.69, with an optimism corrected performance of 0.67 (95% CI, 0.64-0.73) post-bootstrapping. comparable to contemporary studies.12 Clinically, these risk groups; favorable (0-1 prognostic factor, mOS 52.9 months), intermediate (2-3 prognostic factors mOS 13 months), and poor (≥ 4 prognostic factors mOS 2.7 months) clearly parse patients discretely based on OS. This prognostic model also performs well irrespective of type of therapy received, with consistent delineation of prognosis in both single agent anti-PD1i [poor vs. favorable risk HR 7.95 (95% CI, 4.49-14.05)] and combination ICI therapy [poor vs. favorable risk HR 7.74 (95% CI, 2.77-21.62). Lastly, we externally validated this model in an independent cohort of 142 patients with advanced melanoma receiving ICI in later lines of therapy (c-index 0.65).
Several clinical variables have been described to be associated with OS in patients with advanced solid tumors treated with ICI. These include ECOG PS,19 anatomical sites of metastases,20,21 LDH22and NLR.23,24 However, current literature on reliable prognostic scores for advanced melanoma with ICI is limited. Given that each final prognostic variable retains an independent adverse significant association with OS in a multivariable model, clinicians can be confident of their individual importance in the final risk classification. Previous attempts to externally validated the prognostic potential of a model included: ECOG PS, presence of liver and brain metastases, anemia, LDH > ULN, elevated serum NLR, therapy (monotherapy/combination), and line of treatment in a large retrospective cohort.12 Our study adds hypoalbuminemia as an additional prognostic factor for OS to this model, while further confirming the prognostic importance of ECOG PS, LDH, WBC ≥ ULN, and presence of liver metastases.
Baseline liver metastases are associated with diminished OS in melanoma patients that receive ICI, independent of other established prognostic variables.25 In our study the presence of liver metastases was confirmed as an independent adverse prognostic factor. The liver is a site of immune-senescence, which manifests a tumor microenvironment that induces T-cell tolerance and excludes intra-tumoral T-cell infiltrates. The subsequent diminished T-cell repertoires and function lead to ICI resistance.26-28 Pre-clinical models suggest systemic effects of liver metastases due to widespread immunosuppression29 from activation of T-cell apoptotic pathways.25
ECOG PS has been an established prognostic factor since the previous interleukin-2-based immunotherapy era of melanoma treatment.30 Whether quoted OS gains from ICI seen in a trial setting translate to unselected patients with poorer ECOG PS in routine clinical practice is unclear. ECOG ≥ 2 has been found to be an independent risk factor for poorer OS in a real-world experience with anti-PDi monotherapy in melanoma31 and non-small cell lung cancer (NSCLC).32 Our findings suggest the magnitude of this effect is similarly impactful and ECOG PS may help identify a poor prognosis risk cohort where prolonged clinical trial survival data on the activity of ICI may fail to translate into real-world benefit.
We also identified serological markers associated with OS, including elevated LDH, WBC count, and hypoalbuminemia. LDH is part of the AJCC staging criteria33 and yields both predictive and prognostic utility in solid tumor malignancies treated with ICI, including NSCLC and renal cell carcinoma.34 It has been consistently identified as a serological biomarker associated with response and survival for ICI therapy in metastatic melanoma.13,35 ICI resistance in the advanced melanoma setting has been identified in patients with cancer-cachexia syndrome and falling albumin.36-38 Hypoalbuminemia is a marker of systemic inflammatory burden and is a negative acute phase reactant,39 thus it may have clinical utility in delineating a more aggressive disease course.40 Hypoalbuminemia has also recently been identified as a prognostic factor in NSCLC treated with ICI.41 Lastly, an elevated WBC count has been associated with a heightened systemic inflammatory burden and worse outcomes in patients with solid tumors. Other serological inflammatory markers, such as the derived neutrophil to lymphocyte ratio (dNLR) were previously correlated with worse outcomes in advanced melanoma.23,24 The utilization of dNLR as a categorical rather than continuous variable may have contributed to the eventual failure of that variable to enter the final model but given our focus on developing a practicable tool this was thought to be appropriate.
The simplicity of this model contrasts with the multi-omic approaches that were developed with high-throughput bulk, single cell, and spatial tumor sequencing. Though, in this manner, the key roles of tumor mutational burden and interferon-gamma gene signatures42 were identified, issues with tumoral heterogeneity, sampling, and temporal disparity,43 alongside inaccessibility for clinical purposes pose significant challenges in integrating these approaches in routine practice. In this landscape readily available variables such as ours may prove useful in real-world practice. Province-wide academic and community oncology centers contributed to the discovery cohort for this study, increasing the generalizability of our results to the wider population of practicing oncologists, in contrast to past models that were derived from tertiary referral populations.12,13,44 The focus on overall survival makes our findings more interpretable to patients and physicians alike and can be directly used in patient counseling, given the absence of confounding by subsequent lines of therapy. The median OS of our favorable risk cohort treated with anti-PD1i monotherapy of 41.4 months is similar to the trial experiences of treatment naïve patients receiving nivolumab (36.9 months)45 or pembrolizumab (38.6 months),18 giving confidence that patients identified as favorable risk in these work experience outcomes similar to a trial eligible population. Our inclusion of ECOG PS as a prognostic variable in our model may reflect these similar survival outcomes, given that ECOG PS >1 is a frequent trial exclusion criterion.46,47 Finally, our external validation in later lines of therapy further speaks to the robustness of the model.
Study Limitations
Limitations of this study include its retrospective nature and observational approach that contributes to incomplete data collection. These were addressed via utilization of consecutive patient sampling to reduce selection bias and a robust statistical approach to missing data. The multiple institutions, but single province nature of our dataset may introduce treatment biases due to similar practice patterns. Brain metastases are an established negative prognostic factor in metastatic melanoma33 and an established stratification factor in pivotal ICI trial protocols.46 Our inability to identify this as a negative prognostic factor may be due to the small number of patients with brain metastases in our cohort, 12.9% (n = 45), and thus this may be a nonrepresentative sample compared to a wider cohort. Although we performed external validation using later lines of therapy, our model requires further external validation with a larger patient cohort across multiple international sites to increase clinical relevance. However, our high internal validity, as evidenced by consistent hazard ratios and similar optimism corrected c-indices encourages us that these findings can be further replicated externally.
Conclusions
Outcomes to ICI therapy in locally advanced or metastatic melanoma remain heterogenous. ICI treatments carry substantial toxicity, both physiological in the form of immune-related adverse events48 and financial,49 but are appropriately the cornerstone of the current therapeutic landscape. We present a first-line prognostic model composed of 5 easily accessible clinical parameters that can stratify patients with advanced melanoma into favorable, intermediate, and poor prognostic risk groups. Furthermore, our model holds up in the later lines of treatment. These risk groups discriminate outcomes for patients irrespective of whether they received single agent or combination ICI and can prognosticate in advanced melanoma. Further studies are required to externally validate these prognostic criteria. This prognostic model is straightforward to use and will aid in patient counseling and expectation setting at the commencement of first-line systemic ICI.
Funding
No funding was provided for this study.
Conflict of Interest
Vishal Navani has acted in an advisory role for Kyowa Kirin and IPSOS. Daniel Y.C. Heng has acted in a consulting or advisory role for Pfizer, Novartis, Bristol Myers Squibb, Janssen, Astellas, Ipsen, Eisai, and Merck, and received research funding from Pfizer, Novartis, Exelixis, Bristol Myers Squibb, and Ipsen. Jose Monzon has acted in a consulting or advisory role for Amgen, Bristol Myers Squibb, Merck, Novartis, Celgene, and Taiho, and received research funding from Merck. Tina Cheng has received research funding from Pfizer. The other authors indicated no financial relationships.
Author Contributions
Conception/design: I.S., V.N., D.B., D.H., J.M., T.C. Acquisition of data: I.S., D.M., S.G., M.S., B.E. Collection and/or assembly of data: I.S., D.M., S.G., M.S., B.E. Data analysis and interpretation: I.S., V.N., M.G., Y.R., D.B., D.O., D.B., D.H. Manuscript writing: I.S., V.N. Final approval of manuscript: All authors.
Ethics Statement
This study was approved by the Health Research Ethics Board of Alberta – Cancer Committee (HREBA.CC-19-0380).
Data Availability
The data underlying this article cannot be shared publicly due to the data including retrospective provincial patient data. The data will be shared on reasonable request to the corresponding author.
References
Author notes
Co-first authors.
