


Abstract
Liver injury in patients with coronavirus disease 2019 (COVID-19) is common and prognostic. Direct viral tropism of severe acute respiratory syndrome coronavirus 2 (SARS-CoV-2) for angiotensin-converting enzyme 2 receptors in hepatocytes may be one of the mechanisms of liver injury. We aimed to determine the role of viral persistence of SARS-CoV-2, based on cycle threshold (Ct) value, in liver injury in COVID-19.
This was a territory-wide retrospective cohort study of all public hospitals in Hong Kong. Laboratory-confirmed COVID-19 was identified. Serial liver biochemistries and Ct values of SARS-CoV-2 RNA were analyzed.
We identified 7622 COVID-19 patients (mean age, 47 years; 48.2% male) diagnosed from March 24 to January 1, 2021, who had serial liver biochemistries and Ct values. A total of 1363 (17.9%) COVID-19 patients had alanine transferase (ALT)/aspartate aminotransferase (AST) elevations with 2 temporal patterns—early (within first 14 days of symptom onset) and late (>14 days from symptom onset). COVID-19 patients with ALT/AST elevations had a lower Ct value at admission (23 vs 25; P < .001), day 5 (24 vs 26; P < .001), and day 20 (31 vs 32; P < .001) after admission, compared with those without ALT/AST elevations. COVID-19 patients with ALT/AST elevations had a longer duration from first positive to first negative reverse transcription polymerase chain reaction test for SARS-CoV-2 (13 vs 9 days; P < .001). ALT/AST elevation and presence of diabetes were independent risk factors of viral persistence.
Liver injury in COVID-19 is linked to a higher SARS-CoV-2 viral load during the early phase of infection, signifying a possible direct viral injury to the liver. Prolonged viral persistence of SARS-CoV-2 is associated with liver injury.
Liver injury is frequently observed and prognostic in patients with coronavirus disease 2019 (COVID-19) [1–3]. While this is likely a multifactorial phenomenon related to infection, hypoxia, co-medications, etc., direct viral tropism for angiotensin-converting enzyme 2 (ACE2) receptors in hepatocytes and cholangiocytes has been proven [4, 5]. Despite the relatively low percentage of hepatocytes expressing ACE2, receptor abundance may not be always consistent with organ symptoms, as transactivation of ACE2 may be triggered by inflammatory signals such as type I interferon or interleukin-6 during severe acute respiratory syndrome coronavirus 2 (SARS-CoV-2) infection [6]. Liver injury in COVID-19 patients remains a therapeutic challenge, as it is strongly associated with adverse clinical outcomes [3, 7, 8]; at the same time, therapeutic options against SARS-CoV-2 are potentially hepatotoxic [9, 10].
Considering direct viral tropism in the liver, the viral dynamics of SARS-CoV-2 infection may be linked to the trajectory of liver enzymes and risk of liver injury. In a recent modeling study, SARS-CoV-2 viral load increased rapidly in the initial stage and reached a peak, followed by a plateau phase possibly generated by lymphocytes as a secondary target of infection. In the last stage of infection, SARS-CoV-2 viral load declined due to the emergence of adaptive immune responses. When initiation of seroconversion was late or slow, the model predicted viral rebound and prolonged viral persistence [11]. Hence viral persistence of SARS-CoV-2 and delayed seroconversion may reflect immunodeficiency, as has been observed in solid organ transplant recipients [12, 13].
The role of viral persistence of SARS-CoV-2 in disease severity in COVID-19 patients remains ambiguous, and data are conflicting. Investigators in mainland China reported that patients who had viral persistence for longer than 16 days had more severe disease outcomes, including extensive lung involvement and requirement of respiratory support [14]. Another small study in Hong Kong, however, did not demonstrate any association between prolonged persistence of SARS-CoV-2 (≥20 days after symptom onset) and severity of illness [15]. Prolonged persistence of SARS-CoV-2 for more than 2 weeks was observed in nearly one-fourth of asymptomatic COVID-19 patients [16]. Furthermore, no studies have specifically looked into the relationship between the level and persistence of SARS-CoV-2 and liver injury. In the current study, we aimed to determine the role of viral persistence of SARS-CoV-2 on liver injury in COVID-19 patients.
METHODS
Setting and Study Design
A territory-wide retrospective cohort study was performed using data from the Clinical Data Analysis and Reporting System (CDARS) under the management of the Hospital Authority of Hong Kong [17]. CDARS is an electronic health care database that covers patients’ demographics, death, diagnoses, procedures, drug prescription and dispensing history, and laboratory results from all public hospitals and clinics in Hong Kong [18]. The Hospital Authority provides >90% of health care service to the entire population. All suspected and confirmed cases of COVID-19 in Hong Kong are under the care of the Hospital Authority. We performed testing for SARS-CoV-2 reverse transcription polymerase chain reaction (RT-PCR) for both symptomatic patients presenting to outpatient clinics and hospitals, as well as asymptomatic close contacts of confirmed patients and inbound travelers. All data are de-identified in CDARS to ensure data privacy. Territory-wide studies on different infectious diseases including COVID-19 have previously been conducted using CDARS [3, 19–22]. The International Classification of Diseases, Ninth Revision, Clinical Modification (ICD-9-CM) coding was adopted in CDARS; its use in CDARS to identify medical conditions has validated to be 99% accurate when referenced to clinical, laboratory (including cycle threshold [Ct] values of SARS-CoV-2 RNA), imaging, and endoscopy results from electronic medical records [23]. The Centre for Health Protection (CHP) at the Department of Health of the Hong Kong Government provides daily updates on individual laboratory-confirmed cases via its official website; data on date of COVID-19 onset of all confirmed cases were obtained from the CHP and linked to data in CDARS.
Subjects
We first identified consecutive laboratory-confirmed COVID-19 patients from January 23, 2020, to January 1, 2021, by virological results (Supplementary Table 1) and linked them with data on patients’ Ct values during infection, which had become available on CDARS on March 24, 2020. Hence, we included all COVID-19 patients diagnosed from March 24, 2020, to January 1, 2021, in the final analysis. We excluded patients who had missing alanine transferase (ALT) measurements at the time of diagnosis and those with no Ct values at the time of diagnosis or subsequent visits. Patients were followed until the last day of hospitalization, last clinic visit, or death, whichever came first. The study protocol was approved by the Joint Chinese University of Hong Kong–New Territories East Cluster Clinical Research Ethics Committee.
Clinical Evaluation
More than 99% of COVID-19 patients in Hong Kong were admitted to medical wards or intensive care units with isolation facilities. Initial investigations included a complete blood count (with a differential count), clotting profile (prothrombin time, activated partial thromboplastin time, international normalized ratio [INR]), and serum biochemical measurements (electrolytes, renal and liver biochemistries, C-reactive protein and lactate dehydrogenase, glucose and procalcitonin) [24]. These laboratory assessments and chest radiography were performed regularly as clinically indicated. A standardized real-time RT-PCR assay was used to detect a conserved region in the E gene of SARS-CoV and SARS-CoV-2 as well as other bat-associated SARS-related viruses (sarbecovirus) as screening [25]. RT-PCR was positive if the Ct values of both the envelope (E) and RNA-dependent RNA polymerase (RdRp) genes of SARS-CoV-2 were <40 [26]. All positive samples were sent out to the Public Health Laboratory Services Branch, Centre for Health Protection, Department of Health, for confirmation by real-time RT-PCR targeting the SARS-CoV-2-specific RNA-dependent RNA polymerase gene region.
Clinical Management of COVID-19
Antibacterial therapy, using a beta-lactamase inhibitor or third-generation cephalosporin with or without a macrolide or doxycycline, was initiated if bacterial infection was suspected or confirmed [27]. Supportive therapy, including supplemental oxygen, intravenous fluid, vasopressor support, mechanical ventilation, and renal replacement therapy, was given as appropriate. During the study period, patients were either recruited into clinical trials (NCT04276688, NCT04292730, NCT04292899) or given antiviral agents, including remdesivir, interferon beta-1b, ribavirin, or lopinavir-ritonavir, as indicated according to local interim guidelines. Systemic corticosteroids were given in patients requiring supplemental oxygen therapy. Patients were discharged when they improved clinically and with 2 consecutive clinical specimens testing negative for SARS-CoV-2.
Data Collection
Data were retrieved from CDARS in February 2021. Baseline date was defined as the date of diagnosis of COVID-19 by virological results. Demographic data including date of birth and gender were captured. Death dates were captured and ascertained using data from CDARS and the Hong Kong Death Registry. Date of symptom onset was obtained from CHP. At baseline, hematological and virological parameters and liver and renal biochemistries were collected. Thereafter, serial liver biochemistries, SARS-CoV-2 viral assays, and Ct values were collected until the last follow-up (Supplementary Table 1). We also retrieved data on other relevant diagnoses, procedures, admission to the intensive care unit, concomitant drugs, laboratory parameters, and exposure to antivirals, antibiotics and antifungals, corticosteroids, interferon beta, and immunoglobulin during hospitalization (Supplementary Table 2).
Chronic hepatitis B and hepatitis C were defined based on viral serology, use of antiviral treatment, and/or ICD-9-CM diagnosis codes [20]. Liver cirrhosis was identified by ICD-9-CM diagnosis codes for cirrhosis and its related complications and/or platelet counts <100×109/L in a measurement at least 30 days before COVID-19 diagnosis (Supplementary Table 3). Hypertension was identified by any use of antihypertensive drugs and/or ICD-9-CM diagnosis codes (401–404); diabetes mellitus (DM) was defined by regular use of any antidiabetic agents, and/or hemoglobin A1c ≥6.5%, and/or fasting plasma glucose ≥7.0 mmol/L, and/or the ICD-9-CM diagnosis code for DM (250) [28]. Use of invasive mechanical ventilation was defined by ICD-9-CM procedure codes 96.04, 96.05, 96.7.
Definitions of Events
The primary outcome was ALT/aspartate aminotransferase (AST) elevation, which was defined as ALT and/or AST ≥2× the upper limit of normal (ULN). ULN of ALT and AST were defined according to the criteria of the Asian Pacific Association for the Study of the Liver (40 U/L for both genders) [29]. Early and late ALT/AST elevation were defined as ALT/AST elevation that first developed within the first 14 days after symptom onset or after the first 14 days after symptom onset, respectively. The trajectory of Ct values of patients during SARS-CoV-2 infection and the time to first negative RT-PCR were analyzed and compared in patients with and without ALT/AST elevation. Negative RT-PCR of SARS-CoV-2 was indicated by a negative qualitative result or a quantitative Ct value ≥40.
Statistical Analysis
Data were analyzed using Statistical Product and Service Solutions (SPSS), version 25.0 (SPSS, Inc., Chicago, IL, USA), and R software (4.0.3; R Foundation for Statistical Computing, Vienna, Austria). Continuous variables are expressed as mean ± SD or median (interquartile range [IQR]), as appropriate, while categorical variables are presented as number (percentage). P values on multiple comparisons were adjusted by Bonferroni correction. Qualitative and quantitative differences between subgroups were analyzed by the chi-square test or Fisher exact test for categorical parameters and the Student t test or Mann-Whitney U test for continuous parameters, as appropriate. Odds ratios (ORs) and adjusted ORs with 95% confidence intervals of the lowest Ct value during SARS-CoV-2 infection on ALT/AST elevation were estimated by logistic regression. Linear regression was used to examine the relationship between ALT/AST elevation and time to first negative RT-PCR of SARS-CoV-2 and between ALT/AST elevation and the lowest Ct value during SARS-CoV-2 infection. We adjusted for the following covariates: age; gender; presence of liver cirrhosis; DM; hypertension; use of corticosteroids, remdesivir, and other antiviral agents including interferon-beta, lopinavir-ritonavir, and/or ribavirin; and the lowest Ct value for linear regression between ALT/AST elevation and time to first negative SARS-CoV-2 RT-PCR. No patients were excluded from the analysis due to missing data. Backward stepwise selection was used to select significant covariates in multivariable models. All statistical tests were 2-sided. Statistical significance was set at P < .05. Subgroup analyses were performed on patients with early or late ALT/AST elevation, compared with patients without any ALT/AST elevation.
RESULTS
Demographic Characteristics
We first identified 8675 COVID-19 patients (97.6% of all COVID-19 patients reported to the Department of Health, Hong Kong) from January 23, 2020, and January 1, 2021; 8318 patients diagnosed between March 24, 2020, and January 1, 2021, were linked to Ct value data; 7622 patients were included in the final analysis (Figure 1). At baseline, most of patients had compensated liver function: serum albumin 41 ± 5 g/L, total bilirubin 9 ± 6 μmol/L, median ALT (IQR) 23 (16–36) U/L. Chronic hepatitis B, chronic hepatitis C, and liver cirrhosis were diagnosed in 340/5170 (6.6%), 47/4274 (1.1%), and 88 (1.2%) COVID-19 patients, respectively; 1261 (16.5%) and 1903 (25.0%) patients had liver cirrhosis, DM, and hypertension, respectively (Table 1).
Clinical Characteristics of Patients With SARS-CoV-2 Infection Between March 24, 2020, and January 1, 2021, in Hong Kong
| Clinical Characteristics | All (n = 7622) | Without ALT/AST Elevation (n = 6259) | With ALT/AST Elevation (n = 1363) | P Value |
|---|---|---|---|---|
| Male gender, No. (%) | 3675 (48.2) | 2770 (44.3) | 905 (66.4) | <.001 |
| Age, y | 47.4 ± 19.2 | 45.9 ± 19.3 | 54.3 ± 17.0 | <.001 |
| Ct value of RT-PCR test for SARS-CoV-2 at baseline | 24.3 ± 6.8 | 24.7 ± 6.9 | 22.6 ± 6.3 | <.001 |
| 23.6 (18.7–29.5) | 24.1 (19.1–29.9) | 21.6 (17.6–26.9) | <.001 | |
| Lowest Ct value of RT-PCR test for SARS-CoV-2 | 22.6 ± 6.6 | 23.0 ± 6.7 | 20.7 ± 5.8 | <.001 |
| 21.5 (17.1–27.4) | 22.0 (17.5–28.0) | 19.5 (16.2–24.5) | <.001 | |
| Last Ct value of RT-PCR test for SARS-CoV-2 | 32.8 ± 3.6 | 32.9 ± 3.6 | 32.8 ± 3.7 | .285 |
| 33.0 (30.9–35.1) | 33.0 (30.9–35.2) | 33.1 (30.9–35.1) | .772 | |
| Platelets, ×109/L | 222.5 ± 74.5 | 226.6 ± 74.4 | 203.8 ± 72.3 | <.001 |
| Platelets <150×109/L, No. (%) | 1066 (14.0) | 751 (12.0) | 315 (23.1) | <.001 |
| INR | 1.1 ± 0.2 | 1.0 ± 0.1 | 1.1 ± 0.4 | .003 |
| Missing, % | 41.5 | 46.0 | 20.8 | |
| Albumin, g/L | 40.5 ± 5.0 | 40.8 ± 4.8 | 39.2 ± 5.7 | <.001 |
| Total bilirubin, μmol/L | 8.7 ± 5.8 | 8.5 ± 5.5 | 9.5 ± 7.1 | <.001 |
| ALP, ×ULN | 0.6 ± 0.3 | 0.6 ± 0.2 | 0.7 ± 0.5 | <.001 |
| ALT, U/L | 23 (16–36) | 21 (15–31) | 42 (25–80) | <.001 |
| AST, U/L | 28 (22–44) | 25 (20–32) | 52 (33–85) | <.001 |
| Missing, % | 69.9 | 75.0 | 46.2 | |
| Creatinine, μmol/L | 69 (58–83) | 67 (57–81) | 77 (66–91) | <.001 |
| CRP, mg/dL | 1.6 ± 3.1 | 1.2 ± 2.5 | 3.2 ± 4.7 | <.001 |
| Missing, % | 1.3 | 1.5 | 0.4 | |
| LDH, U/L | 213.8 ± 83.4 | 202.2 ± 62.9 | 267.0 ± 131.3 | <.001 |
| Missing, % | 1.5 | 1.7 | 0.9 | |
| WCC, ×109/L | 5.7 ± 2.1 | 5.6 ± 2.1 | 5.8 ± 2.2 | .001 |
| WCC <3.5×10⁹/L, No. (%) | 785 (10.3) | 654 (10.5) | 131 (9.6) | .356 |
| Neutrophil, ×109/L | 3.6 ± 1.8 | 3.5 ± 1.7 | 4.0 ± 2.1 | <.001 |
| Missing, % | 0.3 | 0.4 | 0.1 | |
| Lymphocyte, ×109/L | 1.4 ± 0.8 | 1.5 ± 0.8 | 1.2 ± 0.6 | <.001 |
| Lymphocyte <1×10⁹/L, No. (%) | 2137 (28.1) | 1571 (25.2) | 566 (41.6) | <.001 |
| Missing, % | 0.3 | 0.4 | 0.1 | |
| HBV infection, No. (%) | 340 (6.6) | 257 (6.6) | 83 (6.6) | .966 |
| Missing, % | 32.2 | 37.6 | 7.0 | |
| HCV infection, No. (%) | 47 (1.1) | 36 (1.1) | 11 (1.0) | .635 |
| Missing, % | 43.9 | 49.8 | 17.1 | |
| Cirrhosis, No. (%) | 88 (1.2) | 70 (1.1) | 18 (1.3) | .527 |
| Diabetes mellitus, No. (%) | 1261 (16.5) | 854 (13.6) | 407 (29.9) | <.001 |
| Hypertension, No. (%) | 1903 (25.0) | 1363 (21.8) | 540 (39.6) | <.001 |
| Medication use during follow-up, No. (%) | ||||
| Remdesivir | 576 (7.6) | 372 (5.9) | 204 (15.0) | <.001 |
| Corticosteroids | 1300 (17.1) | 702 (11.2) | 598 (43.9) | <.001 |
| Dexamethasone | 1243 (16.3) | 667 (10.7) | 576 (42.3) | <.001 |
| Hydrocortisone | 120 (1.6) | 54 (0.9) | 66 (4.8) | <.001 |
| Prednisolone | 67 (0.9) | 35 (0.6) | 32 (2.3) | <.001 |
| Methylprednisolone | 3 (0.04) | 1 (0.02) | 2 (0.1) | .084 |
| Peak corticosteroid daily dose, prednisolone equivalent, mg | 45 (45–45) | 45 (45–45) | 45 (45–60) | .003 |
| Interferon beta, No. (%) | 2859 (37.5) | 1984 (31.7) | 875 (64.2) | <.001 |
| Lopinavir-ritonavir, No. (%) | 1505 (19.7) | 1063 (17.0) | 442 (32.4) | <.001 |
| Ribavirin, No. (%) | 1648 (21.6) | 1141 (18.2) | 507 (37.2) | <.001 |
| Antibiotic treatment, No. (%) | 2458 (32.2) | 1682 (26.9) | 776 (56.9) | <.001 |
| Antifungal treatment, No. (%) | 41 (0.5) | 11 (0.2) | 30 (2.2) | <.001 |
| Oseltamivir, No. (%) | 30 (0.4) | 19 (0.3) | 11 (0.8) | .007 |
| IVIG, No. (%) | 8 (0.1) | 2 (0.03) | 6 (0.4) | .001 |
| Clinical outcomes in 60 d, No. (%) | ||||
| Death | 144 (1.9) | 82 (1.3) | 62 (4.5) | <.001 |
| ICU admission | 374 (4.9) | 144 (2.3) | 230 (16.9) | <.001 |
| Invasive mechanical ventilation | 179 (2.3) | 57 (0.9) | 122 (9.0) | <.001 |
All concomitant medications are represented as binary parameters. Percentages were computed based on nonmissing values. Continuous variables are presented as mean ± SD and median (interquartile range).
Abbreviations: ALP, alkaline phosphatase; ALT, alanine aminotransferase; AST, aspartate aminotransferase; CRP, C-reactive protein; HBV, hepatitis B virus; HCV, hepatitis C virus; ICU, intensive care unit; INR, international normalized ratio; IVIG, intravenous immunoglobulin therapy; LDH, lactate dehydrogenase; ULN, upper limit of normal; SARS, severe acute respiratory syndrome; WCC, white cell count.

Patient flowchart. Abbreviations: ALT, alanine aminotransferase; Ct, cycle threshold; SARS-CoV-2, severe acute respiratory syndrome coronavirus 2.
Liver Injury and Serial Ct Value
ALT/AST elevation occurred in 1363 (17.9%) COVID-19 patients (Table 1). Patients who developed ALT/AST elevation were older; more likely to have DM and hypertension; had higher alkaline phosphatase, total bilirubin, creatinine, C-reactive protein, lactate dehydrogenase, and neutrophil; and had lower albumin and Ct values at admission, lower trough Ct values, and lower lymphocyte counts than patients who did not develop ALT/AST elevation during SARS-CoV-2 infection. The median (IQR) peak ALT was 124 (96–178) U/L and 27 (18–41) U/L in patients with and without ALT/AST elevation, respectively. The median (IQR) peak AST was 70 (42–110) U/L and 26 (21–36) U/L in those with and without ALT/AST elevation, respectively.
Patients who developed ALT/AST elevation had a lower Ct value, that is, higher viral load, at baseline; the observed difference began at baseline and was sustained through the first 20 days after baseline (Table 2, Figures 2A and B). At baseline, the median (IQR) Ct value was 22 (18–27) and 24 (19–30) in patients with and without ALT/AST elevation, respectively (adjusted P < .001). The corresponding Ct values at the subsequent time points were as follows: on day 5, 24 (19–29) vs 26 (20–31; adjusted P < .001); on day 10, 28 (24–32) vs 30 (25–33; adjusted P < .001); on day 15, 30 (26–34) vs 31 (28–34; adjusted P < .001); on day 20, 32 (28–35) vs 33 (29–35; P < .001). The mean Ct values did not differ at subsequent time points; the median Ct value did not differ on day 30 (Table 2).
Ct Value During Follow-up of 7622 Patients With Infection of SARS-CoV-2 Between March 24, 2020, and January 1, 2021, in Hong Kong
| Without ALT/AST Elevation (n = 6259) | With ALT/AST Elevation (n = 1363) | P Value | Adjusted P Valuea | |
|---|---|---|---|---|
| Ct value at baseline | 24.7 ± 6.9 | 22.6 ± 6.3 | <.001 | <.001 |
| 24.1 (19.1–29.9) | 21.6 (17.6–26.9) | <.001 | <.001 | |
| Ct value at day 5 | 25.6 ± 6.5 | 24.1 ± 6.1 | <.001 | <.001 |
| 25.6 (20.3–30.8) | 23.7 (19.0–28.6) | <.001 | <.001 | |
| Ct value at day 10 | 28.9 ± 5.3 | 27.4 ± 5.4 | <.001 | <.001 |
| 29.5 (25.2–32.9) | 27.6 (23.5–31.6) | <.001 | <.001 | |
| Ct value at day 15 | 30.8 ± 4.6 | 29.6 ± 4.9 | <.001 | <.001 |
| 31.2 (28.2–34.3) | 30.2 (26.2–33.5) | <.001 | <.001 | |
| Ct value at day 20 | 31.7 ± 4.6 | 30.9 ± 4.8 | <.001 | <.001 |
| 32.5 (29.0–35.1) | 31.6 (27.9–34.7) | <.001 | <.001 | |
| Ct value at day 25 | 32.4 ± 4.8 | 31.7 ± 4.8 | .009 | .065 |
| 33.5 (29.8–36.0) | 32.7 (29.2–35.2) | .002 | .012 | |
| Ct value at day 30 | 33.1 ± 4.1 | 32.1 ± 4.9 | .014 | .099 |
| 33.9 (30.8–36.1) | 33.6 (28.5–36.0) | .027 | .186 | |
| Duration from first positive to first negative RT-PCR of SARS-CoV-2 | 9 (5–13) | 13 (8–18) | <.001 | - |
| Duration from admission to first negative RT-PCR of SARS-CoV-2 | 10 (6–14) | 13 (9–19) | <.001 | - |
| Duration from symptom onset to first negative RT-PCR of SARS-CoV-2 | 13 (9–17) | 17 (12–22) | <.001 | - |
ALT and/or AST elevation was defined by ALT and/or AST ≥2× the upper limit of normal at baseline or during follow-up. The upper limit of normal of ALT and AST was 40 U/L. Ct value is presented as median (interquartile range) and mean ± SD. Duration is presented as median (interquartile range). Negative RT-PCR of SARS-CoV-2 is indicated by a negative qualitative result or a quantitative Ct value ≥40.
Abbreviations: ALT, alanine aminotransferase; AST, aspartate aminotransferase; Ct, cycle threshold; RT-PCR, reverse transcription polymerase chain reaction; SARS-CoV-2, severe acute respiratory syndrome coronavirus 2.
aP values for multiple comparison were adjusted by Bonferroni correction.
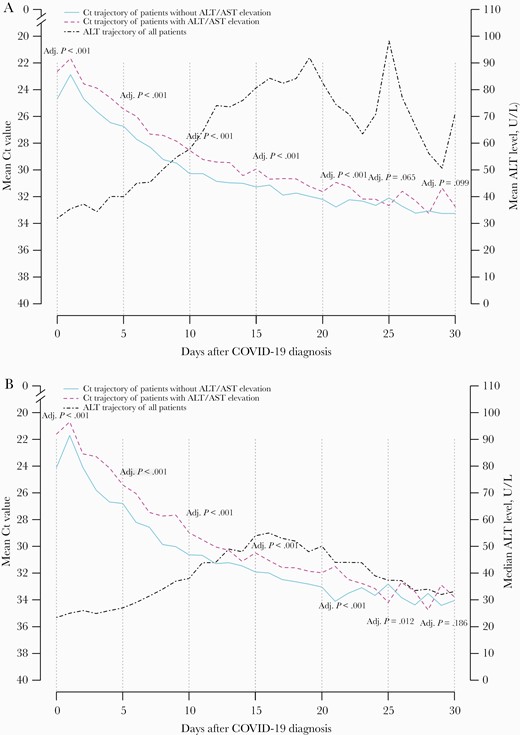
A, Mean and (B) median trajectory of Ct value of patients with and without ALT/AST elevation after hospitalization. Abbreviations: ALT, alanine aminotransferase; AST, aspartate aminotransferase; COVID-19, coronavirus disease 2019; Ct, cycle threshold.
We also observed 2 temporal patterns of ALT elevation (Figure 3A). One thousand twenty-eight of 1363 (75.4%) patients had onset of ALT elevation within the first 14 days after symptom onset; most of these patients’ ALT peaked within 1 month of symptom onset; the majority had received antiviral treatment for COVID-19 (68.5%) (Figure 3B). The other 335 (24.6%) patients had ALT elevation beyond the first 14 days after symptom onset; some of these patients’ ALT peaked beyond 1 month from symptom onset; and again, the majority had received antiviral treatment for COVID-19 (87.8%) (Figure 3C).
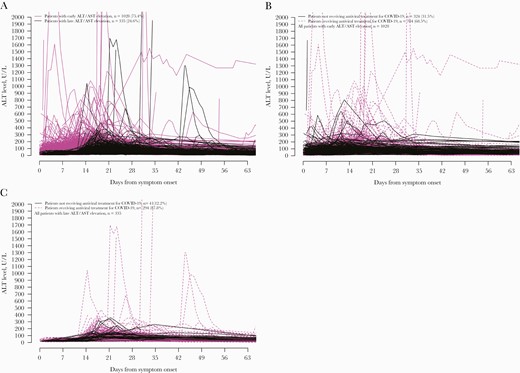
Serial serum ALT of patients infected with SARS-CoV-2 who first developed ALT/AST elevation (A) after symptom onset, (B) within the first 14 days, and (C) beyond the first 14 days after symptom onset. Abbreviations: ALT, alanine aminotransferase; AST, aspartate aminotransferase; Ct, cycle threshold; SARS-CoV-2, severe acute respiratory syndrome coronavirus 2.
Liver Injury and Viral Persistence
Patients who developed ALT/AST elevation had longer duration of viral persistence compared with those with persistently normal ALT/AST; they had a longer duration from first positive to first negative RT-PCR of SARS-CoV-2 (13 [8–18] vs 9 [5–13] days; P < .001), a longer duration from admission to first negative RT-PCR of SARS-CoV-2 (13 [9–19] vs 10 [6–14] days; P < .001), and a longer duration from symptom onset to first negative RT-PCR of SARS-CoV-2 (17 [12–22] vs 13 [9–17] days; P < .001) (Table 2).
On univariate analysis by logistic regression, a lower trough Ct value was associated with ALT/AST elevation (OR, 0.94; 95% CI, 0.94 to 0.95; P < .001). This remained an independent factor on multivariable analysis (aOR, 0.98; 95% CI, 0.97 to 0.99; P < .001). Other independent risk factors of ALT/AST elevation included use of corticosteroids, use of lopinavir-ritonavir (with or without ribavirin or interferon-beta), male gender, and mechanical ventilation (Table 3). A similar trend of trough Ct value associated with ALT/AST elevation was observed in early and late-onset ALT/AST elevation (Table 3).
Univariate and Multivariable Analysis by Logistic Regression on Factors Associated With ALT/AST Elevation in COVID-19 Patients
| Univariate Analysis | Multivariable Analysis | |||
|---|---|---|---|---|
| Parameters | OR (95% CI) | P Value | aOR (95% CI) | P Value |
| All ALT/AST Elevation | ||||
| Trough Ct value | 0.94 (0.94 to 0.95) | <.001 | 0.98 (0.97 to 0.99) | <.001 |
| Age | 1.02 (1.02 to 1.03) | <.001 | ||
| Male gender | 2.49 (2.20 to 2.81) | <.001 | 2.29 (2.01 to 2.61) | <.001 |
| Liver cirrhosis | 1.18 (0.70 to 1.99) | .527 | ||
| Diabetes mellitus | 2.69 (2.35 to 3.09) | <.001 | ||
| Hypertension | 2.36 (2.08 to 2.67) | <.001 | ||
| Use of corticosteroids | 6.19 (5.42 to 7.07) | <.001 | 3.58 (3.07 to 4.17) | <.001 |
| Use of remdesivir | 2.79 (2.32 to 3.34) | <.001 | ||
| Use of other antiviral agents for COVID-19 | 3.72 (3.29 to 4.21) | <.001 | 2.20 (1.91 to 2.53) | <.001 |
| Mechanical ventilation | 10.70 (7.77 to 14.74) | <.001 | 2.44 (1.73 to 3.46) | <.001 |
| Renal replacement | 8.32 (5.07 to 13.64) | <.001 | ||
| Positive HBsAg | 1.00 (0.77 to 1.29) | .966 | ||
| Positive anti-HCV | 0.85 (0.43 to 1.67) | .636 | ||
| Early ALT/AST elevation (within 14 d of symptom onset)a | ||||
| Trough Ct value | 0.96 (0.95 to 0.97) | <.001 | 0.99 (0.98 to 1.00) | .043 |
| Age | 1.020 (1.016 to 1.024) | <.001 | ||
| Male gender | 2.54 (2.21 to 2.92) | <.001 | 2.33 (2.02 to 2.70) | <.001 |
| Liver cirrhosis | 1.31 (0.75 to 2.30) | .347 | ||
| Diabetes mellitus | 2.49 (2.13 to 2.90) | <.001 | ||
| Hypertension | 2.11 (1.83 to 2.42) | <.001 | ||
| Use of corticosteroids | 5.60 (4.84 to 6.49) | <.001 | 3.63 (3.07 to 4.30) | <.001 |
| Use of remdesivir | 2.94 (2.41 to 3.58) | <.001 | ||
| Use of other antiviral agents for COVID-19 | 2.95 (2.58 to 3.38) | <.001 | 1.77 (1.51 to 2.07) | <.001 |
| Mechanical ventilation | 9.06 (6.4 to 12.82) | <.001 | 2.24 (1.54 to 3.27) | <.001 |
| Renal replacement | 6.73 (3.89 to 11.64) | <.001 | ||
| Positive HBsAg | 0.94 (0.71 to 1.27) | .703 | ||
| Positive anti-HCV | 0.93 (0.45 to 1.94) | .845 | ||
| Late ALT/AST elevation (>14 d after symptom onset)b | ||||
| Trough Ct value | 0.91 (0.89 to 0.92) | <.001 | 0.95 (0.93 to 0.98) | <.001 |
| Age | 1.04 (1.03 to 1.04) | <.001 | ||
| Male gender | 2.35 (1.86 to 2.95) | <.001 | 2.11 (1.65 to 2.7) | <.001 |
| Liver cirrhosis | 0.80 (0.25 to 2.55) | .705 | 0.28 (0.08 to 0.93) | .038 |
| Diabetes mellitus | 3.40 (2.68 to 4.30) | <.001 | ||
| Hypertension | 3.28 (2.63 to 4.10) | <.001 | ||
| Use of corticosteroids | 8.35 (6.65 to 10.49) | <.001 | 3.96 (3.01 to 5.21) | <.001 |
| Use of remdesivir | 2.33 (1.66 to 3.26) | <.001 | 0.53 (0.35 to 0.79) | .002 |
| Use of other antiviral agents for COVID-19 | 8.94 (6.73 to 11.88) | <.001 | 4.72 (3.46 to 6.44) | <.001 |
| Mechanical ventilation | 16.02 (10.6 to 24.21) | <.001 | 2.61 (1.57 to 4.34) | <.001 |
| Renal replacement | 13.33 (7.13 to 24.94) | <.001 | 2.29 (1.01 to 5.18) | .047 |
| Positive HBsAg | 1.14 (0.74 to 1.76) | .548 | ||
| Positive anti-HCV | 0.61 (0.15 to 2.55) | .498 | ||
ALT and/or AST elevation was defined by ALT and/or AST ≥2× the upper limit of normal at baseline or during follow-up. The upper limit of normal of ALT and AST was 40 U/L.
Abbreviations: ALT, alanine aminotransferase; anti-HCV, antibody to hepatitis C virus; aOR, adjusted odds ratio; AST, aspartate aminotransferase; COVID-19, coronavirus disease 2019; Ct, cycle threshold; HCV, hepatitis C virus; HBsAg, hepatitis B surface antigen; SARS-CoV-2, severe acute respiratory syndrome coronavirus 2.
aOne thousand twenty-eight patients with early ALT/AST elevation and 6259 patients without any ALT/AST elevation were included.
bThree hundrd thirty-five patients with late ALT/AST elevation and 6259 patients without any ALT/AST elevation were included.
Factors that might have contributed to early ALT/AST elevation (ie, within 14 days after first symptom onset) include (on top of low trough Ct value) male gender, use of corticosteroids and other antiviral agents for COVID-19, and mechanical ventilation (Table 3). Factors contributing to late ALT/AST elevation (ie, beyond 14 days after first symptom onset) include (on top of low trough Ct value) male gender, cirrhosis, diabetes mellitus, hypertension, use of corticosteroids and other antiviral agents for COVID-19, mechanical ventilation, and renal replacement (Table 3).
Predictors of Viral Persistence
From First Positive to First Negative RT-PCR of SARS-CoV-2
On univariate analysis by linear regression, ALT/AST elevation, lower trough Ct value, older age, male gender, liver cirrhosis, DM, hypertension, and use of corticosteroids, remdesivir, and other antiviral agents for COVID-19 were associated with a longer duration from first positive to first negative RT-PCR of SARS-CoV-2 (Table 4). ALT/AST elevation remained an independent risk factor on multivariable analysis (adjusted coefficient, 1.02; 95% CI, 0.62 to 1.42, P < .001); lower trough Ct value, liver cirrhosis, DM, hypertension, use of corticosteroids, use of COVID-19 antiviral agents, and mechanical ventilation were also independent risk factors. Use of remdesivir was associated with a shorter duration from first positive to first negative RT-PCR of SARS-CoV-2.
Univariate and Multivariable Analysis by Linear Regression on Factors Associated With Time to First Negative RT-PCR of SARS-CoV-2
| Duration From First Positive to First Negative RT-PCR of SARS-CoV-2 | ||||
|---|---|---|---|---|
| Univariate Analysis | Multivariable Analysis | |||
| Parameters | Coefficient (95% CI) | P Value | Adjusted Coefficient (95% CI) | P Value |
| ALT/AST elevation | 4.358 (3.894 to 4.822) | <.001 | 1.017 (0.616 to 1.418) | <.001 |
| Trough Ct value | –0.638 (–0.661 to –0.616) | <.001 | –0.556 (–0.578 to –0.533) | <.001 |
| Age | 0.098 (0.088 to 0.107) | <.001 | ||
| Male gender | 1.044 (0.684 to 1.403) | <.001 | ||
| Liver cirrhosis | 5.011 (3.201 to 6.820) | <.001 | 2.226 (0.798 to 3.654) | .002 |
| Diabetes mellitus | 4.519 (4.030 to 5.007) | <.001 | 0.537 (0.075 to 1.000) | .023 |
| Hypertension | 3.838 (3.423 to 4.253) | <.001 | 0.763 (0.380 to 1.147) | <.001 |
| Use of corticosteroids | 7.673 (7.202 to 8.144) | <.001 | 4.347 (3.846 to 4.848) | <.001 |
| Use of remdesivir | 4.833 (4.100 to 5.565) | <.001 | –1.335 (–1.982 to –0.687) | <.001 |
| Use of other antiviral agents for COVID-19 | 4.824 (4.472 to 5.177) | <.001 | 0.858 (0.530 to 1.186) | <.001 |
| Mechanical ventilation | 12.885 (11.557 to 14.213) | <.001 | 5.234 (4.083 to 6.384) | <.001 |
| Renal replacement | 8.785 (6.352 to 11.217) | <.001 | ||
| Positive HBsAg | –0.266 (–1.218 to 0.686) | .584 | ||
| Positive anti-HCV | –0.910 (–3.420 to 1.599) | .477 | ||
| Duration From Admission to First Negative RT-PCR of SARS-CoV-2 | ||||
| Univariate Analysis | Multivariable Analysis | |||
| Parameters | Coefficient (95% CI) | P Value | Adjusted Coefficient (95% CI) | P Value |
| ALT/AST elevation | 4.295 (3.831 to 4.759) | <.001 | 1.005 (0.601 to 1.409) | <.001 |
| Trough Ct value | –0.627 (–0.650 to –0.604) | <.001 | –0.546 (–0.569 to –0.524) | <.001 |
| Age | 0.096 (0.086 to 0.105) | <.001 | ||
| Male gender | 1.064 (0.705 to 1.423) | <.001 | ||
| Liver cirrhosis | 5.100 (3.293 to 6.908) | <.001 | 2.376 (0.936 to 3.815) | .001 |
| Diabetes mellitus | 4.479 (3.991 to 4.967) | <.001 | 0.538 (0.071 to 1.004) | .024 |
| Hypertension | 3.815 (3.400 to 4.229) | <.001 | 0.790 (0.403 to 1.176) | <.001 |
| Use of corticosteroids | 7.604 (7.133 to 8.075) | <.001 | 4.336 (3.831 to 4.841) | <.001 |
| Use of remdesivir | 4.851 (4.120 to 5.583) | <.001 | –1.254 (–1.907 to –0.602) | <.001 |
| Use of other antiviral agents for COVID-19 | 4.673 (4.320 to 5.026) | <.001 | 0.738 (0.407 to 1.068) | <.001 |
| Mechanical ventilation | 12.806 (11.479 to 14.133) | <.001 | 5.245 (4.085 to 6.404) | <.001 |
| Renal replacement | 9.241 (6.813 to 11.67) | <.001 | ||
| Positive HBsAg | –0.285 (–1.239 to 0.670) | .559 | ||
| Positive anti-HCV | –0.844 (–3.364 to 1.676) | .512 | ||
| Duration From Symptom Onset to First Negative RT-PCR of SARS-CoV-2 | ||||
| Univariate Analysis | Multivariable Analysis | |||
| Parameters | Coefficient (95% CI) | P Value | Adjusted Coefficient (95% CI) | P Value |
| ALT/AST elevation | 4.440 (3.916 to 4.963) | <.001 | 1.034 (0.544 to 1.523) | <.001 |
| Trough Ct value | –0.572 (–0.599 to –0.544) | <.001 | –0.478 (–0.505 to –0.450) | <.001 |
| Age | 0.104 (0.093 to 0.115) | <.001 | ||
| Male gender | 1.147 (0.743 to 1.551) | <.001 | ||
| Liver cirrhosis | 4.585 (2.551 to 6.618) | <.001 | 1.908 (0.166 to 3.649) | .032 |
| Diabetes mellitus | 4.624 (4.074 to 5.175) | <.001 | ||
| Hypertension | 4.125 (3.658 to 4.592) | <.001 | 1.241 (0.806 to 1.677) | <.001 |
| Use of corticosteroids | 7.826 (7.291 to 8.362) | <.001 | 4.572 (3.965 to 5.178) | <.001 |
| Use of remdesivir | 4.363 (3.537 to 5.189) | <.001 | –1.831 (–2.620 to –1.041) | <.001 |
| Use of other antiviral agents for COVID-19 | 5.040 (4.642 to 5.438) | <.001 | 1.302 (0.903 to 1.701) | <.001 |
| Mechanical ventilation | 13.789 (12.294 to 15.284) | <.001 | 6.350 (4.965 to 7.734) | <.001 |
| Renal replacement | 10.780 (8.050 to 13.510) | <.001 | ||
| Positive HBsAg | –0.106 (–1.148 to 0.936) | .842 | ||
| Positive anti-HCV | –0.815 (–3.549 to 1.918) | .559 | ||
ALT/AST elevation was defined by ALT and/or AST ≥2× the upper limit of normal at baseline or during follow-up. The upper limit of normal of ALT and AST was 40 U/L. ALT/AST elevation was forced into the multivariable model. Use of antiviral agents included the use of lopinavir-ritonavir, ribavirin, and/or interferon-beta. Negative RT-PCR of SARS-CoV-2 was indicated by a negative qualitative result or a quantitative Ct value ≥40.
Abbreviations: ALT, alanine aminotransferase; AST, aspartate aminotransferase; COVID-19, coronavirus disease 2019; Ct, cycle threshold; HBsAg, hepatitis B surface antigen; HCV, hepatitis C virus; RT-PCR, reverse transcription polymerase chain reaction; SARS-CoV-2, severe acute respiratory syndrome coronavirus 2.
From Hospital Admission to First Negative RT-PCR of SARS-CoV-2
Similarly, on univariate analysis, ALT/AST elevation, lower trough Ct value, older age, male gender, liver cirrhosis, DM, hypertension, and use of corticosteroids, remdesivir, and other antiviral agents for COVID-19 were associated with a longer duration from hospital admission to first negative RT-PCR of SARS-CoV-2 (Table 4). Again, ALT/AST elevation, lower trough Ct value, liver cirrhosis, DM, hypertension, use of corticosteroids and other antiviral agents, and mechanical ventilation were the independent risk factors on multivariable analysis; use of remdesivir was associated with a shorter duration from hospital admission to first negative RT-PCR of SARS-CoV-2.
From Symptom Onset to First Negative RT-PCR of SARS-CoV-2
The independent risk factors for longer duration from symptom onset to first negative RT-PCR of SARS-CoV-2 were ALT/AST elevation, lower trough Ct value, presence of liver cirrhosis, hypertension, use of corticosteroids, use of antiviral agents for COVID-19, and mechanical ventilation; use of remdesivir was associated with a shorter duration from symptom onset to first negative RT-PCR of SARS-CoV-2 (Table 4).
COVID-19 Therapies and Viremia
ALT/AST elevation was independently associated with lower trough Ct value of RT-PCR of SARS-CoV-2 by linear regression (adjusted coefficient, –0.76; 95% CI, –1.14 to –0.39; P < .001). Among the COVID-19 therapeutic regimens, use of remdesivir and use of interferon-beta (with or without lopinavir-ritonavir and/or ribavirin) combination therapy were associated with lower trough Ct value of RT-PCR of SARS-CoV-2 (Table 5), whereas use of corticosteroids was not associated with that. Among patient characteristics, older age and presence of liver cirrhosis were also associated with lower trough Ct value of RT-PCR of SARS-CoV-2 (Table 5).
Univariate and Multivariable Analysis by Linear Regression on Factors Associated With Trough Ct Value of RT-PCR of SARS-CoV-2 During COVID-19 Infection
| Univariate Analysis | Multivariable Analysis | |||
|---|---|---|---|---|
| Parameters | Coefficient (95% CI) | P Value | Adjusted Coefficient (95% CI) | P Value |
| ALT/AST elevation | –2.292 (–2.674 to –1.909) | <.001 | –0.764 (–1.141 to –0.387) | <.001 |
| Age | –0.079 (–0.087 to –0.072) | <.001 | –0.039 (–0.047 to –0.031) | <.001 |
| Male gender | –0.528 (–0.823 to –0.232) | <.001 | ||
| Liver cirrhosis | –3.358 (–4.740 to –1.976) | <.001 | –1.485 (–2.793 to –0.178) | .026 |
| Diabetes mellitus | –2.441 (–2.835 to –2.047) | <.001 | ||
| Hypertension | –2.439 (–2.776 to –2.101) | <.001 | ||
| Use of corticosteroids | –3.564 (–3.949 to –3.179) | <.001 | ||
| Use of remdesivir | –4.039 (–4.591 to –3.487) | <.001 | –2.460 (–3.005 to –1.914) | <.001 |
| Use of other antiviral agents for COVID-19 | –3.976 (–4.265 to –3.687) | <.001 | –3.077 (–3.389 to –2.765) | <.001 |
ALT and/or AST elevation was defined by ALT and/or AST ≥2× the upper limit of normal at baseline or during follow-up. The upper limit of normal of ALT and AST was 40 U/L. Other antiviral agents for COVID-19 included interferon-beta, lopinavir-ritonavir, and/or ribavirin.
Abbreviations: ALT, alanine aminotransferase; AST, aspartate aminotransferase; COVID-19, coronavirus disease 2019; Ct, cycle threshold; RT-PCR, reverse transcription polymerase chain reaction; SARS-CoV-2, severe acute respiratory syndrome coronavirus 2.
DISCUSSION
We are one of the first to report the serial Ct values of SARS-CoV-2 RNA and liver biochemistries of COVID-19 patients. From the trajectory of SARS-CoV-2 RNA, viral load likely has a role in the early phase of liver injury, as patients with ALT/AST elevation had lower Ct values during the first 20 days of hospitalization. Longer duration of viral persistence of SARS-CoV-2 is also linked to ALT/AST elevation. Presence of DM is consistently shown to be an important predictor of viral persistence of SARS-CoV-2 defined in different ways. Patients who used interferon-beta–containing regimens has a lower trough Ct value, that is, a higher viral load. This reflects our clinical practice of using COVID-19 therapies in patients with higher viral loads and possibly more symptomatic patients during the first few days after symptom onset.
Liver injury in COVID-19 is important because it is not only common but also prognostically important [3, 7, 30, 31]. Yet the exact underlying mechanisms of liver injury in COVID-19 patients remain obscured. Patients who have a more severe form of COVID-19 are at a higher risk of liver injury; the risk could be 2–3 times higher than in those with mild to moderate COVID-19 [32]. Yet, it is difficult to distinguish whether such liver injury is viral or immunologically driven. Based on our observation, it is biologically plausible that viral load and viral persistence may have a crucial role in COVID-19 patients with liver injury, particularly in the early days of infection. We observed a consistently lower Ct value in the first 10 days of COVID-19 in patients with liver injury, implying that SARS-CoV-2 might have caused direct damage to the liver in the early phase of COVID-19. Such differences were less consistent during the subsequent 10 days of SARS-CoV-2 infection, and there was essentially no difference from day 20 onward. This observation suggests that late-onset liver injury may be more related to immune-mediated pathways in the process of viral clearance. Another possibility is that persistence of high viral load might have resulted in other pathophysiological changes, which indirectly led to liver injury [33].
Ct value is commonly reported in COVID-19 patients at the time of diagnosis and during the recovery phase of COVID-19. Low Ct value is associated with virus growth in cell culture and hence infectivity [34]. Predictors of prolonged SARS-CoV-2 RNA shedding beyond 15 days from symptom onset, reflected by Ct value persistently <40, include male gender, delayed admission to the hospital after illness onset, and invasive mechanical ventilation [35]. Viral persistence may be as prolonged as long as 5 weeks after onset of symptoms [36]. Ct value is also helpful to decide the need for isolation, as a Ct value >34 together with resolved symptoms likely suggests lack of meaningful infectivity [37]. Hence some liver transplant experts proposed a less restrictive policy for liver transplantation in COVID-19 patients based upon Ct values [38].
Data supporting the prognostic role of Ct value are now evolving. A recent American study demonstrated a higher in-hospital mortality rate in COVID-19 patients with higher viral loads: rates of 38.8%, 24.1%, and 15.3% in patients with high, medium, and low viral loads, respectively [39]. The rate even reached 45.2% in patients with cancer and high viral loads. Patients with hematologic malignancies also had higher median viral loads (Ct, 25.0) compared with those without cancer (Ct, 29.2) [39]. This American study provides important insight on not only the prognostic role of SARS-CoV-2 viral load, but also the interaction between the virus and the immune system, as patients with cancers are often immunosuppressed, either because of the malignancies or the anticancer treatments. Hence Ct value may improve clinical management by providing early signals of deterioration and poor prognosis.
Corticosteroid therapy is a double-edged sword in COVID-19—it has been shown to improve survival in hypoxic COVID-19 patients, whereas it may also prolong SARS-CoV-2 persistence, as demonstrated by us and other groups [40]. A trend toward increased mortality has been demonstrated in patients who did not require oxygen therapy who were treated with corticosteroid therapy [41]. In our previous study, corticosteroid therapy was shown to be one of the risk factors of liver injury [3]. This may be due to either more severe COVID-19 or a longer duration of SARS-CoV-2 persistence.
The strength of our study is that it included a territory-wide cohort that covers 97.6% of all COVID-19 cases in Hong Kong. The majority (>95%) of these COVID-19 patients had Ct value results available. Data from real-life cohorts represent a wider spectrum of patients, such that the findings from real-life cohorts are thus more readily applicable to routine clinical practice. Chronic viral hepatitis, especially chronic hepatitis B, remains endemic in our region; close to 400 of patients had chronic hepatitis B (340), chronic hepatitis C (47), and liver cirrhosis (88). Yet we did not observe an increased risk of liver injury in COVID-19 patients with chronic viral hepatitis; possibly most of them had well-compensated liver function.
Nonetheless, our study has a few limitations. First, we were not able to include 696 out of 8318 (8.4%) COVID-19 patients because of missing ALT or Ct values. However, we believe such a relatively small proportion of missing COVID-19 subjects would not have major impacts on the findings. Second, missing laboratory measurement data might have led to biases, as in other retrospective studies, though these biases can partially be compensated for by our respectable cohort size. Some less common laboratory parameters, such as international normalized ratio, might not be checked for every single patient due to minor variations in clinical practice in different hospitals. Yet, missing data were rare for common laboratory parameters including ALT, total bilirubin, and creatinine, as those are regularly checked in routine clinical practice. Missing anti-HCV was found in 44% of COVID-19 patients. As the prevalence of HCV in Hong Kong is low (0.3%) [42], the impact on our findings would be tiny. Third, ascertainment bias may affect the reliability of the study due to inaccurate entry of certain diagnosis codes for comorbidities, namely DM, hypertension, and liver cirrhosis. We minimized this bias by including diagnosis, laboratory as well as medication data for DM, and hypertension. We also measured serum platelet counts and examined more definable ICD-9-CM codes for cirrhotic complications, which do not rely on a more accurate diagnosis of cirrhosis to identify the presence of cirrhosis. Patients who were first hospitalized because of COVID-19 may have had some of their comorbidities missed. We believe those would be minor comorbidities, as it is mandatory to enter diagnosis codes of major comorbidities even when patients are hospitalized for COVID-19. Furthermore, any medical conditions that warrant medical therapies, for example, hypertension or diabetes mellitus, would have medications dispensed during the hospital stay, and such information was also captured and used to define relevant comorbidities. Lastly, there is yet more direct evidence, namely PCR results or pathology of the liver, to further support direct viral injury by SARS-CoV-2 to the liver. A recent study that made use of electron microscopy to review liver histology demonstrated several virions within cytoplasmic vacuoles of cholangiocytes and in endothelial cells of hepatic sinusoids [43].
In conclusion, COVID-19 patients with liver injury have higher SARS-CoV-2 viral loads during the early phase of COVID-19, signifying a possible direct viral injury to the liver. Longer duration of viral persistence of SARS-CoV-2 may also contribute to liver injury. Immunosuppression, due to corticosteroid therapy or presence of DM, contributes to such viral persistence. Further studies to delineate the underlying mechanisms and interactions between SARS-CoV-2 and the immune system leading to liver injury would contribute to the prevention and management of liver injury in COVID-19 patients.
Supplementary Data
Supplementary materials are available at Open Forum Infectious Diseases online. Consisting of data provided by the authors to benefit the reader, the posted materials are not copyedited and are the sole responsibility of the authors, so questions or comments should be addressed to the corresponding author.
Acknowledgments
Financial support. This work was supported by the Health and Medical Research Fund of the Food and Health Bureau, the HKSAR Government (grant number COVID190105 and COVID1903002). The Centre for Health Systems and Policy Research is supported by the Tung Foundation.
Potential conflicts of interest. Grace Wong has served as an advisory committee member for Gilead Sciences and Janssen, as a speaker for Abbott, AbbVie, Bristol-Myers Squibb, Echosens, Furui, Gilead Sciences, Janssen, and Roche, and has received a research grant from Gilead Sciences. Terry Yip has served as an advisory committee member and a speaker for Gilead Sciences. Vincent Wong has served as an advisory committee member for 3V-BIO, AbbVie, Allergan, Boehringer Ingelheim, Echosens, Gilead Sciences, Intercept, Janssen, Novartis, Novo Nordisk, Perspectum Diagnostics, Pfizer, TARGET-NASH, and Terns and has served as a speaker for Bristol-Myers Squibb, Echosens, Gilead Sciences, and Merck. He has also received a research grant from Gilead Sciences. Henry Chan is an advisor for AbbVie, Aligos, Aptorum, Arbutus, Hepion, Janssen, Gilead, GSK, Merck, Roche, Vaccitech, VenatoRx, and Vir Biotechnology and has served as a speaker for Mylan, Gilead, and Roche. David Hui has served as an advisory committee member for Roche. S. S. Lee has served as a member of the advisory boards of Merck, GSK, and Gilead Sciences and has received grants and drug sponsorship from Gilead Sciences. Grace Lui has served as an advisory committee member for Gilead, Merck, Sanofi Pasteur, and GSK, has served as a speaker for Merck and Gilead, and has received a research grant from Gilead, Merck, Janssen, and GSK. The other authors declare that they have no competing interests. All authors have submitted the ICMJE Form for Disclosure of Potential Conflicts of Interest. Conflicts that the editors consider relevant to the content of the manuscript have been disclosed.
Author contributions. All authors were responsible for the study concept and design. Grace Wong, Terry Yip, Yee-Kit Tse, and Grace Lui were responsible for the acquisition and analysis of data, had full access to all of the data in the study, and take responsibility for the integrity of the data and the accuracy of the data analysis. All authors were responsible for the interpretation of the data and the drafting and critical revision of the manuscript for important intellectual content.
Patient consent. The patients’ written consent was waived by the Joint Chinese University of Hong Kong–New Territories East Cluster Clinical Research Ethics Committee. The design of the work was approved by the Joint Chinese University of Hong Kong–New Territories East Cluster Clinical Research Ethics Committee.
References
Author notes
Equal contribution


Comments