


Abstract
Serial severe acute respiratory syndrome coronavirus 2 (SARS-CoV-2) testing has been implemented at institutions of higher education (IHEs) and other settings. Testing strategies can include algorithms specifying confirmatory reverse-transcription polymerase chain reaction (RT-PCR) testing after an antigen test. It is unknown how testing strategies perform detecting SARS-CoV-2, including individual adherence to serial testing requirements.
Student serial testing adherence was defined as completing ≥80% of weekly tests from October 5, 2020 to November 14, 2020 and evaluated using logistic regression. Medical records were reviewed for all positive antigen test encounters and 10% of daily negative antigen test encounters during October 19–November 30, 2020. Results were used to estimate the proportion of individuals requiring only antigen tests, requiring and completing RT-PCR testing, and associated costs of tests.
Two thirds (66.5%; 1166 of 1754) of eligible on-campus students adhered to weekly testing; female students were more adherent (adjusted odds ratio [aOR], 2.07; 95% confidence interval, 1.66–2.59) than male students. Of all antigen test encounters, 11.5% (1409 of 12 305) reported >1 COVID-19 symptoms. Of non-COVID-19-exposed antigen test encounters, 88% (10 386 of 11 769) did not require confirmatory RT-PCR testing. Only 28% (390 of 1387) of testing encounters had an associated recommended confirmatory RT-PCR test performed. We estimated the testing strategy captured 61% (235 of 389) of predicted RT-PCR-positive specimens.
At this IHE, most students voluntarily adhered to serial testing. The majority of antigen test results did not require confirmatory RT-PCR testing, but when required, most students did not obtain it. Including strategies to increase the proportion of individuals obtaining indicated confirmatory testing might improve the testing program’s performance.
As of June 2021, severe acute respiratory syndrome coronavirus 2 (SARS-CoV-2), the virus that causes coronavirus disease 2019 (COVID-19), continues to be a public health concern with community transmission in the United States [1]. Public health officials have recommended preventive strategies to control the spread of COVID-19 including vaccination for COVID-19, physical distancing (6 feet), the use of face masks, and viral testing for SARS-CoV-2 [2]. Two types of viral tests—antigen and nucleic acid amplification tests ([NAATs] eg, reverse- transcription polymerase chain reaction [RT-PCR] test)—are used for the diagnosis, screening, and widespread surveillance of SARS-CoV-2 [3].
The US Food and Drug Administration has granted emergency use authorizations for several SARS-CoV-2 antigen tests [4]. These tests are relatively inexpensive and can report results in 15 minutes but typically have lower sensitivities and specificities compared with NAATs [5–9]. However, NAATs can detect noninfectious ribonucleic acid (RNA) after symptom resolution when an individual is no longer contagious [10], and they can have higher costs and longer turnaround times compared with antigen tests [6]. The Centers for Disease Control and Prevention (CDC) developed a SARS-CoV-2 testing algorithm to advise when confirmatory NAATs are recommended after antigen tests [5]. Confirmatory NAATs are recommended if an individual with COVID-19-like symptoms returns a negative antigen test or if an individual without symptoms returns a positive antigen test [5].
Many Institutions of Higher Education (IHEs) included SARS-CoV-2 testing strategies as part of their COVID-19 prevention plan, with some IHEs developing their own SARS-CoV-2 testing algorithm before the release of the CDC’s guidance in the Fall of 2020 [11, 12]. However, there is little evidence on the applied use and costs of SARS-CoV-2 testing algorithms [6, 13, 14]. In addition, although evidence suggests that university students comply with mask mandates, it is unknown whether students adhere to serial testing requirements [15]. This information is crucial to ensure optimal performance of testing strategies in preventing COVID-19 transmission.
In Fall 2020, a Wisconsin university developed a COVID-19 screening program that included a SARS-CoV-2 testing algorithm and mandatory serial SARS-CoV-2 testing of all on-campus students [5, 12]. In this study, we evaluate their use of serial SARS-CoV-2 testing during a period of relatively low COVID-19 transmission with the following aims: (1) determine on-campus student adherence to serial SARS-CoV-2 testing, (2) estimate how many students returned for confirmatory testing according to the testing algorithm, (3) estimate the number of RT-PCR-positive SARS-CoV-2 specimens captured by the testing algorithm, and (4) describe the costs of SARS-CoV-2 testing to the university using the applied and alternative testing strategies (eg, only antigen tests or RT-PCR tests).
METHODS
University Population
For Fall 2020, an estimated 9190 students were enrolled at the university, with 7903 (86%) undergraduates and 2187 (24%) students living on-campus in 8 dormitories (ie, Dorms A–H). At the university, all students signed a pledge at the beginning of the semester to wear masks when not sleeping, bathing, or eating; practice physical distancing; not congregate in groups; and partake in free serial coronavirus (COVID-19) testing. Course instruction was delivered in a mix of in-person, online, and hybrid classes. On-campus students lived in 8 dormitories for the semester with no restrictions on capacity.
University’s Severe Acute Respiratory Syndrome Coronavirus 2 Testing Strategy
On-campus students were required to be tested for SARS-CoV-2 every 2 weeks. Students living off-campus had no testing requirements. If any student was identified as a close contact to a person with COVID-19, they were required to quarantine either at home or in a quarantine-specific dormitory. Per CDC guidelines at the time, on-campus students within their first 90 days of their positive SARS-CoV-2 test results were excused from testing during that period [16]. Beginning September 30, 2020, the university revised its serial testing requirement from every 2 weeks to weekly.
Free SARS-CoV-2 testing was available to all university-affiliated students, faculty, and staff at an on-campus COVD-19 testing center beginning September 4, 2020. Individuals booked appointments up to 1 week in advance using a mobile phone application linked to their electronic health record where they reported demographics, COVID-19 symptoms, and any recent COVID-19 exposure.
Based on the university’s testing algorithm (Figure 1), the Sofia SARS Antigen Fluorescent Immunoassay (FIA) (Quidel Corporation) [17] was used initially for all individuals except those who reported an exposure to someone with COVID-19, who were tested with an RT-PCR test (Mako Medical) [18]. Individuals with COVID-19-like symptoms with a negative antigen test or individuals without symptoms with a positive antigen test were recommended for confirmatory RT-PCR testing. These individuals were contacted with their antigen test results and asked to return to the testing center for RT-PCR testing within 24 hours of their antigen test results. However, test type was only a recommendation, and individuals could request either an antigen test, an RT-PCR test, or both, based on their preference. The Sofia SARS Antigen FIA tests were analyzed on site by trained university staff with results returned to individuals the same day.
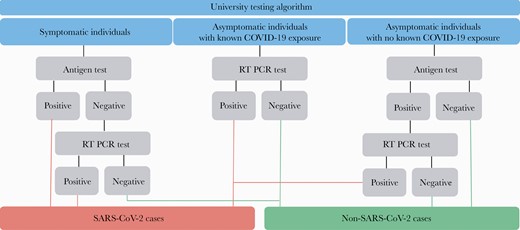
University’s severe acute respiratory syndrome coronavirus 2 (SARS-CoV-2) testing algorithm. COVID-19, coronavirus disease 2019; RT-PCR, reverse-transcription polymerase chain reaction test.
Statistical Methods
Serial Testing Adherence
We examined adherence of on-campus students to serial SARS-CoV-2 testing during October 5–November 12, 2020 and the university’s fall. Using daily antigen testing records and their fall 2020 on-campus housing list, we determined the number of on-campus students eligible for serial testing each week.
Weekly testing compliance was defined as the number of eligible students recording an antigen test each week divided by the total number of eligible students that week. We defined serial testing adherence as students recording an antigen test in greater than or equal to 80% of eligible weeks during the 6-week period. Results from RT-PCR tests administered without an accompanying antigen test could not be included because a standalone list of RT-PCR test results was unavailable. The associations between student characteristics and serial testing adherence were analyzed using univariable (t tests and χ 2 test) and multivariable logistic regression. In the adjusted model, we estimate adjusted odd ratios (aORs) with 95% confidence intervals (CIs) to examine the association between testing adherence and age, gender, race, ethnicity, and dormitory. The structure of the race and ethnicity questions were predetermined by the university.
Testing Algorithm Evaluation
To estimate the number of (1) antigen and confirmatory RT-PCR tests by symptom and exposure status and (2) the proportion of recommended confirmatory tests conducted, we extracted testing appointment data from individual’s electronic health records. Demographics, symptoms, exposure status at the time of test booking, and testing results (antigen test and RT-PCR, if done) were extracted for all positive antigen test encounters and a random sample of negative antigen test encounters that represented 10% of the daily total tests during October 19–November 30, 2020. The daily test totals included tests among all on-campus students, off-campus students, staff, and other personnel affiliated with the university at the testing center. A test encounter included information from the individual’s antigen testing appointment and confirmatory RT-PCR testing, if performed. Multiple test encounters per individual were included in the sample because this was a serially tested population.
Results were weighted to reflect the total number of antigen test encounters conducted over the 6-week period. The SARS-CoV-2 cases were defined according to the university’s testing algorithm (Figure 1). In addition, we examined the differences by using t tests for continuous outcomes and χ 2 tests for categorical outcomes in demographics and symptoms among test encounters from individuals who did and did not return for recommended confirmatory testing.
Using previously reported performance metrics (positive predictive values [PPVs] and negative predictive values [NPVs]) of the antigen test in this population [7], we estimated the number of expected RT-PCR-positive SARS-CoV-2 specimens under the assumption that all test encounters included a confirmatory RT-PCR test. We compared these results and their associated test costs with 3 other testing scenarios: (1) using antigen tests only, (2) the university’s testing algorithms with full confirmatory testing compliance, and (3) the university’s applied testing results. We then calculated the total cost of the SARS-CoV-2 tests to the university and the total cost under the various testing scenarios during the 6-week period. The RT-PCR tests were reported to cost $100 per test and antigen tests cost $23 per test. These costs included test materials and external provider’s laboratory labor for running and analyzing RT-PCR tests but excluded the labor to administer both tests and reading antigen test results.
Data were analyzed using R (version 4.0.2). Ninety-five percent CIs were calculated using the exact binomial method. These investigations were reviewed by the CDC, Wisconsin Division of Health Services and conducted consistent with applicable federal laws and CDC policy (45 C.F.R. part 46.102(l)2(2)). In addition, the university ethical review board determined the activities to be nonresearch public health surveillance.
RESULTS
Serial Testing Adherence
During October 5–November 12, a total of 11 670 antigen tests were conducted at the university’s testing center, including 8434 tests among on-campus students. On October 5, of 2187 students, 1754 (80.2%) remained eligible for serial COVID-19 testing at the university; 108 (4.9%) on-campus students were ineligible because they reported moving off-campus and 325 (14.9%) students were ineligible because they tested positive for SARS-CoV-2 within 90 days. Overall, 1368 (78%) eligible students recorded at least 1 antigen test during the 6-week period. Weekly compliance ranged from 70.5% to 80.6%.
Two thirds (66.5%) of eligible students adhered to the weekly testing requirement across the 6-week period (Table 1). Adherent students were more likely to be older, female, white, and non-Hispanic compared with nonadherent students (Figure 2). Females students had twice the odds (aOR, 2.07; 95% CI, 1.66–2.59) as male students to adhere after adjusting for age, gender, race, ethnicity, and dormitory. Compared with white students, Asian (aOR, 0.60; 95% CI, 0.37–1.00) and black (aOR, 0.37; 95% CI, 0.23–0.59) students had lower odds of adherence to serial COVID-19 testing. Students from Dorm B had the lowest adherence among the 8 dormitories.
Demographics of Adherent vs Nonadherent Studentsa to the University’s Serial COVID-19 Testing Program During October 5–November 12, 2020 (N = 1754)
| Adherent Studentsb (N = 1166) | Nonadherent Students (N = 588) | ||||
|---|---|---|---|---|---|
| Demographics | n | (%) | n | (%) | P Value |
| Age, years; median (range) | 19 | (18–28) | 19 | (18–25) | <.001 |
| Gender | <.001 | ||||
| Female | 780 | (67.0) | 298 | (50.8) | |
| Male | 385 | (33) | 279 | (47.5) | |
| Not reported | 1 | (0) | 10 | (1.7) | |
| Race | <.001 | ||||
| American Indiana or Alaskan Native | 5 | (0.4) | 4 | (0.7) | |
| Asian | 46 | (3.9) | 33 | (5.6) | |
| Black | 38 | (3.2) | 46 | (7.8) | |
| Native Hawaiian or other | 18 | (1.5) | 15 | (2.6) | |
| Pacific Islander | |||||
| White | 993 | (85.2) | 431 | (73.3) | |
| Other | 16 | (1.3) | 7 | (1.2) | |
| Not reported/declined to answer | 50 | (4.3) | 52 | (8.8) | |
| Ethnicity | <.001 | ||||
| Hispanic or Latino | 75 | (6.4) | 36 | (6.1) | |
| Not Hispanic or Latino | 989 | (84.8) | 449 | (76.4) | |
| Not reported/declined to answer | 102 | (8.8) | 103 | (17.5) | |
| Dormitory | <.001 | ||||
| Dorm A | 103 | (8.8) | 53 | (9.0) | |
| Dorm B | 94 | (8.1) | 78 | (13.3) | |
| Dorm C | 186 | (16.0) | 66 | (11.2) | |
| Dorm D | 132 | (11.3) | 60 | (10.2) | |
| Dorm E | 149 | (12.8) | 85 | (14.5) | |
| Dorm F | 180 | (15.4) | 111 | (18.9) | |
| Dorm G | 96 | (8.2) | 60 | (10.2) | |
| Dorm H | 226 | (19.4) | 75 | (12.7) |
Abbreviations: COVID-19, coronavirus disease 2019.
aEligible students for serial COVID-19 testing included those who did not have testing or housing exemption on October 5, 2020.
bAdherence was defined as students recording an antigen test in ≥80% of eligible weeks during the 6-week period.
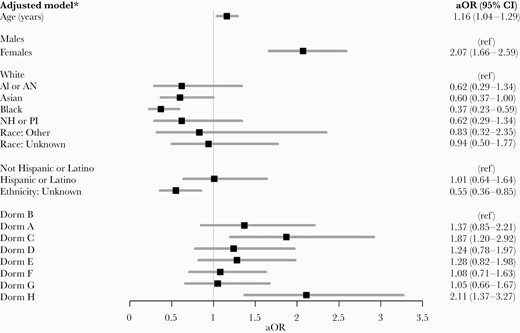
Student characteristics associated with adherence to serial coronavirus disease 2019 testing at the University, October 5–November 19, 2020. AI or AN, American Indiana or Alaskan Native; aOR, adjusted odds ratio; CI, confidence interval; NH or PI, Native Hawaiian or other Pacific Islander; ref, reference category.
Testing Algorithm Evaluation
During October 19–November 30, 2.6% (317 of 12 305) of antigen tests conducted at the University were positive and 97.4% (11 988 of 12 305) were negative for SARS-CoV-2 (Supplementary Figure 1). We reviewed medical records for 317 positive antigen test encounters and 1205 negative test encounters, which were weighted to represent the 12 305 antigen test encounters recorded during the 6-week period. An estimated 4.4% (95% CI, 4.0%–4.7%; 536 of 12 305) of antigen test encounters were among exposed individuals without symptoms. Because these individuals were recommended to only receive a RT-PCR test, we excluded them, leaving 11 769 tests (Figure 3). Demographics of testing encounters are presented in Table 2.
Descriptive Characteristics Reported at COVID-19 Test Encounters at University’s Testing Center During October 19–November 30, 2020 (N = 11 769)
| Demographicsa,b | n | (%) |
|---|---|---|
| Age (years); median (range) | 20 | (13–87) |
| Gender | ||
| Female | 7339 | (62.4) |
| Male | 4385 | (37.3) |
| Not reported | 41 | (0.3) |
| Race | ||
| American Indiana or Alaskan Native | 73 | (0.6) |
| Asian | 351 | (3.0) |
| Black | 466 | (4.0) |
| Native Hawaiian or other Pacific Islander | 61 | (0.5) |
| White | 10 070 | (85.6) |
| Other | 130 | (1.1) |
| Not reported/declined to answer | 614 | (5.2) |
| Ethnicity | ||
| Hispanic or Latino | 605 | (5.2) |
| Not Hispanic or Latino | 10 193 | (86.6) |
| Not reported/declined to answer | 967 | (8.2) |
| University Affiliation | ||
| Student | 10 957 | (93.1) |
| Staff | 613 | (5.2) |
| Unknown | 199 | (1.7) |
| Housing status | ||
| On-campus | 8272 | (70.3) |
| Off-campus | 3354 | (28.5) |
| Unknown | 141 | (1.2) |
| Congregate living setting | 7751 | (65.9) |
| Healthcare worker | 1203 | (10.2) |
| Symptom Status | ||
| Symptomatic | 1409 | (12.0) |
| Headache | 631 | (44.8) |
| Cough | 548 | (38.9) |
| Congestion | 447 | (31.7) |
| Sore throat | 390 | (27.7) |
| Muscle pain | 259 | (18.4) |
| Chills | 130 | (9.2) |
| Shortness of breath | 113 | (8.0) |
| Vomiting | 89 | (6.3) |
| Diarrhea | 76 | (5.4) |
| Loss of smell and/or taste | 51 | (3.6) |
| Fever | 49 | (3.5) |
| Difficulty breathing | 42 | (3.0) |
| Asymptomatic, unexposed | 10 360 | (88.0) |
Abbreviations: COVID-19, coronavirus disease 2019.
aDemographics do not represent unique individuals because most individuals presented for repeated testing.
bAll data were self-reported by the individual as they were scheduling their testing appointment.
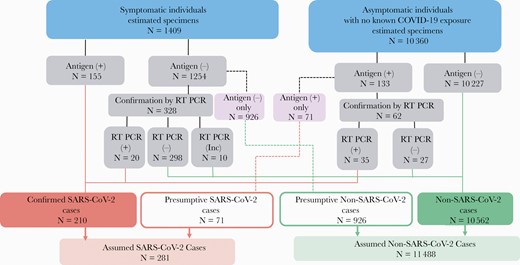
Estimated outcomes of the university’s testing algorithm for symptomatic and asymptomatic, unexposed test encounters, October 19–November 30, 2020. Pink boxes are tests that deviate from the university’s testing algorithm. These test encounters were recommended to receive a reverse-transcription polymerase chain reaction (RT-PCR) test but only had an antigen test recorded. Antigen (+), antigen test positive; Antigen (−), Antigen test negative; Inc, inconclusive; RT PCR (+), RT PCR test positive; RT PCR (−), RT PCR test negative; SARS-CoV-2, severe acute respiratory syndrome coronavirus 2.
Antigen Test Encounters With Coronavirus Disease 2019-Like Symptoms
In an estimated 12.0% (1409 of 11 769) of antigen test encounters (Figure 3), the individual tested reported 1 or more COVID-19-like symptoms. Overall, 155 antigen test encounters had a positive result from individuals with COVID-19-like symptoms. Only 1 individual had 2 symptomatic positive antigen test encounters, and all remaining positive antigen test encounters were among unique individuals. Among the 155 antigen test encounters reporting COVID-19-like symptoms, 60.0% were among females, 91.6% were among students, and 83.2% were among individuals who reported living off-campus. The most common symptoms reported were headache (54.2%), cough (51.6%), congestion (44.5%), and sore throat (40.0%).
An estimated 88.9% (95% CI, 87.3%–90.5%; 1254 of 1409) of antigen test encounters with COVID-19-like symptoms (Figure 3) were associated with a negative result and therefore confirmatory RT-PCR testing was recommended. However, 73.8% (95% CI, 71.3%–76.2%) of negative antigen test encounters with COVID-19-like symptoms did not have an associated confirmatory RT-PCR test result. Of these negative antigen test encounters that had an associated confirmatory RT-PCR test, an estimated 6.1% (20 of 328) of the RT-PCR tests were positive. For antigen test encounters with COVID-19-like symptoms that did have an associated confirmatory RT-PCR test, the individuals were more likely to report congestion (P = .03), diarrhea (P < .001), and living off-campus (P < .001).
Antigen Test Encounters Without Coronavirus Disease 2019-Like Symptoms
In antigen test encounters without symptoms, 132 unique encounters (one individual had two positive antigen tests encounters tests), representing 1.3% (95% CI, 1.1%–1.5%; 133 of 10 360) of the total test encounters, were positive for SARS-CoV-2 (Figure 3). However, 53.4% (71 of 133) of these encounters were not followed by a recommended confirmatory RT-PCR test. Encounters followed by a confirmatory test were more likely to be from older individuals (mean age, 22 vs 20 years; P < .001). No other demographic variables were associated with a confirmatory RT-PCR test being performed.
Estimated Number of Reverse-Transcription Polymerase Chain Reaction-Positive Severe Acute Respiratory Syndrome Coronavirus 2 Specimens Captured by the University
Using previously reported PPVs and NPVs for the Sofia SARS Antigen FIA from this population among individuals with and without COVID-19-like symptoms [7], we estimated that if all antigen test encounters had confirmatory RT-PCR testing, there would have been 389 RT-PCR positive SARS-CoV-2 specimens (Supplementary Figure 2A) during the 6-week period [7]. Comparing the university’s test data with the 389 predicted RT-PCR-positive SARS-CoV-2 specimens, the university captured 61% (235 of 389) (Supplementary Figure 2B) of predicted RT-PCR-positive specimens. If the university had complete follow-up testing among those asked to return for confirmatory RT-PCR testing, they would have captured all predicted RT-PCR- positive specimens except for the group of asymptomatic antigen-negative testing encounters or 68.6% (266 of 389) of the predicted RT-PCR-positive specimens. Using only antigen testing, the university would have captured 215 (55.6%) of the predicted RT-PCR-positive specimens (Supplementary Figure 2C).
Six-Week Cost of Severe Acute Respiratory Syndrome Coronavirus 2 Tests to the University
We estimated the total cost of the testing products plus RT-PCR laboratory costs to be $309 678 (Table 3), or $1318 per predicted RT-PCR-positive specimen during the 6-week period. If all encounters requiring confirmatory testing had this performed, it would cost an additional $99 700 for the additional 31 predicted RT-PCR-positive specimens, or $3216 per additional predicted RT-PCR-positive specimen. If both antigen and RT-PCR tests were performed at each encounter, this would have detected an additional 123 predicted RT-PCR-positive specimens (all from the group of asymptomatic antigen-negative testing encounters), at an additional estimated cost of $1 038 200 or $8441 per additional RT-PCR-positive specimen detected.
Cost Comparison Between Different Testing Strategies at the University, October 19– November 30, 2020
| Testing Scenarios | Antigen Testing Onlya,b | University Testing Applied Scenarioc | University Testing (100% Discordant Confirmatory Testing)d | All Test Encounters Receiving Antigen and RT-PCR Testinge |
|---|---|---|---|---|
| True cases (N)f | 215 | 235 | 266 | 389 |
| Total cost ($)g | 270 687 | 309 678 | 409 387 | 1 447 587 |
| Total cost difference ($) | – | 38 991 | 138 700 | 1 176 900 |
| Average cost per case ($) | 1259 | 1318 | 1539 | 3721 |
| Average cost per case difference ($) | – | 59 | 280 | 2462 |
| Additional “true” cases (eg, false- negative antigen tests; n) | – | 20 | 51 | 174 |
| Cost per additional case ($) | – | 1950 | 2720 | 6763 |
Abbreviations: RT-PCR, reverse-transcription polymerase chain reaction; $, amount rounded to the nearest dollar.
aDoes not follow university’s testing algorithm.
bAssumes all test encounters during the 6 weeks only received antigen tests only.
cTesting data provided by the university.
dTesting data provided by the university with the assumption that all discordant antigen testing results with symptom status (ie, test encounter with coronavirus disease 2019 [COVID]-19-like symptoms has a negative antigen test, unexposed test encounters with no COVID-19 symptoms has a positive antigen test) receive confirmatory RT-PCR testing.
eAssumes all test encounters have an antigen and RT-PCR test.
fUsing previously reported positive predictive values and negative predictive values for the Sophia SARS Antigen Fluorescent Immunoassay (FIA) [7] from this population among individuals with and without COVID-19-like symptoms, true cases were defined if the antigen test encounter would have been positive on confirmatory RT-PCR testing.
gTotal costs were calculated using the reported cost of the RT-PCR tests ($100 per test) and Sofia SARS Antigen FIA tests ($23 per test). These costs included test materials and external provider’s laboratory labor for running RT-PCR tests but excluded the labor to administer both tests and read antigen test results.
DISCUSSION
To prevent COVID-19 at IHEs, COVID-19 vaccination, serial testing, and prevention measures are recommended [14, 19, 20]. Previous COVID-19 surveillance techniques at IHE’s have included wastewater surveillance and pooled testing to monitor COVID-19 on campus, but none have investigated serial testing algorithms and student compliance [21, 22]. In our investigation, two thirds of eligible on-campus students adhered to the university’s serial testing requirement with female on-campus students being twice as likely as male on-campus students to adhere. Among antigen test encounters requiring confirmatory RT-PCR testing, an estimated 30% of testing encounters received confirmatory RT-PCR testing. Even with limited compliance for recommended confirmatory testing, we estimated that the university’s testing program captured 61% of predicted RT-PCR-positive SARS-CoV-2 specimens.
At IHEs, ensuring student compliance with COVID-19 prevention strategies is critical to reduce on-campus transmission. During our evaluation period, two thirds of eligible on-campus students adhered to serial antigen testing. Compliance did vary among students who identified as/were male, younger, and nonwhite as well as students from specific dormitories. Tailored public health campaigns might help increase compliance among these student groups.
The IHEs have multiple considerations when deciding whether and how to implement SARS-CoV-2 testing, including type of test and associated costs [5, 11]. Testing strategies can include antigen tests, RT-PCR tests, or both [20]. Given the 15-minute turnaround time of the antigen test, the university was able to isolate individuals positive for SARS-CoV-2 antigens and initiate contact tracing immediately. By comparison, if the university used only RT-PCR, this would have resulted in a 1- to 2-day lag in contact tracing initiation. Given the limited sensitivity and specificity of SARS-CoV-2 antigen tests, confirmatory testing with NAATs should be included by IHEs when feasible, for individuals with COVID-19-like symptoms or serial antigen testing performed every 3–7 days for 14 days [5].
The CDC recommends that confirmatory NAAT testing, if indicated, be performed within 48 hours of the antigen tests result [5]. However, we found that only 30% of test encounters had a confirmatory test performed when it was indicated. Because 90% of test encounters among individuals with COVID-19-like symptoms required confirmatory RT-PCR tests, collecting swabs for both antigen and RT-PCR tests when they present for their initial test could help increase compliance with confirmatory testing and increase detection of SARS-CoV-2. In addition, collecting swabs for both antigen and RT-PCR tests when individuals with COVID-19-like symptoms present for testing might also be appropriate for settings other than IHEs (eg, long-term care facilities [12], correction or detention facilities [23], secondary schools [24], and commercial settings [25]).
Using the previously reported PPVs and NPVs of the Sofia FIA test, we estimated that the university’s testing strategy would have captured 68% of 389 predicted RT-PCR SARS-CoV-2-positive specimens (confirmed cases) if all individuals received the recommended confirmatory testing. As RT-PCR can detect non-infectious RNA, the predicted RT-PCR-positive specimens from encounters among asymptomatic individuals might be from individuals who are outside of their infectious period [26]. However, in a prior investigation among this population, 5 of 9 individuals with negative antigen, RT-PCR-positive results were presymptomatic, suggesting that some negative antigen test results in testing encounters without COVID-19-like symptoms might represent missed opportunities to detect presymptomatic SARS-CoV-2 cases [26]. Because half of asymptomatic antigen-positive individuals did not seek confirmatory testing, further communication with these students may be warranted to ensure the antigen test was not a false positive and they were incorrectly quarantined.
To capture additional RT-PCR-positive specimens from presymptomatic individuals, we estimated this would cost an additional 1 million dollars during this 6-week period or $8441 per additional RT-PCR-positive specimen. Test cost will vary by setting depending on whether antigen and RT-PCR testing are run in-house or through an external provider. Other factors that will influence the costs of the setting’s SARS-CoV-2 testing include testing frequency, size of the tested population, and whether a testing algorithm is used.
This investigation was subject to several limitations. Because we did not account for repeated specimens from the same individual, we cannot approximate how many individuals tested positive with COVID-19. Each analysis represented only a 6-week window during a period of relatively low COVID-19 transmission at the university and might not accurately reflect testing habits of individuals during periods of increased transmission. In addition, results might not be generalizable to programs that follow alternative testing strategies. A list of all RT-PCR tests performed was unavailable, and the percentage of students adhering to the serial antigen testing program might be underestimated. Finally, the testing algorithm evaluation reflects antigen test encounters and not unique individuals because it included a serially tested population (on-campus students).
In addition, as the COVID-19 pandemic continues to evolve, the performance of testing algorithms will need to be continually investigated as specific SARS-CoV-2 variants (eg, Delta variant) become the predominate strain in the United States [27]. Further research will also be needed to determine how students at IHEs adhere to serial testing as requirements change or apply to specific groups (eg, unvaccinated students).
CONCLUSIONS
In conclusion, antigen testing at IHEs allows for rapid identification and investigation of COVID-19 cases to help prevent additional cases or a larger outbreak. On-campus students are likely to comply with serial antigen requirements at IHEs. Including an antigen testing algorithm can help allocate confirmatory NAAT testing to increase detection of COVID-19 cases while retaining the rapid turnaround time and low cost of antigen tests. Collecting swabs for both antigen and RT-PCR tests when individuals with COVID-19-like symptoms present for testing can be a strategy to reduce misclassified SARS-CoV-2 specimens.
Supplementary Data
Supplementary materials are available at Open Forum Infectious Diseases online. Consisting of data provided by the authors to benefit the reader, the posted materials are not copyedited and are the sole responsibility of the authors, so questions or comments should be addressed to the corresponding author.
Acknowledgments
We thank our partners: Allison B. Wojahn, Billie J. Bisick, Charlotte A. Embry, Daniel O’Donnell, Destiny S. Salazar, Haley E. Klinker, Jader J. Ramos, Lucellys Padilla, Luisa F. Ramos, Katheryn E. Bonk, Mary Lee Rositch, Rachel A. Mlejnek, Samantha Amory, Samantha R Boettcher, Stephanie L. Wiegman, and Zane J. Lind.
Disclaimer. The findings and conclusions in this report are those of the author(s) and do not necessarily represent the official position of the Centers for Disease Control and Prevention (CDC).
Financial support. This work was part of a public health investigation and was funded by the Centers for Disease Control and Prevention.
Potential conflicts of interest. All authors: No reported conflicts of interest. All authors have submitted the ICMJE Form for Disclosure of Potential Conflicts of Interest.


Comments