


Abstract
Serotype-specific urinary antigen detection (UAD) assay results can be used to estimate the serotype contribution among adults with pneumococcal community-acquired pneumonia (CAP) and to guide recommendations regarding higher-valency pneumococcal conjugate vaccines (PCVs).
Adults aged ≥18 years hospitalized with radiographic evidence of CAP were prospectively enrolled in 4 US cities from November 2019 to December 2020, overlapping the coronavirus disease 2019 (COVID-19) pandemic. Data were collected by patient interview and medical chart review. Streptococcus pneumoniae was isolated from standard-of-care respiratory samples and blood; urine collected per-protocol was tested by S pneumoniae BinaxNOW and UAD assays. The proportions of adults with radiologically confirmed CAP (RAD+ CAP) testing positive for S pneumoniae and for serotypes contained in PCV13, PCV15, and PCV20 were calculated.
Among 3098 adults enrolled, 2105 (67.9%) had RAD+ CAP. Of these, 44.3% were ≥65 years of age, and most had a chronic medical condition (46.0%) or were immunocompromised (38.5%). Streptococcus pneumoniae was detected by any method in 214 (10.2%) RAD+ CAP participants, including 63 (3.0%) with serotypes covered by PCV13, 81 (3.9%) by PCV15, and 119 (5.7%) by PCV20. Streptococcus pneumoniae and PCV serotype positivity were higher before the pandemic (November 2019–April 2020) compared to during the COVID-19 pandemic (May 2020–December 2020).
Our study demonstrated that despite the COVID-19 pandemic, PCV serotype pneumococcus continued to cause an important proportion of adult CAP in the US. These data are useful for informing PCV recommendations and for establishing an epidemiologic baseline to assess the impact of such recommendations.
Streptococcus pneumoniae serotype distribution analyses have focused on invasive pneumococcal disease. However, an increasing number of studies have investigated the serotype distribution of nonbacteremic pneumococcal community-acquired pneumonia (CAP) based on the development of serotype-specific urinary antigen detection (UAD) assays [1–3]. The UAD assays provide a research-based alternative to traditional microbiological methods, which typically require invasive collection of diagnostic specimens and a culturable organism. Pfizer has developed 2 serotype-specific UAD assays: The UAD-1 assay detects the serotypes included in the 13-valent pneumococcal conjugate vaccine (PCV13; serotypes 1, 3, 4, 5, 6A, 6B, 7F, 9V, 14, 18C, 19F, 19A, 23F), and the UAD-2 assay detects 11 additional serotypes (2, 8, 9N, 10A, 11A, 12F, 15B, 17F, 20, 22F, and 33F), which includes the serotypes beyond PCV13 that are in the higher-valency 15-valent pneumococcal conjugate vaccine (PCV15) (22F and 33F) and 20-valent pneumococcal conjugate vaccine (PCV20) (8, 10A, 11A, 12F, 15B, 22F, and 33F) [4, 5]. CAP pneumococcal serotype distribution, and vaccine efficacy or effectiveness against CAP, can inform public health policy of PCVs. For example, the United States (US) Advisory Committee on Immunization Practices (ACIP) used such data, in combination with evidence of PCV13 efficacy against CAP, to recommend PCV13 to all adults aged ≥65 years in 2014 [6, 7].
A prospective study of US adults hospitalized with radiologically confirmed community-acquired pneumonia (RAD+ CAP) from 2013 to 2016 used the Pfizer UAD assays and estimated that 4.6%, 5.9%, and 7.8% of all RAD+ CAP cases were attributed to the PCV13, PCV15, or PCV20 serotypes, respectively [8]. Because RAD+ CAP serotype epidemiology can shift after a longer period of PCV13 use in children and directly vaccinating adults with PCV13, we conducted a new study described herein to obtain contemporary serotype distribution estimates among US adults hospitalized with RAD+ CAP. Findings from this study informed the vaccine policy decisions made by the US ACIP in 2022 to recommend PCV20 and PCV15 for adults aged ≥65 years and for adults aged 19–64 years with certain medical conditions or risk factors [9].
METHODS
Study Design
This prospective, observational study with convenience sampling of adults aged ≥18 years hospitalized with RAD+ CAP enrolled participants between November 2019 and December 2020, which overlapped with the coronavirus disease 2019 (COVID-19) pandemic starting in March 2020. Eleven hospitals in 4 US cities (Louisville, Kentucky; Nashville, Tennessee; New Haven, Connecticut; and Chicago, Illinois) participated. The independent ethics committee or institutional review board at each hospital approved the study.
Participants
Adults who presented with signs, symptoms, and radiographic evidence of CAP were identified and screened for study inclusion. To be included, individuals had to (1) be ≥18 years of age; (2) be hospitalized in a participating hospital; (3) present with clinically suspected CAP based on the presence of 2 or more signs or symptoms: fever (or hypothermia) within 24 hours of enrollment, chills (or rigors), pleuritic chest pain, new or worsening cough, sputum production, dyspnea, tachypnea, malaise, or abnormal auscultatory findings suggestive of pneumonia; (4) have a radiographic finding that was consistent with pneumonia; (5) be willing and able to provide a urine sample; and (6) sign the informed consent document. Individuals were excluded if they (1) had hospital-acquired pneumonia (ie, pneumonia that developed ≥48 hours after admission at a participating hospital or another hospital) or (2) had been enrolled in the study within the past 30 days. Radiographic evidence consistent with pneumonia (ie, RAD+ CAP) included the presence of pleural effusion, increased pulmonary density due to infection, and the presence of alveolar infiltrates (multilobar, lobar, or segmental) containing air bronchograms. The determination of RAD+ CAP was made based on the radiologist's reading and interpretation of the chest image.
Participant demographics, medical history, pneumococcal vaccination history, Pneumonia Severity Index (PSI) score, risk group at the time of enrollment, hospitalization data (eg, hospital length of stay), and discharge disposition (eg, in-hospital death) were collected. Participants were followed up until hospital discharge or 10 days after enrollment, whichever was sooner.
Categories of Chronic Conditions
Patients were classified according to the presence of immunocompromising or chronic conditions or behavioral risk factors that are indicated by the US Centers for Disease Control and Prevention for pneumococcal vaccination (Supplementary Table 1) [9].
Laboratory Assessments
Specimens from the respiratory tract (eg, high-quality sputum) and from normally sterile sites (eg, blood, pleural fluid) were collected as part of standard-of-care practice and cultured at the local laboratory. Any S pneumoniae isolates were sent to a central laboratory (Baylor College of Medicine, Houston, Texas) for confirmatory testing and serotyping by Quellung reaction (Statens Serum Institut, Copenhagen, Denmark) [10]. Urine samples were collected and tested for S pneumoniae using the S pneumoniae BinaxNOW and both UAD assays (UAD-1 and UAD-2) at Pfizer's Vaccines Research and Development Laboratory (Pearl River, New York).
The serotype-specific Pfizer UAD assays detect 24 S pneumoniae polysaccharide antigens in a human urine sample and are based on Luminex bead technology [4, 5]. Thresholds for defining UAD assay positivity were set using nonparametric tolerance intervals to achieve at least 97% specificity per serotype based on 400 urine samples collected from healthy adults enrolled under a separate Pfizer protocol and from a similar period and geographic location as the adults with CAP, thresholds not set lower than those previously established by the Community-Acquired Pneumonia immunization Trial in Adults (CAPiTA) [4, 5].
Analysis
The analysis population included participants who met all eligibility criteria and had a final diagnosis of RAD+ CAP (Supplementary Table 2). Participants were classified as S pneumoniae positive if S pneumoniae was detected by culture, the UAD assays, or S pneumoniae BinaxNOW test.
We computed the proportion of participants with RAD+ CAP due to PCV serotypes. Participants were considered positive if a serotype was identified by UAD assays or Quellung of a cultured isolate. Due to cross-reactivity of the UAD assay, serotypes 6C and 15C are reported together with 6A and 15B, respectively. Results are presented overall and stratified by age group (18–49, 50–64, 18–64, ≥50, and ≥65 years), the presence of an indication for pneumococcal vaccination (Supplementary Table 1), and COVID-19 pandemic period (the prepandemic and pandemic periods: November 2019–April 2020 and May 2020–December 2020, respectively) (Figure 1). Serotype distribution stratified by the presence of conditions indicated for vaccination was also assessed for participants aged ≥50 years because ACIP had considered this age group for an age-based policy option for use of PCV20 and PCV15 [9]. Additionally, we summarized participant demographic and baseline medical characteristics, hospitalization characteristics, and disease severity indicators, with separate analyses stratified by S pneumoniae positivity or by PCV serotype groupings, and S pneumoniae positivity overall and by detection method.
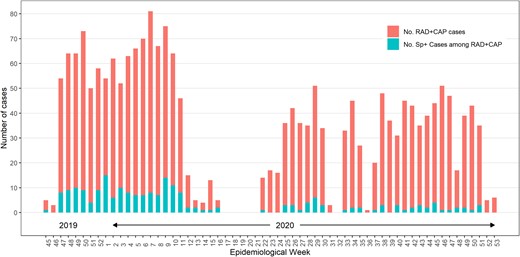
Frequency of Streptococcus pneumoniae detection (Sp+) by any method among participants with radiologically confirmed pneumonia (RAD+ CAP) by study week. The prepandemic period was defined as November 2019–April 2020 (week 16 of 2020 and before) and the pandemic period was defined as May 2020–December 2020 (week 22 of 2020 and after).
Categorical variables were described using frequencies and percentages, and continuous variables were described as mean (with standard deviation), median (with interquartile range [IQR]), and minimum and maximum values. Exact 95% confidence intervals (CIs) for proportions were calculated based on the Clopper-Pearson method [11]. Where appropriate, the P values were derived from median test or χ2 test.
Statistical analyses were conducted in SAS version 9.3 software (SAS Institute, Cary, North Carolina).
RESULTS
Participant Enrollment
We enrolled 3098 participants; 2105 (68.0%) were eligible for inclusion in the RAD+ CAP analysis population (Supplementary Table 2). Common reasons for exclusion are shown in Supplementary Table 2.
Participant enrollment began during November 2019 and was suspended for 5 weeks starting mid-April 2020 (week 17, 2020) due to the COVID-19 pandemic (Figure 1). Enrollment resumed in May 2020 (week 22, 2020); however, the number of enrolled RAD+ CAP cases each week during the pandemic period was lower than in the prepandemic period. Lower enrollment was due mainly to restricted access to patients because of COVID-19 infection control measures and an enrollment threshold (n ≤ 200 monthly) imposed on the study team in Louisville, Kentucky, the highest enrolling site, to allow for increased representation of RAD+ CAP cases by other sites. Enrollment by site is presented in Supplementary Table 3.
Baseline Characteristics and Medical History
Of the 2105 RAD+ CAP population participants, 44.3% were aged ≥65 years (Table 1). Most participants had at least 1 chronic medical condition or behavioral risk factor (46.0%) or immunocompromising condition (38.5%). The most common chronic medical condition or behavioral risk factor was chronic obstructive pulmonary disease (34.0%), followed by diabetes (30.8%) and tobacco smoking (27.6%); immunocompromising conditions included solid tumor (19.0%), immunosuppressant drug therapy (13.1%), and chronic kidney disease (12.8%).
Demographic and Baseline Medical Characteristics of Participants Hospitalized With Radiologically Confirmed Community-Acquired Pneumonia
| Characteristic | 18–64 Years (n = 1173) | ≥65 Years (n = 932) | Total (n = 2105) |
|---|---|---|---|
| Age at consent, y | |||
| Mean (SD) | 49.4 (11.2) | 75.4 (7.9) | 60.9 (16.3) |
| Minimum, maximum | 18, 64 | 65, 100 | 18, 100 |
| Sex | |||
| Female | 626 (53.4) | 492 (52.8) | 1118 (53.1) |
| Male | 547 (46.6) | 440 (47.2) | 987 (47.0) |
| Race | |||
| Black/African American | 336 (28.6) | 123 (13.2) | 459 (21.8) |
| American Indian/Alaska Native | 4 (0.3) | 0 (0) | 4 (0.2) |
| Asian | 3 (0.3) | 4 (0.4) | 7 (0.3) |
| Native Hawaiian/Other Pacific Islander | 0 (0) | 1 (0.1) | 1 (0.1) |
| White | 785 (66.9) | 787 (84.4) | 1572 (74.7) |
| Mixed race | 2 (0.2) | 0 (0) | 2 (0.1) |
| Not reported | 43 (3.7) | 17 (1.8) | 60 (2.9) |
| Ethnicity | |||
| Not Hispanic/Latino | 1046 (89.2) | 868 (93.1) | 1914 (90.9) |
| Hispanic/Latino | 39 (3.3) | 11 (1.2) | 50 (2.4) |
| Missing | 88 (7.5) | 53 (5.7) | 141 (6.7) |
| Type of condition | |||
| Immunocompromising condition | 341 (29.1) | 469 (50.3) | 810 (38.5) |
| Chronic medical condition or behavioral risk factor | 614 (52.3) | 354 (38.0) | 968 (46.0) |
| Neither of the above | 218 (18.6) | 109 (11.7) | 327 (15.5) |
| Immunocompromising conditiona | |||
| Immunodeficiency | 53 (4.5) | 37 (4.0) | 90 (4.3) |
| HIV | 38 (3.2) | 4 (0.4) | 42 (2.0) |
| AIDS | 20 (1.7) | 3 (0.3) | 23 (1.1) |
| Cancer/malignancy, solid tumor | 131 (11.2) | 268 (28.8) | 399 (19.0) |
| Cancer/malignancy, hematologic | 32 (2.7) | 63 (6.8) | 95 (4.5) |
| Chronic kidney disease | 98 (8.4) | 172 (18.5) | 270 (12.8) |
| Immunosuppressant drug therapy | 140 (11.9) | 136 (14.6) | 276 (13.1) |
| Organ transplantation | 18 (1.5) | 13 (1.4) | 31 (1.5) |
| Chronic medical condition or behavioral risk factora | |||
| COPD | 304 (25.9) | 412 (44.2) | 716 (34.0) |
| Asthma | 230 (19.6) | 115 (12.3) | 345 (16.4) |
| Chronic heart failure | 174 (14.8) | 232 (24.9) | 406 (19.3) |
| Coronary artery disease | 155 (13.2) | 274 (29.4) | 429 (20.4) |
| Diabetes | 315 (26.9) | 334 (35.8) | 649 (30.8) |
| Liver disease | 89 (7.6) | 44 (4.7) | 133 (6.3) |
| Current alcohol abuse | 107 (9.1) | 55 (5.9) | 162 (7.7) |
| Smoking | 417 (35.6) | 164 (17.6) | 581 (27.6) |
| Only 1 conditionb | 264 (22.5) | 130 (14.0) | 394 (18.7) |
| 2 conditionsb | 191 (16.3) | 107 (11.5) | 298 (14.2) |
| ≥3 conditionsb | 159 (13.6) | 117 (12.6) | 276 (13.1) |
| Other risk factors | |||
| Used antibiotics in the past 14 d | 202 (17.2) | 163 (17.5) | 365 (17.3) |
| Healthcare facility exposure in the past 3 mo | 537 (45.8) | 506 (54.3) | 1043 (49.6) |
| Weekly exposure to children aged <5 y | 31 (2.6) | 15 (1.6) | 46 (2.2) |
| Current drug abuse | 137 (11.7) | 14 (1.5) | 151 (7.2) |
Data are presented as No. (%) unless otherwise indicated.
Abbreviations: COPD, chronic obstructive pulmonary disease; HIV, human immunodeficiency virus; SD, standard deviation.
aConditions identified as immunocompromising or as chronic medical conditions or behavioral risk factors are those included by the US Advisory Committee on Immunization Practices for adult pneumococcal vaccine recommendations.
bExcludes immunocompromising conditions.
Disease Characteristics
Among all participants, 48% had a PSI risk class of IV or V, indicating severe disease (Table 2). Overall, the median hospital length of stay was 5 (IQR, 4–9) days; 22% of participants were admitted to the intensive care unit (ICU), the median ICU length of stay was 5 (IQR, 3–10) days, and 5.4% died in-hospital. PSI risk class IV or V was positively associated with detection of S pneumoniae among RAD+ CAP cases, whereas hospitalization characteristics did not predict positivity for S pneumoniae.
Disease Characteristics Among Participants Hospitalized With Radiologically Confirmed Community-Acquired Pneumonia Who Tested Positive or Negative for Streptococcus pneumoniae
| Characteristic | 18–64 Years | ≥65 Years | ≥18 Years | ||||
|---|---|---|---|---|---|---|---|
| S pneumoniae Positive (n = 136) | S pneumoniae Negative (n = 1037) | P Value | S pneumoniae Positive (n = 78) | S pneumoniae Negative (n = 854) | P Value | Total (n = 2105) | |
| Severity indicators | |||||||
| PSI, median (IQR) | 73 (53–103) | 65 (42–92) | .04 | 111 (94–138) | 107 (89–132) | .34 | 89 (61–114) |
| PSI grade IV or V | 48 (35.3) | 273 (26.3) | .03 | 64 (82.1) | 621 (72.2) | .07 | 1006 (47.8) |
| Systolic BP <90 mm Hg | 18 (13.2) | 69 (6.7) | .01 | 7 (9.0) | 61 (7.1) | .55 | 155 (7.4) |
| Diastolic BP ≤60 mm Hg | 57 (41.9) | 358 (34.5) | .09 | 46 (59.0) | 461 (54.0) | .40 | 922 (43.8) |
| Pulse rate >100 beats/min | 88 (64.7) | 579 (55.8) | .05 | 49 (62.8) | 341 (40.0) | <.0001 | 1057 (50.2) |
| SpO2 pulse oximetry ≤90% | 20 (14.7) | 206 (19.9) | .15 | 23 (29.5) | 201 (23.5) | .24 | 450 (21.4) |
| PaO2/FiO2 ratio <250 | 26 (19.1) | 165 (15.9) | .34 | 23 (29.5) | 180 (21.1) | .08 | 394 (18.7) |
| Hospitalization characteristics | |||||||
| Admitted to ICU/CCU | 32 (23.5) | 217 (20.9) | .49 | 18 (23.1) | 189 (22.1) | .85 | 456 (21.7) |
| Duration of hospitalization, d, median (IQR) | 5 (4–8) | 5 (3–9) | .91 | 7 (4–9) | 6 (4–9) | .17 | 5 (4–9) |
| Duration of ICU stay, d, median (IQR) | 4.5 (3–9.5) | 6 (3–11) | .26 | 5 (3–10) | 5 (3–10) | .89 | 5 (3–10) |
| Ventilation use, any type | 21 (15.4) | 183 (17.7) | .52 | 17 (21.8) | 175 (20.5) | .79 | 396 (18.8) |
| Duration of ventilation use, d, median (IQR) | 7 (4–9) | 5 (2–10) | .14 | 5 (2–7) | 4 (2–10) | .66 | 4 (2–10) |
| In-hospital death | 4 (2.9) | 42 (4.1) | .53 | 6 (7.7) | 61 (7.1) | .86 | 113 (5.4) |
Data are presented as No. (%) unless otherwise indicated.
Abbreviations: BP, blood pressure; ICU/CCU, intensive care unit/critical care unit; IQR, interquartile range; PaO2/FiO2, partial pressure of oxygen/fraction of inspired oxygen; PSI, Pneumonia Severity Index; SpO2, saturation of peripheral oxygen.
Streptococcus pneumoniae Detection
Streptococcus pneumoniae was detected in 214 of 2105 (10.2%) RAD+ CAP participants by any method (Table 3, Figure 1) including by UAD alone in 79 of 2105 (3.8%), by BinaxNOW alone in 45 of 2105 (2.1%), and by any culture alone in 15 of 2105 (0.7%) participants. Streptococcus pneumoniae was detected by all 3 detection methods in 14 of 2105 (0.7%) participants. Streptococcus pneumoniae detection was discordant by detection method for around 7% of participants (Supplementary Table 4); however, some discordance between the UAD assays and BinaxNOW and culture is likely attributed to differential serotype coverage of the assays (ie, the UAD assays detect only 24 of the known pneumococcal serotypes whereas BinaxNOW and culture each detect all serotypes). The proportion of RAD+ CAP cases with S pneumoniae identified during the COVID-19 pandemic was lower than that during the prepandemic period (5.6% vs 14.1%; Supplementary Table 5).
Streptococcus pneumoniae Identification by Diagnostic Method Among the Radiologically Confirmed Community-Acquired Pneumonia Population
| Diagnostic Method | No. | na (%) | 95% CI |
|---|---|---|---|
| Unique contribution to S pneumoniae positivity of each diagnostic methodb | |||
| 1: Positive by UAD alone | 2105 | 79 (3.8) | 3.0–4.7 |
| 2: Positive by BinaxNOW alone | 2105 | 45 (2.1) | 1.6–2.9 |
| 3: Positive by UAD and BinaxNOW | 2105 | 40 (1.9) | 1.4–2.6 |
| 4: Positive by culture alone | 2105 | 15 (0.7) | .4–1.2 |
| 5: Positive by BinaxNOW and culture | 2105 | 9 (0.4) | .2–.8 |
| 6: Positive by UAD and culture | 2105 | 12 (0.6) | .3–1.0 |
| 7: Positive by UAD and BinaxNOW and culture | 2105 | 14 (0.7) | .4–1.1 |
| Total S pneumoniae detection by diagnostic method | |||
| Any methodc | 2105 | 214 (10.2) | 8.9–11.5 |
| UADd | 1882 | 145 (7.7) | 6.5–9.0 |
| BinaxNOWe | 1883 | 108 (5.7) | 4.8–6.9 |
| Culturef | 1825 | 50 (2.7) | 2.0–3.6 |
The 3 diagnostic methods are UAD, culture, and BinaxNOW. 95% CIs were calculated using exact method (Clopper and Pearson) based on the observed proportion.
Abbreviations: CI, confidence interval; UAD, urinary antigen detection assay.
aNumber of participants in the radiologically confirmed community-acquired pneumonia population positive for S pneumoniae.
bItems 1–7 are mutually exclusive. No. = number of subjects with nonmissing results from at least 1 diagnostic method.
cNo. = number of subjects with nonmissing results for at least 1 diagnostic method. The count for n in this row is the total from items 1–7.
dNo. = number of subjects with nonmissing UAD results. The count for n in this row is the total from items 1, 3, 6, and 7.
eNo. = number of subjects with nonmissing BinaxNOW results. The count for n in this row is the total from items 2, 3, 5, and 7.
fNo. = number of subjects with nonmissing culture results. The count for n in this row is the total from items 4, 5, 6, and 7.
Serotype Contribution
PCV13, PCV15, and PCV20 serotypes were detected in 63 (3.0%), 81 (3.9%), and 119 (5.7%) of the 2105 total participants, respectively (Table 4). Across age and risk groups, the proportions of serotypes covered by PCVs were lower during the COVID-19 pandemic than in the prepandemic period (Supplementary Table 5). The most common serotypes were 3 (1.3%, n = 28) and 22F and 9N (0.9%, n = 18 each). Among 932 participants aged ≥65 years, PCV13, PCV15, and PCV20 serotypes were detected in 26 (2.8%), 34 (3.6%), and 43 (4.6%) participants, respectively; the corresponding values among 955 participants aged 18–64 years with an indication for vaccination were 33 (3.5%), 41 (4.3%), and 68 (7.1%), respectively (Table 4). Adults aged 50–64 years accounted for 32% (679/2105) of all RAD+ CAP cases versus 24% for 18–49 years and 44% for ≥65 years. Among 1611 adults aged ≥50 years, PCV15 serotypes were detected in 55 (3.4%) and PCV20 serotypes in 84 (5.2%). Among adults aged 50–64 years, serotype distribution was similar among those with or without an indication for vaccination (Table 4).
Distribution of Detected Pneumococcal Serotype, Identified by Urinary Antigen Detection Assay–2 or Culture by Age and Risk Groups of Participants Hospitalized With Radiologically Confirmed Community-Acquired Pneumonia
| Individual and Aggregate Detected PCV Serotypes | ≥18 Years (n = 2105) | 18–49 Years With an Indication for Vaccinationa (n = 363) | 18–64 Years With an Indication for Vaccinationa (n = 955) | ≥50 Years (n = 1611) | 50–64 Years With an Indication for Vaccinationa (n = 592) | 50–64 Years Without an Indication for Vaccinationa (n = 87) | ≥65 Years (n = 932) |
|---|---|---|---|---|---|---|---|
| PCV20 serotypesb | 119 (5.7) | 31 (8.5) | 68 (7.1) | 84 (5.2) | 37 (6.3) | 4 (4.6) | 43 (4.6) |
| PCV20 non-PCV15 serotypes | 40 (1.9) | 9 (2.5) | 28 (2.9) | 31 (1.9) | 19 (3.2) | 2 (2.3) | 10 (1.1) |
| PCV20 non-PCV13 serotypes | 59 (2.8) | 14 (3.9) | 36 (3.8) | 44 (2.7) | 22 (3.7) | 3 (3.5) | 19 (2.0) |
| 8 | 10 (0.5) | 4 (1.1) | 9 (0.9) | 6 (0.4) | 5 (0.8) | 0 (0) | 1 (0.1) |
| 10A | 11 (0.5) | 1 (0.3) | 7 (0.7) | 10 (0.6) | 6 (1.0) | 1 (1.1) | 3 (0.3) |
| 11A | 8 (0.4) | 1 (0.3) | 3 (0.3) | 7 (0.4) | 2 (0.3) | 1 (1.1) | 4 (0.4) |
| 12F | 6 (0.3) | 3 (0.8) | 5 (0.5) | 3 (0.2) | 2 (0.3) | 0 (0) | 1 (0.1) |
| 15B/15C | 5 (0.2) | 0 (0) | 4 (0.4) | 5 (0.3) | 4 (0.7) | 0 (0) | 1 (0.1) |
| 22F | 18 (0.9) | 3 (0.8) | 7 (0.7) | 14 (0.9) | 4 (0.7) | 1 (1.1) | 9 (1.0) |
| 33F | 2 (0.1) | 2 (0.6) | 2 (0.2) | 0 (0) | 0 (0) | 0 (0) | 0 (0) |
| PCV15 serotypesc | 81 (3.9) | 22 (6.1) | 41 (4.3) | 55 (3.4) | 19 (3.2) | 2 (2.3) | 34 (3.6) |
| PCV15 non-PCV13 serotypes | 20 (1.0) | 5 (1.4) | 9 (0.9) | 14 (0.9) | 4 (0.7) | 1 (1.1) | 9 (1.0) |
| PCV13 serotypesd | 63 (3.0) | 17 (4.7) | 33 (3.5) | 43 (2.7) | 16 (2.7) | 1 (1.1) | 26 (2.8) |
| PCV13 non-PCV7 serotypes | 53 (2.5) | 14 (3.9) | 30 (3.1) | 37 (2.3) | 16 (2.7) | 1 (1.1) | 20 (2.2) |
| PCV7 serotypese | 11 (0.5) | 3 (0.8) | 3 (0.3) | 7 (0.4) | 0 (0) | 0 (0) | 7 (0.8) |
| 1 | 1 (0.1) | 0 (0) | 1 (0.1) | 1 (0.1) | 1 (0.2) | 0 (0) | 0 (0) |
| 3 | 28 (1.3) | 8 (2.2) | 15 (1.6) | 18 (1.1) | 7 (1.2) | 0 (0) | 11 (1.2) |
| 5 | 4 (0.2) | 2 (0.6) | 2 (0.2) | 2 (0.1) | 0 (0) | 0 (0) | 2 (0.2) |
| 6A/6C | 1 (0.1) | 0 (0) | 0 (0) | 1 (0.1) | 0 (0) | 0 (0) | 1 (0.1) |
| 7F | 5 (0.2) | 0 (0) | 3 (0.3) | 5 (0.3) | 3 (0.5) | 0 (0) | 2 (0.2) |
| 19A | 15 (0.7) | 4 (1.1) | 10 (1.0) | 11 (0.7) | 6 (1.0) | 1 (1.1) | 4 (0.4) |
| UAD-2 serotypes not in PCV20 | 34 (1.6) | 5 (1.4) | 23 (2.4) | 27 (1.7) | 18 (3.0) | 2 (2.3) | 7 (0.8) |
| 2 | 0 (0) | 0 (0) | 0 (0) | 0 (0) | 0 (0) | 0 (0) | 0 (0) |
| 9N | 18 (0.9) | 3 (0.8) | 12 (1.3) | 15 (0.9) | 9 (1.5) | 1 (1.1) | 5 (0.5) |
| 17F | 5 (0.2) | 0 (0) | 3 (0.3) | 5 (0.3) | 3 (0.5) | 1 (1.1) | 1 (0.1) |
| 20 | 11 (0.5) | 2 (0.6) | 8 (0.8) | 7 (0.4) | 6 (1.0) | 0 (0) | 1 (0.1) |
Data are presented as No. (%). Because multiple serotypes could be identified from the same urine sample, serotype-specific proportions are not necessarily additive. Seven culture positive–only isolates were identified: 2 isolates of serotype 23A and 1 each for serotypes 7C, 15A, 16F, 31, and 35B.
Abbreviations: PCV7, 7-valent pneumococcal conjugate vaccine; PCV13, 13-valent pneumococcal conjugate vaccine; PCV15, 15-valent pneumococcal conjugate vaccine; PCV20, 20-valent pneumococcal conjugate vaccine; UAD-2, urinary antigen detection assay–2.
aIndications for adult pneumococcal vaccination include immunocompromising conditions, certain chronic medical conditions, and behavioral risk factors (Supplementary Table 1).
bPCV20 serotypes include PCV15 serotypes plus the PCV20 non-PCV15 serotypes 8, 10A, 11A, 12F, and 15B plus cross-reactive serotype 15C.
cPCV15 serotypes include PCV13 serotypes plus the PCV15 non-PCV13 serotypes 22F and 33F.
dPCV13 serotypes include PCV7 serotypes plus the PCV13 non-PCV7 serotypes 1, 3, 5, 6A, 7F, and 19A plus cross-reactive serotype 6C.
ePCV7 serotypes include 4, 6B, 9V, 14, 18C, 19F, and 23F.
Among 2105 participants, PCV13 serotypes and PCV20 non-PCV13 serotypes were detected in 63 (3.0%) and 59 (2.8%) participants, respectively. RAD+ CAP severity indicators and hospitalization characteristics were generally similar between these 2 groups, including the proportion of participants with PSI risk class IV or V (PCV13 serotypes: 55.6%; PCV20 non-PCV13 serotypes: 51%), median hospital length of stay (PCV13 serotypes: 6 days; PCV20 non-PCV13 serotypes: 5 days), and the proportion of participants admitted to the ICU (PCV13 serotypes: 17.5%; PCV20 non-PCV13 serotypes: 18.6%) (Table 5).
Demographic Characteristics and Hospitalization Details by Detected Pneumococcal Serotype Group Among Participants With Radiologically Confirmed Community-Acquired Pneumonia
| Characteristic | PCV13 Serotypes (n = 63) | PCV20 Non-PCV13 Serotypesa (n = 59) |
|---|---|---|
| Demographic characteristics | ||
| Age category, y | ||
| 18–49 | 20 (31.8) | 15 (25.4) |
| 50–64 | 17 (27.0) | 25 (42.4) |
| 65–74 | 15 (23.8) | 8 (13.6) |
| 75–84 | 6 (9.5) | 6 (10.2) |
| ≥85 | 5 (7.9) | 5 (8.5) |
| Sex | ||
| Female | 38 (60.3) | 31 (52.5) |
| Male | 25 (39.7) | 28 (47.5) |
| Severity indicators | ||
| PSI risk group IV or V | 35 (55.6) | 30 (50.9) |
| Systolic BP <90 mm Hg | 3 (4.8) | 10 (17.0) |
| Diastolic BP ≤60 mm Hg | 32 (50.8) | 29 (49.2) |
| Pulse rate >100 beats/min | 43 (68.3) | 34 (57.6) |
| SpO2 pulse oximetry ≤90% | 13 (20.6) | 13 (22.0) |
| PaO2/FiO2 ratio <250 | 17 (27.0) | 9 (15.3) |
| Hospitalization characteristics | ||
| Admitted to ICU/CCU | 11 (17.5) | 11 (18.6) |
| Duration of hospitalization, d, median (IQR) | 6 (4–10) | 5 (4–8) |
| Duration of ICU stay, d, median (IQR) | 7 (3–17) | 3 (3–10) |
| Ventilation use, any type | 10 (15.9) | 8 (13.6) |
| Duration of ventilation use, d, median (IQR) | 7 (5–14) | 6 (4–12) |
| In-hospital death | 4 (6.4) | 2 (3.4) |
Data are presented as No. (%) unless otherwise indicated.
Abbreviations: BP, blood pressure; ICU/CCU, intensive care unit/critical care unit; IQR, interquartile range; PaO2/FiO2, partial pressure of oxygen/fraction of inspired oxygen; PCV13, 13-valent pneumococcal conjugate vaccine; PCV20, 20-valent pneumococcal conjugate vaccine; PSI, Pneumonia Severity Index; SpO2, saturation of peripheral oxygen.
aPCV20 non-PCV13 serotypes include serotypes 8, 10A, 11A, 12F, 15B, 22F, and 33F plus cross-reactive serotype 15C.
DISCUSSION
Serotypes included in PCV20 and PCV15 accounted for 4.6% and 3.6% of RAD+ CAP in adults aged ≥65 years, and 7.1% and 4.3% of RAD+ CAP in adults aged 18–64 years with an indication for vaccination, respectively. PCV20, PCV15, and PCV13 serotype positivity were lower in the current study (5.7%, 3.9%, and 3.0%) than in the 2013–2016 study (7.8%, 5.9%, and 4.6%), respectively [8]. Several factors that explain this observation are as follows: (1) The latter half of the current study was conducted during the COVID-19 pandemic, and positivity in the pandemic period was lower than the prepandemic period for S pneumoniae (5.6% vs 14.1%, respectively) and PCV20 serotypes (3.2% vs 7.8%, respectively); (2) COVID-19 control measures may have dampened both seasonal virus activity and pneumococcal disease [12]; (3) adult PCV13 use that was started in 2014 with gradually increasing coverage may have reduced disease due to PCV13 serotypes [13]; and (4) PCV13 serotypes may have declined due to ongoing indirect protection from the pediatric PCV13 program [13].
During the current study and the one from 2013–2016, we hypothesize that the proportions of RAD+ CAP due to PCV serotypes may have been underestimated by the UAD assays. This hypothesis is supported by US adult PCV13 rate reduction estimates against all-cause CAP that are multiple fold higher than rate reductions for PCV13 against serotype-specific CAP (the latter based primarily on UAD-1 results) [14–16]. This hypothesis may be attributed to the current approach for defining UAD positivity, which is based on anchoring the UAD positivity thresholds to those from CAPiTA, a study done in the Netherlands with different underlying serotype distribution, different study population characteristics, different duration of pediatric PCV use, and no routine use of PCVs in adults. Delinking the UAD positivity thresholds from those established by CAPiTA may yield proportions of RAD+ CAP due to PCV serotypes more consistent with the estimated rate reductions observed for all-cause CAP. In the meantime, the current discordance emphasizes that existing methods and serotype-specific detection tests, including the UAD assays, underestimate true vaccine-preventable burden. Consequently, data from the current study and the one from 2013–2016 should be used primarily to assess relative serotype distribution rather than overall or vaccine-preventable disease burden.
This study also summarized the contribution of PCV13 serotypes, accounting for 2.8% of RAD+ CAP among adults ≥65 years and 3.5% of RAD+ CAP among adults 18–64 years with an indication for vaccination. Serotype 3, a PCV13 serotype, was the most common serotype. While direct effects of PCV13 against serotype 3 RAD+ CAP were demonstrated in the CAPiTA randomized controlled trial [17], serotype 3 RAD+ CAP may persist due to limited PCV13 impact against carriage, emerging clades that may have antibiotic resistance, and a shorter duration of protection against serotype 3 [18–20]. RAD+ CAP due to other PCV13 serotypes was observed, even though the US has had a long-standing pediatric PCV13 recommendation since 2010, with high population coverage (>90% in 2017–2018 with ≥3 doses) and recommendation for PCV13 vaccination of adults ≥65 years since 2014 and moderate population coverage (47% in 2018) [21]. Together this evidence suggests that relying solely on the indirect effects of pediatric vaccination is insufficient and increased PCV uptake in adults, particularly among those aged ≥65 years, may be necessary to further reduce vaccine serotype disease.
Higher-valency PCVs were recently recommended for US adults, including those who previously received PCV13 [22]. This recommendation is supported by the continuing occurrence of PCV13 serotype RAD+ CAP among adults despite a long-standing pediatric PCV13 program, the moderate proportion of RAD+ CAP due to the PCV20 non-PCV13 serotypes, and robust evidence that PCV13 can prevent 6.7%–10.0% of all-cause CAP in the context of pediatric PCV13 use [14–16]. The recommendation specifies that adults aged ≥65 years who were previously vaccinated with PCV13 should receive PCV20 one year later. Administering multiple doses of a PCV at the appropriate interval, with the 4-year interval demonstrating higher immune responses than 1 year, may increase duration of protection and provide protective immunity into older adulthood [23].
Higher-valency PCVs were considered but were not ultimately recommended for all adults aged ≥50 years, which is the age at which immunosenescence starts to accelerate [24]. Our data provide some support for this option since the proportions of RAD+ CAP due to PCV13 or PCV20 serotypes in this cohort (1.2% and 4.6%, respectively) were similar to the proportion for all adults ≥65 years and adults 50–64 years with an indication for vaccination. Additional data to consider will include age group–specific incidence of hospitalized CAP, case fatality ratios, illness severity, and impact of the CAP episode on subsequent health and quality of life. In clinical studies, immune responses to PCV13 were demonstrated to be higher among younger versus older adults [25]. Therefore, it may be useful to vaccinate persons before or early during immunosenescence rather than waiting until this state has advanced to a point when vaccine response may be more limited.
Our study has limitations beyond the likely low sensitivity of current diagnostic tests for identifying serotype-specific nonbacteremic pneumococcal RAD+ CAP. First, access to patients in the hospital during the COVID-19 pandemic was restricted because of infection control measures, in particular to patients with COVID-19, which led to enrollment that may have excluded severe RAD+ CAP cases. Second, nonpharmaceutical interventions and reduced seasonal respiratory virus activity may have contributed to lower occurrence of pneumococcal disease. Third, most participants were enrolled from the Louisville site. Thus, the patient population was not geographically distributed, possibly limiting the generalizability of the results. Fourth, this study enrolled a convenience sample of adults with CAP and therefore the enrolled population may be subject to selection bias.
This prospective, multicenter study provides useful estimates of pneumococcal serotype distribution in US adults hospitalized with RAD+ CAP. Our findings indicate that serotypes covered by PCV13, PCV15, and PCV20 continue to cause an important proportion of RAD+ CAP. More recent analysis among adults with RAD+ CAP has confirmed this for PCV15 and PCV20 serotypes based on another serotype-specific UAD assay [26]. Thus, direct vaccination of adults with higher-valency PCVs may likely prevent even more than the 6.7% to 10.0% reductions seen in all-cause CAP with PCV13 [14–16]. Our study provides further indirect evidence that the UAD assays may underestimate the magnitude of preventable disease burden, but remain useful for estimating serotype distribution of pneumococcal RAD+ CAP. Moreover, while pneumococcal RAD+ CAP declined during the pandemic, a resurgence of pneumococcal disease has been observed in several high-income countries after the discontinuation of COVID-19 lockdown measures and, in the US, disease incidence may now have returned to the same or higher levels than those observed prepandemic [27–29]. Future studies need to assess the effectiveness of PCV20 against vaccine serotype and all-cause CAP and collect additional data to inform the discussion of age-based vaccine recommendations for all persons ≥50 years of age.
Supplementary Data
Supplementary materials are available at Open Forum Infectious Diseases online. Consisting of data provided by the authors to benefit the reader, the posted materials are not copyedited and are the sole responsibility of the authors, so questions or comments should be addressed to the corresponding author.
Notes
Acknowledgments. The authors acknowledge the local research teams that were instrumental in the study's daily conduct. The authors also acknowledge Kimbal Ford for his integral role in identifying prospective sites to be included in this study. Medical writing support was provided by Qi Yan, PhD, MS (Pfizer Inc).
Financial support. This study was sponsored by Pfizer, Inc.
References
Author notes
Potential conflicts of interest. J. A. R. and R. C. have received research support from Pfizer and participate on a pneumococcal vaccine advisory board for Pfizer. J. R. has also served as a consultant for Pfizer. C. D. M. has received research support from the Sunnybrook Research Institute, Practice Plan of the Department of Emergency Services at Sunnybrook Health Sciences Centre, University of Toronto; National Institutes of Health (grant numbers R01H127215 and R21HL140381); and Veterans Affairs (grant number IIR-19-134). R. G. W. participated in a Clinical Evaluation Committee for an unrelated Pfizer antibiotic. R. A. H., M. A., S. L. G., E. L. C., A. D. C., R. E. I., M. W. P., L. J., B. D. G., and L. R. G. are employees of Pfizer and may own stock or stock options. C. S. D. C. reports no conflicts of interest.


Comments