


Abstract
Understanding the risk of hospitalization from severe acute respiratory syndrome coronavirus 2 (SARS-CoV-2) infections can guide effective public health interventions and severity assessments. This study calculated infection–hospitalization ratios (IHRs) and infection–case ratios (ICRs) to understand the relationship between SARS-CoV-2 infections, cases, and hospitalizations among different age groups during periods of Delta and Omicron variant predominance.
After calculating antinucleocapsid SARS-CoV-2 antibody seroprevalence using residual commercial laboratory serum specimens, 2 ratios were computed: (1) IHRs using coronavirus disease 2019 hospitalization data and (2) ICRs using Centers for Disease Control and Prevention surveillance data. Ratios were calculated across age groups (0–17, 18–49, 50–69, and ≥70 years) for 2 time periods (September–December 2021 [Delta] and December 2021–February 2022 [Omicron]).
Pediatric IHRs increased from 76.7 during Delta to 258.4 during Omicron. Adult IHRs ranged from 3.0 (≥70 years) to 21.6 (18–49 years) during Delta and from 10.0 (≥70 years) to 119.1 (18–49 years) during Omicron. The pediatric ICR was lower during the Delta period (2.7) compared with the Omicron period (3.7). Adult ICRs (Delta: 1.1 [18–49 years] to 2.1 [70+ years]; Omicron: 2.2 [>70+ years] to 2.9 [50–69 years]) were lower than pediatric ICRs during both time periods.
All age groups exhibited a lower proportion of infections associated with hospitalization in the Omicron period than the Delta period; the proportion of infections associated with hospitalization increased with each older age group. A lower proportion of SARS-CoV-2 infections were associated with reported cases in the Omicron period than in the Delta period among all age groups.
Despite considerable progress in treatment and prevention tools, severe acute respiratory syndrome coronavirus 2 (SARS-CoV-2) continues to pose a formidable public health challenge, as severe outcomes due to coronavirus disease 2019 (COVID-19) remain common. It is estimated that COVID-19 resulted in ∼1.2 million deaths and 6.8 million hospitalizations in the United States as of February 2024 [1].
Since the federal public health emergency expired in May 2023, COVID-19 case data collection has been discontinued by the Centers for Disease Control and Prevention (CDC) and many jurisdictions [2]. However, before then case reporting was often used as an estimate of the burden of COVID-19 even though it was known to underestimate infections due to both limited testing and limited reporting. Understanding how much cases underestimate infections will help us to better understand and interpret these data. Most calculations of the probability of hospitalization due to COVID-19 have also used case data, resulting in limited knowledge of the proportion of SARS-CoV-2 infections in the United States that are associated with hospitalization.
Seroprevalence studies offer a more sensitive assessment of the burden of SARS-CoV-2 because they can identify individuals who have developed antibodies in response to past infection regardless of whether the infection was diagnosed or reported. Prior studies estimating the SARS-CoV-2 infection–case ratios (ICRs) or infection–hospitalization ratios (IHRs) using seroprevalence data in the United States have been more limited than this analysis in that they have not been age-stratified [3], have excluded the pediatric age group [4], or have had limited geographic scope [5–8]. Analyses across larger populations and geographic areas are needed to obtain age group–specific ICRs and IHRs that include pediatric age groups and the Delta and Omicron periods. Our study addresses this need by estimating ICRs by predominant variant and age group, including the pediatric population, using seroprevalence data. This study also estimates IHRs by age group and predominant variant to better understand the risk of severe disease due to SARS-CoV-2 infection in the United States during periods of Delta and Omicron variant predominance. By examining these ratios across different age groups and time periods with different predominant variants, this study aimed to provide insights into the relationships between infection-induced antibody seroprevalence, COVID-19 case rates, and hospitalization rates, including variation by age group and time period.
METHODS
Calculation of SARS-CoV-2 Incidence Using Seroprevalence Data
Seroprevalence data were obtained from the Centers for Disease Control and Prevention (CDC) national commercial laboratory seroprevalence study [9], a repeated, cross-sectional, nationwide study that estimated the number of individuals with SARS-CoV-2 antibodies every 2 weeks from July 2020 to July 2021 and every 4 weeks from September 2021 to February 2022. In this analysis, the 6 consecutive rounds of monthly data collection from September 2021 to February 2022 were used. The study tested for antinucleocapsid (anti-N) antibodies on a convenience sample of blood specimens submitted for clinical testing in commercial laboratories and excluded specimens from individuals whose clinicians had specifically ordered testing for the presence of SARS-CoV-2 antibodies. Included specimens were drawn in all 50 US states, the District of Columbia, and Puerto Rico. Anti-N antibodies are produced in response to infection, but not in response to any of the COVID-19 vaccines authorized or approved for use in the United States at the time of data collection. Specimens were tested using the Roche Diagnostics Elecsys SARS-CoV-2 N Immunoassay, which has a sensitivity of 100% (95% CI, 88.3%–100.0%), a specificity of 99.8% (95% CI, 99.7%–99.9%), and high stability in antibody responses over time. Seropositivity was determined using the manufacturer-recommended cut-off index [10]. The median time to seroreversion (ie, returning to a seronegative status after infection) for this assay has been estimated to be 737 days after infection [11]. Prior studies have documented additional methodological details about this national commercial laboratory seroprevalence study [5, 12].
Based on data from CDC molecular surveillance [13], we defined the Delta variant–predominant period as September–mid-December 2021 and the subsequent Omicron variant–predominant period as mid-December 2021–February 2022. To estimate the number of cumulative infections at a specific time point, we multiplied the estimated proportion of a population that was seropositive with anti-N antibodies by the corresponding 2021 population estimate by the US Census Bureau [14]. For a given time period, the number of incident infections was computed as the difference in cumulative infection counts between the starting and ending dates of that period. Table 1, A and B, presents the cumulative infection counts on the starting and ending dates for the Delta and Omicron periods.
Infection–Case Ratio Analysis: Estimated Number of Cumulative Infections by Month and Age Group, September 20, 2021–January 21, 2022
| Median Date of Data Collection Month | Age Group | Estimated Cumulative No. of Infections | |||
|---|---|---|---|---|---|
| Sample Size | Point Estimate | Lower CI | Upper CI | ||
| 9/20/2021 | 0–17 y | 7632 | 15 495 385 | 14 891 142 | 16 107 104 |
| 18–49 y | 11 347 | 25 315 024 | 23 898 909 | 26 763 419 | |
| 50–69 y | 11 401 | 10 900 010 | 10 283 797 | 11 535 013 | |
| 70+ y | 7110 | 3 371 401 | 3 071 298 | 3 688 644 | |
| 12/8/2021 | 0–17 y | 8401 | 18 329 976 | 17 644 563 | 19 019 829 |
| 18–49 y | 14 173 | 27 555 083 | 26 389 595 | 28 738 160 | |
| 50–69 y | 14 793 | 12 789 620 | 12 234 595 | 13 356 209 | |
| 70+ y | 8828 | 4 081 426 | 3 812 718 | 4 360 642 | |
| 1/21/2022 | 0–17 y | 15 695 | 26 902 491 | 26 433 945 | 27 366 385 |
| 18–49 y | 20 042 | 43 170 761 | 42 244 052 | 44 094 643 | |
| 50–69 y | 21 912 | 19 012 290 | 18 542 729 | 19 484 685 | |
| 70+ y | 14 352 | 5 343 235 | 5 110 128 | 5 581 536 | |
Infection–Hospitalization Ratios Analysis: Estimated Number of Cumulative Infections by Month and Age Group, September 20, 2021–January 21, 2022
| Median Date of Data Collection Month | Age Group | Estimated Cumulative No. of Infections | |||
|---|---|---|---|---|---|
| Sample Size | Point Estimate | Lower CI | Upper CI | ||
| 9/22/2021 | 0–17 y | 13 384 | 28 233 072 | 27 496 093 | 28 975 539 |
| 18–49 y | 19 532 | 44 821 560 | 43 554 809 | 46 102 369 | |
| 50–69 y | 19 891 | 19 272 739 | 18 609 145 | 19 948 439 | |
| 70+ y | 12 162 | 5 828 294 | 5 493 402 | 6 175 372 | |
| 12/15/2021 | 0–17 y | 14 753 | 33 063 879 | 32 340 067 | 33 789 882 |
| 18–49 y | 23 566 | 50 205 825 | 49 042 389 | 51 377 952 | |
| 50–69 y | 24 687 | 22 264 486 | 21 624 886 | 22 912 867 | |
| 70+ y | 14 674 | 6 773 259 | 6 457 207 | 7 098 169 | |
| 2/14/2022 | 0–17 y | 11 298 | 54 688 598 | 53 900 414 | 55 460 944 |
| 18–49 y | 11 195 | 87 262 778 | 85 743 717 | 88 767 470 | |
| 50–69 y | 13 952 | 39 064 156 | 38 140 991 | 39 988 832 | |
| 70+ y | 9365 | 11 415 347 | 10 958 601 | 11 879 920 | |
In estimating the proportion of the population that was seropositive, we applied survey weights to adjust the demographic distributions of our sample to match those of the general US population. These weights were calculated for each 4-week data collection period using calibration techniques. Specifically, the weights were developed so that the sum of the weights aligned with the population distribution by gender, age, and urbanicity status.
COVID-19 Reported Cases
During the study period, individual-level US COVID-19 case data from the COVID-19 Case Report Form [15] and the National Notifiable Diseases Surveillance System [16] were analyzed, producing a national case count by age over time. Data quality criteria consistent with previous studies using the same data source [17] were applied to the calculation of reported cases. Reported cases encompass both laboratory-confirmed and probable reported cases. Confirmatory laboratory testing involves the detection of SARS-CoV-2 RNA using molecular amplification techniques; probable COVID-19 cases are defined based on a combination of clinical criteria, epidemiologic evidence, presumptive laboratory evidence (such as antigen or antibody detection), or vital records criteria, in the absence of confirmatory laboratory testing [18]. Jurisdictions were excluded from the analysis if <95% of individual case records included age information or if individual case reports from the jurisdiction totaled <85% of the jurisdiction's aggregate reported cases during the study period [1]; after applying these criteria, 32 states (Alaska, Arkansas, Arizona, California, Colorado, Delaware, Idaho, Illinois, Indiana, Kansas, Kentucky, Louisiana, Maine, Massachusetts, Minnesota, Missouri, Montana, North Dakota, New Hampshire, New Jersey, New Mexico, Nevada, Ohio, Oregon, Pennsylvania, South Carolina, Tennessee, Utah, Vermont, Virginia, Washington, and Wyoming) were included in the ICR analysis. Reported cases were calculated as the difference in cumulative case count estimates between the beginning and end dates of a time period. To align the case data with the seroprevalence data, we calculated the median date within each period and applied a 1-week lag to the seroprevalence estimates to account for the antibody development time [19].
COVID-19 Hospitalizations
Relevant COVID-19 hospitalization data were obtained from the Human Health Services (HHS) database [20]. The numbers of patients per week who were admitted and had laboratory-confirmed or suspected COVID-19 were reported by hospitals in the United States. Precise hospital-level weekly data were suppressed when a hospital reported between 1 and 3 COVID-19-positive hospitalizations during a given week; we imputed random numbers in this range (1–3) for the suppressed data. To align the data collection periods between the hospitalization data and the seroprevalence data, we applied a 3-day lag between antibody detection and hospitalization (ie, a 10-day lag between estimated exposure date and hospitalization) [21]. The final IHR analysis included COVID-19 hospitalization data from all 50 US states and the District of Columbia.
Statistical Analysis
We determined the ICRs and IHRs by dividing the estimated number of SARS-CoV-2 infections by the number of reported cases and hospitalizations, respectively. These calculations were performed for 4 age groups (0–17 years, 18–49 years, 50–69 years, and 70 years and older) and separately for the Delta and Omicron time periods. A supplemental analysis was conducted by Census region.
To estimate the number of infections, reported cases, and hospitalizations for each period, we calculated the differences in cumulative estimates between the start and end of periods corresponding to various transmission waves. For instance, during the Delta variant period, we estimated the number of infections by taking the difference between cumulative infection numbers from December 2021 and September 2021 data.
The 95% CIs for these ratios were derived using the standard errors of the seroprevalence estimates, considering the denominators (reported cases or hospitalizations) as constants. This approach accounted for variability in the seroprevalence estimates. We calculated the lower and upper CIs for the number of infections during a given time period by pooling the standard errors of the 2 cumulative infection estimates at the beginning and end of each time period [5]. To assess differences across age groups and time periods, we compared the 95% CIs of the ratios between the 2 groups. Nonoverlapping CIs between groups were considered to indicate a significant difference. While overlapping CIs do not necessarily indicate a nonsignificant difference, the extent of overlap can suggest the magnitude of the difference.
Second, seroprevalence for the Delta and Omicron periods (Figures 1 and 2, Tables 2 and 3) corresponds to the median dates of the monthly seroprevalence data collection periods, which are 6 consecutive rounds from September 2021 to February 2022. The ICR and IHR analyses employed slightly different reference dates due to 2 primary factors. First, the data scope differed between the 2 ratios. IHR calculations utilized national-level data, while ICR calculations were based on data from 32 states. Second, the rounds of data used for each ratio varied. For IHR, the Delta variant period spanned from round 1 (September 2021) to round 4 (December 2021), while the Omicron variant period covered rounds 4 (December 2021) to 6 (February 2022). The primary circulating Omicron variants during these months were B.1.1.529 and BA.1.1 [13]. The ICR analysis for the Omicron period combined data from rounds 5 and 6 as the end point. This combination was necessary to meet sample size requirements, as using only round 5 data would have resulted in a significantly smaller number of eligible jurisdictions.

Infection–case ratio by age group during the Delta and Omicron variant predominance periods, United States, September 2021–January 2022. ICRs represent the number of SARS-CoV-2 infections estimated from seroprevalence data divided by the number of reported COVID-19 cases. During the Delta period (September 20–December 8, 2021), ICRs ranged from 1.1 (18–49 years) to 2.7 (0–17 years). During the Omicron period (December 9, 2021–January 21, 2022), ICRs were higher across all age groups, ranging from 2.2 (≥70 years) to 3.7 (0–17 years). Error bars represent 95% CIs. Abbreviations: COVID-19, coronavirus disease 2019; ICR, infection–case ratio; SARS-CoV-2, severe acute respiratory syndrome coronavirus 2.
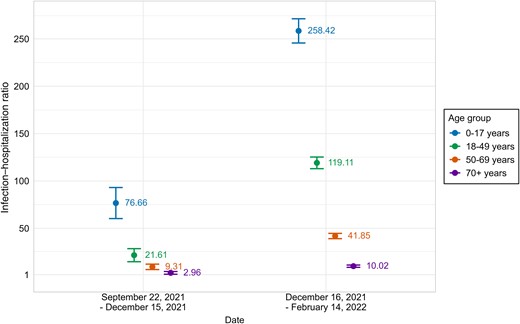
Infection–hospitalization ratio by age group during the Delta and Omicron variant predominance periods, United States, September 2021–February 2022. IHRs represent the number of SARS-CoV-2 infections estimated from seroprevalence data divided by the number of COVID-19 hospitalizations. During the Delta period (September 22–December 15, 2021), IHRs decreased with age from 3.0 (≥70 years) to 76.7 (0–17 years). During the Omicron period (December 16, 2021–February 14, 2022), IHRs were higher across all age groups but maintained the same pattern, ranging from 10.0 (≥70 years) to 258.4 (0–17 years). Higher IHRs indicate a lower probability of hospitalization following infection. Error bars represent 95% CIs. Abbreviations: COVID-19, coronavirus disease 2019; IHR, infection–hospitalization ratio; SARS-CoV-2, severe acute respiratory syndrome coronavirus 2.
Infection–Case Ratio by Age Group, September 20, 2021–January 21, 2022
| Variant Wave | Age Group | No. of Estimated Infections | Estimated Pooled SE | No. of Report Cases | Infection-to-Case Ratio (95% CI) |
|---|---|---|---|---|---|
| Delta period (September 20–December 8, 2021) | 0–17 y | 2 834 591 | 466 197 | 1 055 065 | 2.69 (1.82–3.55) |
| 18–49 y | 2 240 059 | 935 758 | 2 125 736 | 1.05 (0.19–1.92) | |
| 50–69 y | 1 889 610 | 423 130 | 942 016 | 2.01 (1.13–2.89) | |
| >70 y | 710 024 | 205 525 | 342 070 | 2.08 (0.90–3.25) | |
| Omicron period (December 9, 2021–January 21, 2022) | 0–17 y | 8 572 515 | 423 608 | 2 302 790 | 3.72 (3.36–4.08) |
| 18–49 y | 15 615 677 | 759 713 | 5 970 507 | 2.62 (2.37–2.86) | |
| 50–69 y | 6 222 670 | 370 929 | 2 117 982 | 2.94 (2.59–3.28) | |
| >70 y | 1 261 809 | 181 497 | 580 578 | 2.17 (1.56–2.79) |
Infection–Hospitalization Ratio by Age Group, September 22, 2021–February 14, 2022
| Variant Wave | Age Group | No. of Estimated Infections | Estimated Pooled SE | No. of Hospitalizations | Infection-to-Case Ratio (95% CI) |
|---|---|---|---|---|---|
| Delta period (September 22–December 15, 2021) | 0–17 y | 4 830 807 | 527 029 | 63 014 | 76.66 (60.27–93.06) |
| 18–49 y | 5 384 265 | 877 527 | 249 118 | 21.61 (14.71–28.52) | |
| 50–69 y | 2 991 746 | 470 232 | 321 375 | 9.31 (6.44–12.18) | |
| >70 y | 944 965 | 234 938 | 319 302 | 2.96 (1.52–4.40) | |
| Omicron period (December 16, 2021– February 14, 2022) | 0–17 y | 21 624 719 | 545 975 | 83 679 | 258.42 (245.64–271.21) |
| 18–49 y | 37 056 953 | 976 228 | 311 128 | 119.11 (112.96–125.26) | |
| 50–69 y | 16 799 670 | 573 003 | 401 394 | 41.85 (39.06–44.65) | |
| >70 y | 4 642 088 | 283 384 | 463 083 | 10.02 (8.82–11.22) |
Ethics
This activity was reviewed by the US Centers for Disease Control and Prevention (CDC) and was conducted consistent with applicable federal law and CDC policy (eg, 45 C.F.R. part 46; 21 C.F.R. part 56; 42 U.S.C. §241(d), 5 U.S.C. §552a, 44 U.S.C. §3501 et seq.).
RESULTS
Infection-to-Case Ratio by Age Group
During the Delta-predominant period, from September to mid-December 2021, the ICR estimates varied by age group (Figure 1, Table 2). The ratio was highest among children aged 0–17 years, at 2.7 (95% CI, 1.8–3.6; ie, for each reported case of COVID-19 there were ∼1.7 additional SARS-CoV-2 infections that did not result in a reported case). Adults aged 18–49 years had an ICR estimate of 1.1 (95% CI, 0.2–1.9), while the estimated ratio was 2.0 (95% CI, 1.1–2.9) for those aged 50–69 years and 2.1 (95% CI, 0.9–3.3) for individuals aged 70 years and older.
During the Omicron period, estimated ICRs were higher in all age groups compared with estimated ratios during the Delta period. Specifically, among children aged 0–17 years, the ICR estimate was 3.7 (95% CI, 3.4–4.1) during this period. Among adult age groups, the ICR estimate was 2.6 (95% CI, 2.4–2.9) for those aged 18–49 years, 2.9 (95% CI, 2.6–3.3) for those aged 50–69 years, and 2.2 (95% CI, 1.6–2.8) among those aged 70 years and older.
Infection-to-Hospitalization Ratio by Age Group
IHR estimates (Figure 2, Table 3) during the Delta period were highest among children compared with all other age groups, with a ratio of 76.7 (95% CI, 60.3–93.1; ie, for each person hospitalized who had COVID-19, there were 75.7 additional infections with SARS-CoV-2 that were not associated with a hospitalization). Among adults, the IHR estimate decreased with each group of increasing age: 21.6 (95% CI, 14.7–28.5) for those aged 18–49 years, 9.3 (95% CI, 6.4–12.2) among those aged 50–69 years, and 3.0 (95% CI, 1.5–4.4) for those aged ≥70 years.
All age groups had higher estimated IHRs during the Omicron period as compared with the Delta period. The IHR estimate during the Omicron period was highest for children, at 258.4 (95% CI, 245.6–271.2). Among adults, ratios decreased with each group of increasing age. For individuals aged 18–49 years, the infection–hospitalization ratio was estimated to be 119.1 (95% CI, 113.0–125.3) among persons aged 18–49 years, 41.9 (95% CI, 39.1–44.7) among those aged 50–69 years, and 10.0 (95% CI, 8.8–11.2) among those aged 70 years and older.
A supplemental analysis by Census region did not reveal any consistent regional ICR patterns (Supplementary Figure 1). During the Delta period, the South had the lowest IHR, while during the Omicron period IHRs for the Midwest and South were significantly lower than those for the West and Northeast (Supplementary Figure 2).
DISCUSSION
In this study, the estimated IHR for each age group was consistently higher during the Omicron period compared with the Delta period. This finding is consistent with other studies finding a higher overall likelihood of severe disease and hospitalization from infection with the Delta variant as compared with the Omicron variant [22–24]. One possible contributing factor to the decrease in disease severity during the Omicron period was the increased proportion of people who had been vaccinated against SARS-CoV-2, as the vaccines authorized by the Food and Drug Administration at the time of data collection were highly efficacious in preventing severe disease while less effective in preventing infection [25, 26].
During each variant predominant period, each incrementally older age group had a significantly lower IHR estimate (ie, a higher probability of hospitalization among those with SARS-CoV-2 infection) compared with all younger age groups. This decreasing IHR trend provides further evidence of the increased risk of severe COVID-19 disease with age [27]. Estimated IHRs by age group based on Canadian seroprevalence data also increased in groups of increasing age, starting with the group aged 10–19 years [28]. Canadian estimates for every age group showed lower hospitalization risk for infected individuals compared with our analysis, possibly due to substantially higher vaccination rates, which demonstrates the importance of calculating US-specific IHRs.
In our analysis, the youngest group (age 0–17 years) had the highest infection–hospitalization ratio estimates; in both time periods studied, the IHR estimate for the pediatric age group was more than twice as high as the estimated ratio of any adult age group. The lower probability of hospitalization among those with a SARS-CoV-2 infection in the pediatric age group is likely due to the milder presentation of COVID-19 among children as compared with adults [29, 30]. These data help quantify the lower risk of severe disease after SARS-CoV-2 infection in this age group and provide a better evidence base for pediatric risk assessment and infectious disease modeling. However, the high estimated IHRs in the pediatric age group should be interpreted with caution, as they may obscure effect modification by more granular age groups. For example, infants are at higher risk of severe disease due to COVID-19 compared with older children and young adults [31–34]. This is emphasized by the Canadian study [28], in which children aged 0–4 were the pediatric age group with the highest risk of hospitalization after infection based on seroprevalence data, followed by children aged 5–9 years, while the 10–19-year-old age group had the lowest risk of hospitalization after infection.
Like IHRs, the estimated ICRs observed across all age groups were higher during the Omicron period compared with the Delta period. A prior all-ages study using US seroprevalence data also observed that the estimated ICRs increased from 2.2 (95% CI, 2.0–2.5) during September to December 2021 to 3.1 (95% CI, 3.0–3.3) during January to February 2022 [3]. This change could be due to fewer infections being identified and reported as cases, potentially because the proportion of asymptomatic infections and those resulting in mild symptoms increased during the Omicron period [35]. Case reporting was also likely impacted by an increase in home testing during this period following the distribution of free home testing kits starting in January 2022 [36]. While increasing the accessibility of testing, this likely further contributed to the discrepancy in reported cases and infections because, unlike testing at a health facility, public health authorities were not typically notified of the results of at-home tests. Among those with COVID-19-like symptoms, at-home test use rose from 5.7% (95% CI, 5.2%–6.3%) during the Delta-dominant period to 20.1% (95% CI, 19.0%–21.2%) during the Omicron-dominant period [37]. The point estimates of ICR were higher in children as compared with adults in both the Delta and Omicron periods. Similarly, a previous seroprevalence study done in 8 states from August 2020 to May 2021 found that the ICRs among persons aged 0–17 years ranged from 4.7 to 8.9 compared with ICR estimates of 2.2–3.9 among all ages combined [5]. This finding is consistent with the higher frequency of mild or asymptomatic SARS-CoV-2 infection among children compared with adults. Regional shifts in ICR from the Delta period to the Omicron period likely reflect the differential impact of these variants, changes in public health measures, and evolving testing practices across different regions. Lower IHRs in the South and Midwest are likely due to lower vaccination rates in those regions, which left a larger proportion of the population at higher risk of severe disease from infection.
The study has several limitations. First, our study cannot detect reinfections, potentially leading to underestimated infection rates; this limitation was likely more pronounced during the Omicron period, when an increase in reinfections was observed across all age groups and protection against reinfection was decreased due to immune escape [38]. However, during the analytical time frame more than half of the US adult population had not yet been infected with SARS-CoV-2, and rapid rises in the rates of anti-N seropositivity indicate that there was still a large population experiencing primary infection. Second, seroprevalence may have been underestimated due to the study's exclusion of specimens from individuals whose clinicians had specifically ordered testing for the presence of SARS-CoV-2 antibodies or due to potential loss of seropositivity as a result of a variable rate of loss of reactivity. Third, some individuals could have developed anti-N antibody levels below the assay's limit of detection due to immunocompromising conditions; some studies have also suggested lower rates of anti-N seroconversion for infections within 2 months of COVID-19 vaccination [39]. These limitations could lead to underestimation of the number of infections, and therefore potentially underestimated ratios. Fourth, due the available case and hospitalization data, we were unable to examine more granular pediatric age categories, and the overall pediatric IHR and ICR likely obscure differential risks by pediatric age group. Other limitations include nonprobabilistic sampling, which can introduce bias in serosurveys. Seroprevalence testing was performed on residual clinical specimens, and therefore the sample is more likely to include specimens drawn from people with better access to or more frequent utilization of health care services. In addition, some hospitalizations that were included in our analysis may have been primarily caused by a condition unrelated to COVID-19, particularly in those typically at lower risk for COVID-19-related hospitalizations, including older children, adolescents, and young adults without preexisting medical conditions. Finally, the ICR analysis only included 32 states due to data quality considerations, limiting the generalizability of ICR findings.
In conclusion, this study highlights the use of seroprevalence data in understanding the evolution of the pandemic. In particular, IHRs in different time periods can give us a clearer picture of the severity of disease caused by SARS-CoV-2 infection both as the virus evolves and as underlying immunity evolves. The higher IHRs in the Omicron-dominant period compared with the Delta-dominant period for each age group are consistent with higher population immunity resulting from vaccination and previous SARS-CoV-2 infections during the later Omicron period. This study also quantifies the differential risk of hospitalization among infected individuals in the United States by age group; during both time periods studied, the ratio of infections to hospitalizations decreased with age. These differences underscore the importance of tailored preventive measures and health care support by age group. Additionally, the risk of severe disease following infection is a crucial data point to inform public health action and discussions between health care providers and patients regarding preventive measures and treatment options after infection. These findings contribute valuable insights into the transmission and clinical outcomes of SARS-CoV-2 in the United States, supporting evidence-based public health interventions and strategies.
Supplementary Data
Supplementary materials are available at Open Forum Infectious Diseases online. Consisting of data provided by the authors to benefit the reader, the posted materials are not copyedited and are the sole responsibility of the authors, so questions or comments should be addressed to the corresponding author.
Acknowledgments
The authorship group would like to recognize the important contributions of the following individuals to this work: Quest Laboratory colleagues, including William A. Meyer, Brooke E. Ethington, Dianna M. Tate, and Rebecca I. Parsons; LabCorp colleagues, including Marla Williams, Kelly Chun, and Christos Petropoulos; and Kristie Healey of ICF.
Disclaimer. The findings and conclusions in this report are those of the authors and do not necessarily represent the official position of the Centers for Disease Control and Prevention.
Patient consent. Informed consent was waived as data were de-identified and Health Insurance Portability and Accountability Act (HIPAA)–compliant.
Financial support. No external funding sources were used for this study.
References
Centers for Disease Control and Prevention. National Notifiable Diseases Surveillance System. Available at: https://www.cdc.gov/nndss. Accessed May 13, 2021.
Centers for Disease Control and Prevention. Coronavirus disease 2019 (COVID-19) 2021 case definition. Available at: https://ndc.services.cdc.gov/case-definitions/coronavirus-disease-2019-2021/. Accessed November 29, 2023.
HHS.gov. Coronavirus (COVID-19). Available at: https://www.hhs.gov/coronavirus/index.html. Accessed April 20, 2020.
The White House. Fact sheet: the Biden Administration to begin distributing at-home, rapid COVID-19 tests to Americans for free. Available at: https://www.whitehouse.gov/briefing-room/statements-releases/2022/01/14/fact-sheet-the-biden-administration-to-begin-distributing-at-home-rapid-covid-19-tests-to-americans-for-free/. Accessed January 14, 2022.
Author notes
Potential conflicts of interest. All authors: No reported conflicts.


Comments