


Abstract
Sepsis is a major cause of morbidity and mortality worldwide. When selecting empiric antibiotics for sepsis, clinicians are encouraged to use local resistance rates, but their impact on individual outcomes is unknown. Improved methods to predict outcomes are needed to optimize treatment selection and improve antibiotic stewardship.
We expanded on a previously developed theoretical model to estimate the excess risk of death in gram-negative bacilli (GNB) sepsis due to discordant antibiotics using 3 factors: the prevalence of GNB in sepsis, the rate of antibiotic resistance in GNB, and the mortality difference between discordant and concordant antibiotic treatments. We focused on ceftriaxone, cefepime, and meropenem as the anti-GNB treatment backbone in sepsis, pneumonia, and urinary tract infections. We analyzed both publicly available data and data from a large urban hospital.
Publicly available data were weighted toward culture-positive cases. Excess risk of death with discordant antibiotics was highest in septic shock and pneumonia. In septic shock, excess risk of death was 4.53% (95% confidence interval [CI], 4.04%–5.01%), 0.6% (95% CI, .55%–.66%), and 0.19% (95% CI, .16%–.21%) when considering resistance to ceftriaxone, cefepime, and meropenem, respectively. Results were similar in pneumonia. Local data, which included culture-negative cases, showed an excess risk of death in septic shock of 0.75% (95% CI, .57%–.93%) for treatment with discordant antibiotics in ceftriaxone-resistant infections and 0.18% (95% CI, .16%–.21%) for cefepime-resistant infections.
Estimating the excess risk of death for specific sepsis phenotypes in the context of local resistance rates, rather than relying on population resistance data, may be more informative in deciding empiric antibiotics in GNB infections.
Sepsis is defined as life-threatening organ dysfunction caused by a dysregulated host immune response to infection [1]. Sepsis causes an enormous global burden of disease and is a leading cause of in-hospital death [1, 2]. Numerous observational studies have shown that early initiation of appropriate antibiotics improves survival in septic shock [2–5]. An “appropriate” or concordant antibiotic is one to which the infectious organism is susceptible by in vitro testing. This contrasts with an “inappropriate,” or “discordant,” antibiotic, to which the infection organism is resistant. Empiric administration of antibiotics with too narrow of spectrum risks treatment failure by missing resistant pathogens, while use of unjustified broad-spectrum antibiotics is associated with increasing rates of antibiotic resistance worldwide and, as recently described, increased mortality [2, 6].
Empiric antibiotic selection, therefore, requires a clinician to make mental calculations that rely on local population data along with the clinician's gestalt about a patient's risk for specific bacteria and antibiotic resistance and an abundance of caution given the perception that choosing wrong could equate to survival versus death, yet be responsibly narrow as to not promote resistance. Local antibiotic resistance rates, extracted from antibiograms, are emphasized in current guidelines as essential to choosing the empiric antibiotics, and the nosocomial pneumonia guidelines go as far as recommending resistance thresholds past which double antibiotic coverage should be instituted if gram-negative bacilli (GNB) are suspected [1, 7]. Previous sepsis guidelines relied on a similar resistance threshold for suspected GNB infections, with the most current version advocating for empiric antibiotic based on the local resistance rates [1, 8]. Population resistance rates, however, give little insight into the actual risk of death in serious infections if discordant antibiotics are given.
For this study, we explored whether there is another way to choose empiric anti-GNB antibiotic regimen in serious infections. Using publicly available data from national databases and published manuscripts, we calculated the excess risk of death due to discordant antibiotics in sepsis, pneumonia, and severe urinary tract infections (UTIs), while considering GNB prevalence, local population resistance rates in GNB, and mortality with and without concordant treatment. We expand on a theoretical model previously used in community-acquired pneumonia (CAP) analyzing Streptococcus pneumoniae resistance thresholds to macrolides [9]. In our analysis, we replicated a clinician's approach by looking at using ceftriaxone as the preferred narrow empiric choice compared to broader-spectrum anti-pseudomonal β-lactams (ie, cefepime and meropenem). We show that community resistance thresholds are not the only, nor most important, consideration when choosing empiric antibiotics, but should be combined with knowledge of the type of infection and risk of mortality if a discordant antibiotic is selected.
METHODS
Theoretical Model
The excess risk of death from in infections caused by resistant bacteria can be calculated using 3 probabilities [9]: (1) the probability of a GNB causing the infection (vs gram positives, viruses, yeasts) (b); (2) the probability of the causative GNB being resistant to the empiric antibiotic (r); and (3) the difference between the risk of dying from receiving discordant antibiotics () minus the risk of dying from receiving concordant antibiotics (), or :
Probability of GNB Infection (b) With Antibiotic Resistance (r)
Rates of GNB infection and resistance to common antibiotics were obtained from 3 online databases: (1) Centers for Disease Control and Prevention (CDC) One Health Trust ResistanceMap [10]; (2) Sentry Antimicrobial Surveillance Public dataset [11]; and (3) CDC National Healthcare Safety Network (NHSN) [12]. Each database contains contemporary data on pathogens and resistance rates in the United States (US) using Clinical and Laboratory Standards Institute standards from the following years of data collection: OneHealth, 1999–2016; Sentry, 2013–2021; and NHSN, 2015–2017. All of these databases are catalogs of culture-positive infections. One Health Trust was the most limited in pathogen number and contained data on 9 common clinical pathogens (Acinetobacter baumannii, Enterobacter aerogenes/cloacae, Enterococcus faecium, Enterococcus faecalis, Escherichia coli, Klebsiella pneumoniae, Pseudomonas aeruginosa, Staphylococcus aureus, and S pneumoniae). To better compare across the 3 databases, only data on these 9 pathogens were manually extracted from each database from all available years for all calculations [10]. We obtained the proportion of GNB infections by dividing the number of infections from the 5 GNB species by total number of infections for all 9 bacterial species from each database:
We extracted data on resistance to ceftriaxone, cefepime, and meropenem. Pseudomonas aeruginosa and Acinetobacter spp were assumed to be 100% resistant to ceftriaxone due to high rates of intrinsic and inducible resistance. Enterobacter spp were considered 100% resistant to ceftriaxone given Infectious Diseases Society of America (IDSA) guidelines against the use of ceftriaxone for bacterial infections with high risk of inducible AmpC [13]. Resistance to carbapenems was assumed to be resistance to meropenem. The antibiotic resistance categories of “cephalosporins (third generation)” and “extended-spectrum cephalosporins” were considered to be resistance to ceftriaxone. Nonsusceptibility to either cefepime or ceftazidime was reported together and was assumed to be resistance to cefepime.
Local Database
Adult patients meeting the CDC adult sepsis criteria and admitted to any BJC Healthcare hospital between January 2017 and August 2021 were included [1, 14]. We collected culture results including bacterial species and antimicrobial susceptibility testing to calculate the prevalence of GNB infections among all patients with sepsis and the prevalence of antimicrobial resistance. Because inclusion criteria were based on CDC clinical sepsis criteria, not culture positivity, these data included both culture-positive and culture-negative sepsis cases.
Risk Difference of Death From Discordant Antibiotics (ΔD)
The excess risk of death from receiving discordant antibiotics was extracted from published articles and meta-analyses in accordance with Preferred Reporting Items for Systematic Reviews and Meta-Analyses (PRISMA) guidelines [15]. Publications were included if they contained data from the US or both the US and Canada. We chose to look at 3 classes of infection: sepsis, pneumonia, and severe UTIs. In our local dataset, we calculated in-hospital mortality for concordant and discordant antibiotics based on administration in the first 24 hours in infections caused by ceftriaxone- and cefepime-resistant GNB.
Separate PubMed searches were performed to look for relevant publications (Figure 1). In addition, 30 publications were screened for inclusion as direct email communications between the senior author (M. C. V. G.) and the first author (A. M. H.) (Figure 1). Furthermore, the primary references for the Society of Critical Care Medicine’s Surviving Sepsis Campaign were searched (Figure 1) [1]. Three primary references were identified and searched for additional references [16–18].
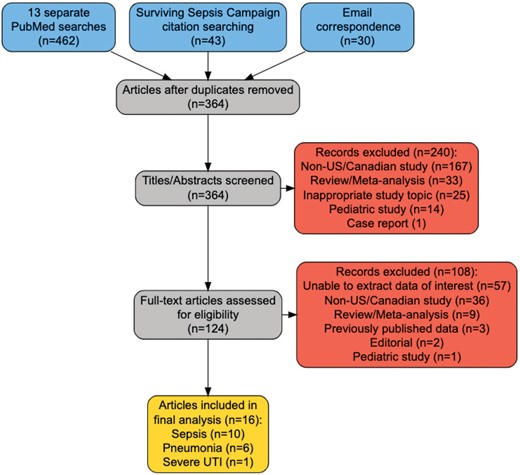
Preferred Reporting Items for Systematic Reviews and Meta-Analyses (PRISMA) diagram for publications related to mortality with concordant and discordant antibiotics in sepsis, pneumonia, and severe urinary tract infections. Numbers in the yellow box do not sum to 17, as one publication was found that was used in both the sepsis and pneumonia analysis. Abbreviations: US, United States; UTI, urinary tract infection.
PubMed searches were performed to find publications that had extractable data on mortality in GNB infections with concordant and discordant antibiotics. To best find these publications, searches were performed using the phrases “antibiotic,” “mortality,” “outcome,” “gram-negative,” and “United States,” along with 1 of the following infection specifiers: “concordant discordant antibiotics” or “appropriate inappropriate antibiotics,” plus a qualifier on type of infection: “sepsis,” “pneumonia,” or “urinary sepsis” (Figure 1). To best capture contemporary data with modern sepsis treatment practices, results were restricted to the last 20 years of articles between 1 January 2002 and the dates of project implementation, October 2022–May 2023. Studies were included if they reported original data on mortality for adults (≥18 years of age) in the US. The rate of mortality has been found to be similar across study types (randomized controlled trials vs cohort studies), so no weighting was applied for subsequent analyses [19].
Statistical Analyses
All data are reported as median with interquartile range (IQR). Excess risk of death and ranges from discordant antibiotics were calculated from the raw data using the medians and IQRs in Equation 1.
To generate an estimate of excess risk of death from a population with a normal distribution, simulations were performed by taking 100 random samples from the range of each variable—b, r, and , that is, —using a binomial distribution in R Studio using the expand.grid function (code available upon request). Contour plots were generated by multiplying the grids for each variable. Simulated data were then graphed on a contour plot to allow for 2-dimensional representation with r on the y-axis and on the x-axis. The third variable, b, on the z-axis, is not visible. Analyses and graphs were made in R and RStudio software (R Foundation for Statistical Computing, Vienna, Austria; https://www.R-project.org/; code available upon request).
RESULTS
Sepsis and Septic Shock
Probability of GNB Infection (b) and Antibiotic Resistance (r), All Cause
Across all culture-positive cases extracted from each database, the median rate of GNB infections was 55.52% (IQR, 55.25%–59.15%). The rate of ceftriaxone resistance was 45.40% (IQR, 34.75%–45.41%). The rates of cefepime and meropenem resistance were 6.94% (IQR, 5.68%–8.20%) and 2.14% (1.79%–3.70%), respectively (Table 1). Our local dataset, which included culture-negative sepsis, had a GNB prevalence of 14.7%, with 32% resistance to ceftriaxone and 19.3% resistance to cefepime.
Probability of Gram-Negative Bacilli Infection With Antibiotic Resistance
| Database | Rate of GNB, % | Resistance to CRO, % | Resistance to FEP, % | Resistance to MEM, % |
|---|---|---|---|---|
| OneHealth | 55.04 | 24.09 | … | 2.14 |
| Sentry | 55.52 | 45.40 | 4.41 | 5.26 |
| NHSN | 62.77 | 45.42 | 9.47 | 1.45 |
| Median (IQR) | 55.52 (55.25–59.15) | 45.40 (34.75–45.41) | 6.94 (5.68–8.20) | 2.14 (1.79–3.70) |
Abbreviations: CRO, ceftriaxone; FEP, cefepime; GNB, gram-negative bacilli; IQR, interquartile range; MEM, meropenem; NHSN, National Healthcare Safety Network.
Risk Difference of Death From Discordant Antibiotics (ΔD)
Ten studies reported mortality with concordant and discordant antibiotics in sepsis [20–29] (Figure 1, Supplementary Table 1). Disease severity varied across studies and could be separated into (1) sepsis plus septic shock or sepsis only/septic shock only, and (2) bacteremia with or without sepsis/septic shock. All studies, except 1, included only culture-positive cases [24]. Four studies considered only gram-negative pathogens [20, 22, 26, 29], while the other 6 studies looked at all-cause infection without separating the data by pathogen type [21, 23–25, 27, 28]. All studies defined discordant antibiotics as given within 24–48 hours from culture or, in the single study including culture-negative cases [24], those meeting sepsis criteria who did not receive any antibiotics within 24 hours.
The median risk of death with concordant antibiotics was 17.57% (IQR, 12.45%–27.87%) and with discordant antibiotics was 24% (IQR, 16.42%–41.8%), with a median risk difference of 6.43% (Supplementary Table 1). Separating studies by disease severity, the largest difference in mortality was seen in studies that included sepsis plus septic shock or septic shock only (Supplementary Table 1, rows 1–6). In these studies, the risk of death with concordant antibiotics was 23.8% (IQR, 18.76%–32.26%) and with discordant antibiotics was 41.8% (IQR, 26.33%–51.07%), with a median risk difference of 18%. In the 3 bacteremia studies, the median risk difference was 4.15% (Supplementary Table 1, rows 10–12). There was no risk difference in the 2 studies that reported sepsis only without shock (Supplementary Table 1, rows 16–17).
Excess Risk of Death in Sepsis and Septic Shock
The excess risk difference of death, focusing on studies including sepsis plus septic shock/septic shock only, was calculated using Equation 1. The difference was highest for ceftriaxone resistance, with a median of 4.5% (IQR, 1.5%–5.1%). The difference with cefepime resistance was 0.7% (IQR, 0.2%–0.9%) and for meropenem resistance was 0.1% (IQR, 0.02%–0.7%).
Binomial distributions were generated around the median of b (risk of GNB), r (risk of resistance), and (risk difference of mortality between discordant and concordant antibiotics) for each antibiotic (Figure 2A–C). Median excess risk of death in sepsis plus septic shock/septic shock only caused by antibiotic-resistant isolates when treated with ceftriaxone was 4.53% (95% confidence interval [CI], 4.04%–5.01%), 0.6% (95% CI, .55%–.66%) for cefepime, and 0.19% (95% CI, .16%–.21%) for meropenem. Binomial distributions generated with our local BJC data, which included culture-negative cases, had a median risk difference of 0.75% (95% CI, .57%–.93%) for treatment with discordant antibiotics in ceftriaxone-resistant infections and 0.18% (95% CI, .16%–.21%) for cefepime-resistant infections (Figure 3A and 3B).
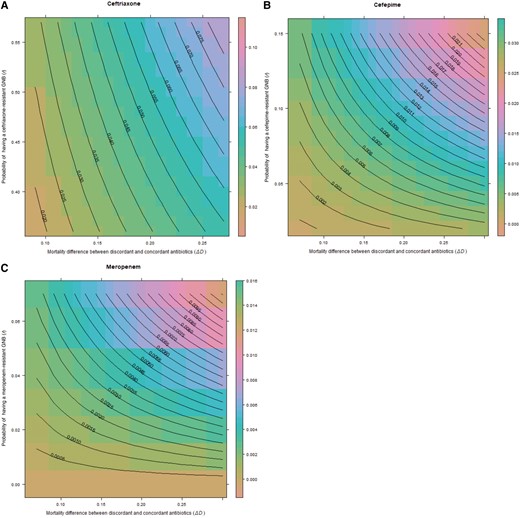
Excess risk of death with discordant antibiotics in sepsis plus septic shock/septic shock only for ceftriaxone (A), cefepime (B), and meropenem (C). Central lines on the contour plot represent excess risk of death at the intersection of the 3 terms of the equation for prevalence of gram-negative bacilli (GNB), rate of resistance, and difference in mortality between discordant and concordant antibiotics. For all contour graphs, the y-axis displays the probability of antibiotic resistance (r), while the x-axis displays the excess risk of death with discordant antibiotics, . The z-axis representing probability of GNB infection (b) is not displayed in 2-dimensional space. Note that axis scales are different for each antibiotic.
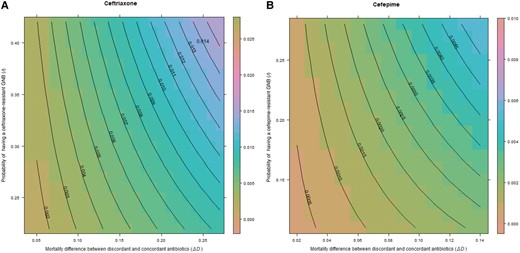
Excess risk of death with discordant antibiotics in septic shock for ceftriaxone (A) and cefepime (B) in a retrospective cohort of 50 117 patients admitted to any BJC Healthcare hospital who met the Centers for Disease Control and Prevention adult sepsis event criteria between January 2017 and August 2021. Central lines on the contour plot represent individual excess risk of death at the intersection of the 3 terms of the equation for prevalence of gram-negative bacilli (GNB), rate of resistance, and excess risk of death. For all contour graphs, the y-axis displays the probability of antibiotic resistance (r), while the x-axis displays the excess risk of death with discordant antibiotics, . The z-axis representing probability of GNB infection (b) is not displayed in 2-dimensional space. Note that axis scales are different for each antibiotic.
Pneumonia
Probability of GNB Infection (b) and Antibiotic Resistance (r)
Pneumonia-specific data were only available from the NHSN and Sentry. The median rate of GNB infections was 52.87% (IQR, 50.72%–55.02%) with ceftriaxone resistance at 69.61% (IQR, 68.81%–70.42%), cefepime resistance at 11.18% (IQR, 10.72%–11.65%), and meropenem resistance at 7.4% (IQR, 5.06%–9.74%) (Table 2).
Probability of Gram-Negative Bacilli Infection With Antibiotic Resistance in Pneumonia
| Database | Rate of GNB, % | Resistance to CRO, % | Resistance to FEP, % | Resistance to MEM, % |
|---|---|---|---|---|
| Sentry | 48.57 | 71.42 | 10.25 | 12.08 |
| NHSN | 57.17 | 68.01 | 12.12 | 2.72 |
| Median (IQR) | 52.87 (50.72–55.02) | 69.61 (68.81–70.42) | 11.18 (10.72–11.65) | 7.40 (5.06–9.74) |
Abbreviations: CRO, ceftriaxone; FEP, cefepime; GNB, gram-negative bacilli; IQR, interquartile range; MEM, meropenem; NHSN, National Healthcare Safety Network.
Risk Difference of Death From Discordant Antibiotics (ΔD)
Disease severity varied across studies and included CAP, healthcare-associated pneumonia, hospital-acquired pneumonia (HAP), and ventilator-associated pneumonia (VAP) (Figure 1, Supplementary Table 2) [29–34]. All studies, except 1 [32], included culture-positive cases only. Two studies looked at gram-negative pathogens only [29, 34] and 4 studies reported aggregated mortality without separating it by pathogen type [30–33]. The median rate of death with concordant antibiotics was 17.17% (IQR, 13.33%–20.96%) and 32.94% (25.26%–52.36%) with discordant antibiotics, for a median risk difference of 15.78% (Supplementary Table 2).
Excess Risk of Death in Pneumonia
The excess difference of death was highest with administration of discordant antibiotics in potentially ceftriaxone-resistant infections, with a median of 5.8% (IQR, 2.6%–4.0%). The excess risk difference of death in infections with cefepime resistance if given discordant antibiotics was 0.9% (IQR, 0.6%–2.1%) and for meropenem resistance it was 0.6% (IQR, 0.3%–1.7%).
The simulation models based on binomial distributions showed a median risk difference of 5.5% (95% CI, 5.32%–5.67%) for ceftriaxone-resistant infections treated with discordant antibiotics, 0.87% (95% CI, .8%–.93%) for cefepime resistance, and 0.56% (95% CI, .51%–.61%) for meropenem resistance (Figure 4A–C).
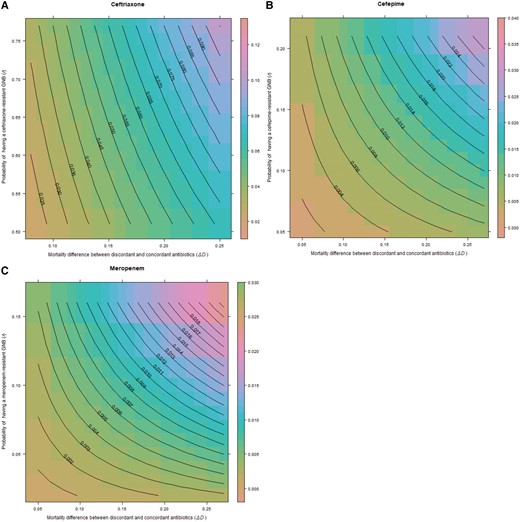
Excess risk of death with discordant antibiotics in pneumonia for ceftriaxone (A), cefepime (B), and meropenem (C). Central lines on the contour plot represent excess risk of death at the intersection of the 3 terms of the equation for prevalence of gram-negative bacilli (GNB), rate of resistance, and difference in mortality between discordant and concordant antibiotics. For all contour graphs, the y-axis displays the probability of antibiotic resistance (r), while the x-axis displays the excess risk of death with discordant antibiotics, . The z-axis representing probability of GNB infection (b) is not displayed in 2-dimensional space. Note that axis scales are different for each antibiotic.
Severe Urinary Tract Infections
UTI-specific data were only available from NHSN (catheter-associated UTI) and Sentry, with median rate of GNB infections at 86.61% (IQR, 84.66%–88.56%). The rate of ceftriaxone resistance was 33.3% (IQR, 29.02%–37.57%), while the rate of cefepime resistance was 6.54% (IQR, 5.86%–7.22%) and the rate of meropenem resistance was 0.87% (IQR, 0.51%–1.24%) (Table 3). No studies met all inclusion criteria. However, 1 study from Canada was identified that showed only a 0.4% difference in mortality with discordant antibiotics [35].
Probability of Gram-Negative Bacilli Infection With Antibiotic Resistance in Severe Urinary Tract Infections
| Database | Rate of GNB, % | Resistance to CRO, % | Resistance to FEP, % | Resistance to MEM, % |
|---|---|---|---|---|
| Sentry | 90.51 | 24.74 | 7.89 | 1.61 |
| NHSN | 82.70 | 41.85 | 5.18 | 0.14 |
| Median (IQR) | 86.61 (84.66–88.56) | 33.30 (29.02–37.57) | 6.54 (5.86–7.22) | 0.87 (0.51–1.24) |
| Database | Rate of GNB, % | Resistance to CRO, % | Resistance to FEP, % | Resistance to MEM, % |
|---|---|---|---|---|
| Sentry | 90.51 | 24.74 | 7.89 | 1.61 |
| NHSN | 82.70 | 41.85 | 5.18 | 0.14 |
| Median (IQR) | 86.61 (84.66–88.56) | 33.30 (29.02–37.57) | 6.54 (5.86–7.22) | 0.87 (0.51–1.24) |
Abbreviations: CRO, ceftriaxone; FEP, cefepime; GNB, gram-negative bacilli; IQR, interquartile range; MEM, meropenem; NHSN, National Healthcare Safety Network.
DISCUSSION
Herein we demonstrated a method of calculating excess risk of death in severe infections caused by resistant GNB if receiving discordant antibiotics by using 3 probabilities that can be estimated in clinical practice. This study is an adaptation and expansion of prior work [9] that was developed in response to the 2007 IDSA/American Thoracic Society (ATS) guidelines that recommend using empiric macrolide antibiotics in bacterial CAP if high-level resistance rates exceed 25%, which failed to take into account morbidity and mortality with lower-level resistance rates [36, 37]. Similarly, the IDSA/ATS recommends double coverage for P aeruginosa and other resistant GNB in HAP/VAP when local GNB resistance rates are above 10% or if resistance rates are unknown. Both guidelines are based on expert opinion with minimal support from empirical evidence.
We argue that blanket guidelines delineating a specific population resistance threshold may lead to overuse or underuse of broad-spectrum anti-GNB antibiotics, depending on the clinical context.
Our data suggest that clinicians should shift away from estimating the likelihood of a resistant infection alone when choosing empiric antibiotics in severe infections, and shift toward estimating the risk of mortality with discordant or “inappropriate” treatment within the context of local resistance rates. For example, using our binomial distributions (Figures 2A and 3A), if ceftriaxone is selected as the empiric choice in hospitalized GNB pneumonia or septic shock, at the highest levels of resistance to ceftriaxone (r) and high rates of mortality with discordant antibiotics (), the excess mortality caused by giving the wrong antibiotic could be as high as 8%–10%. However, our results offer little support for the concept of double coverage for resistant organisms. For example, using our binomial distributions for cefepime and meropenem in pneumonia (Figure 3B and 3C), if resistance rates (r) are set at 0.1 (10%), even at the highest rate of mortality with discordant treatment (), the expected excess mortality from selecting the wrong antibiotic is approximately 0.013 (1.3%) for both antibiotics. The excess risk falls well below 1% when using the median rates of mortality (). It is unclear what double coverage would do to change the excess mortality, and risks of overtreatment (development of resistance, drug reactions), must also be considered. In a similar analysis, Bostwick et al found that using the methicillin resistance rates to dictate anti–methicillin-resistant S aureus (MRSA) coverage in HAP/VAP led to overtreatment of 95% of patients in a large Veterans Affairs study [38]. Estimates of excess mortality using literature searches were also biased toward culture-positive results. Up to one-half of patients identified to meet sepsis criteria will never have an organism identified. When factoring culture-negative data, as we did with our local dataset, the excess risk of mortality when using empiric treatment, even in high rates of resistance, was much lower.
Furthermore, the empiric antibiotic choice may make little difference when risk difference of mortality is low, as was found in this study with sepsis (without shock) and severe UTI. UTI serves as a great example to emphasize that 3 probabilities combine to alter the excess risk of death and move away from population resistance thresholds alone. From our literature search and from other published reports, appropriate antibiotics only very minimally impact mortality in complicated or severe UTIs [29, 35, 39]. Similarly, a Spanish study found a difference in mortality of 1.1% (52.2% vs 53.3%) between concordant and discordant antibiotics [40]. Even though resistant GNB can be prevalent in UTI, especially catheter-associated UTI, the excess risk of death is significantly under 1% when using non-US mortality data. However, it is important to point out that discordant antibiotic treatment is not the same as no antibiotic treatment at all and that most sepsis studies select patients based on administration of antibiotics for at least 24–48 hours, creating a selection bias [41].
There are several other caveats to our analysis. First, the available published data are skewed toward severe infections in hospitalized patients with likely overall higher rates of resistant organisms. We chose to tailor our analyses to the 9 pathogens present in the OneHealth Trust databases for increased precision in comparing with the other 2 datasets. This excluded uncommon gram-negative and gram-positive pathogens, as well as fungal and viral infections. From data we have collected at our institution, the GNB listed (E coli, P aeruginosa, K pneumoniae, Enterobacter spp, and Acinetobacter spp) account for 85% of culture-positive GNB sepsis episodes, making these species representative of most GNB infections. Similar rates of GNB prevalence and resistance were reported by the publications in our literature search. Published articles predominantly examined only culture-positive sepsis and pneumonia, except for 2 sources [24, 32]. Although rates may vary, >50% of patients with sepsis or pneumonia may never have a pathogen identified and it is much more common for pneumonia, at least CAP, to be caused by a virus [42–44].
Future applications of this work could include prospectively assessing the excess risk of death using different antibiotics, specific pathogens, and in different types of infections using methods outlined in the World Health Organization’s Global Antimicrobial Resistance and Use Surveillance System report [45]. With the implementation of electronic medical records systems and big data, it is becoming increasingly easier to analyze local datasets. Many hospitals generate local antibiograms, and a next step could be to develop contour plots or probability tables with the variables demonstrated in this study. Of course, the use of these tools would be for empiric guidance only, but should not supersede other forms of data, including if patients are known to have had past resistant infections or if molecular methods have been used to rule out specific pathogens (eg, MRSA nares or pneumonia polymerase chain reaction testing).
Supplementary Data
Supplementary materials are available at Open Forum Infectious Diseases online. Consisting of data provided by the authors to benefit the reader, the posted materials are not copyedited and are the sole responsibility of the authors, so questions or comments should be addressed to the corresponding author.
Notes
Patient consent. No patient consent was required for this study. This study was approved by the Washington University School of Medicine Institutional Review Board (protocol 202109085).
Financial support. M. C. V. G. is supported by the National Institute of General Medical Sciences of the National Institutes of Health (award number K08 GM140310-01). M. K. is supported by the Barnes-Jewish Hospital Foundation.
References
Author notes
Potential conflicts of interest. All authors report no potential conflicts of interest.


Comments