


Abstract
A better understanding of long-term health effects after severe acute respiratory syndrome coronavirus 2 (SARS-CoV-2) infection has become one of the health care priorities in the current pandemic. We analyzed a large and diverse patient cohort to study health effects related to SARS-CoV-2 infection occurring >1 month postinfection.
We analyzed 17 487 patients who received diagnoses for SARS-CoV-2 infection in a total of 122 health care facilities in the United States before April 14, 2022. Patients were propensity score–matched with patients diagnosed with the common cold, influenza, or viral pneumonia from March 1, 2020, to April 1, 2021. For each outcome, SARS-CoV-2 was compared with a generic viral respiratory infection (VRI) by predicting diagnoses in the period between 30 and 365 days postinfection. Both coronavirus disease 2019 (COVID-19) and VRI patients were propensity score–matched with patients with no record of COVID-19 or VRI, and the same methodology was applied. Diagnoses where COVID-19 infection was a significant positive predictor in both COVID-19 vs VRI and COVID-19 vs control comparisons were considered COVID-19-specific effects.
Compared with common VRIs, SARS-CoV-2 was associated with diagnoses of palpitations, hair loss, fatigue, chest pain, dyspnea, joint pain, and obesity in the postinfectious period.
We identify that some diagnoses commonly described as “long COVID” do not appear significantly more frequent post–COVID-19 infection compared with other common VRIs. We also identify sequelae that are specifically associated with a prior SARS-CoV-2 infection.
Since the beginning of the pandemic in 2020, a growing number of patients infected with the severe acute respiratory syndrome coronavirus 2 (SARS-CoV-2) virus have reported persistent, long-lasting symptoms that continue long beyond the normal duration of SARS-CoV-2 infection. Some of these symptoms are widely reported, such as fatigue [1–7], brain fog [4, 8–10], and shortness of breath [1, 3, 10, 11], but many other long-term health effects of SARS-CoV-2 infection remain underexplored. Beyond the obvious potential for long-term respiratory effects, many cardiovascular, neurological, gastrointestinal, musculoskeletal, metabolic, and immune-mediated effects have been suggested to persist long after the infectious period of SARS-CoV-2 [1–3, 8, 9, 11–21]. These effects range from non-life-threatening conditions, such as excessive eating [16] or hair loss [17], in post–coronavirus disease 2019 (COVID-19) patients to significantly increased risk of serious medical events associated with a substantial risk of mortality, such as myocarditis [15]. A better understanding of the long-term effects of SARS-CoV-2 infection is critical for public health. Furthermore, other respiratory viruses including influenza have been noted to have long-term implications, elucidating the need to identify specific long-term effects of COVID-19. Due to the complex multisystem nature of COVID-19, it is also necessary to account for the widest possible array of possible confounders in the form of comorbidities and past medical history. Aggregated electronic health record (EHR) data allow for large-scale studies into diverse patient populations using recent data, which makes EHR data ideal in many ways for studying the ongoing pandemic. The quantity and diversity of patients allow for the study of effects of infection on even relatively uncommon conditions, which would be too rare to study in smaller general-purpose EHR data sets. Due to the widespread nature of SARS-CoV-2 infections, it has become important to determine what health conditions infection is associated with in the long-term. It is also necessary to estimate how much the risk of developing these long-term effects is increased by SARS-CoV-2 infection specifically, increased risk that is not associated with other common respiratory viruses. Previous work has briefly investigated the differences in outcomes between hospitalized COVID-19 and influenza patients [22]. Our work provides additional information on this subject by analyzing a larger and more diverse patient cohort, including other common viral respiratory infections, and examining outcomes in patient cohorts not limited to patients hospitalized for the initial infection.
METHODS
This study is focused on identifying long-term, persistent effects of COVID-19. In some cases, COVID-19 patients may remain infectious for up to 21 days [23] after symptom onset, and normal recovery from the illness may take additional time. We excluded diagnoses within the first 30 days after the index encounter to ensure that diagnoses observed to be associated with an earlier COVID-19 infection represented truly long-term effects of the illness.
Patients
We analyzed data from the Cerner Real-World Data data set extracted from the electronic medical records of health care facilities that have a data use agreement with Cerner Corporation [24].
The methodological aspects of the data set are available in other publications [25, 26]. The Cerner Real-World Data–COVID–March 2022 version of the data included data from 122 contributing Cerner Real-World Data health systems in United States. Encounters may include pharmacy, clinical, microbiology laboratory, admission, and billing information from affiliated patient care locations. All admissions, medication orders and dispensing, laboratory orders, and specimens are date- and time-stamped, providing a temporal relationship between treatment patterns and clinical information. Cerner Corporation has established Health Insurance Portability and Accountability Act–compliant operating policies to establish de-identification for Cerner Real-World Data. The data are based on electronic medical records before April 14, 2022. The data set, as part of the de-identification procedure, does not provide an identifier for the medical institution, nor does it provide its precise geographical location.
Our analysis identified COVID-19 patients using International Classification of Diseases, Tenth Revision, Clinical Modification (ICD-10-CM), codes. Index encounters for COVID-19 and non-COVID-19 patients were sampled from medical encounters between March 1, 2020, and April 1, 2021, to ensure that all patients had up to 365 days after their index encounter to receive new diagnoses. Patients under the age of 18 were excluded from this analysis. The index encounter for COVID-19-positive patients was identified as the first medical encounter for each patient containing the ICD-10 code for pneumonia due to COVID-19 (J12.82) or COVID-19 (U07.1). The index encounter for the viral respiratory infection (VRI) population data was identified from patients diagnosed with the common cold (J00), influenza (J09-J11), or viral pneumonia (J12) and defined as the first medical encounter for each patient containing any of the VRI ICD-10 codes within the study period. Patients diagnosed with COVID-19 at any point were excluded from this VRI population. A third population without any record of COVID-19 or VRI was also extracted from the same time period. The index encounter for this group was defined as a random encounter from within the same time period as the index encounters for the COVID-19 and VRI groups. To ensure completeness of records, all patients analyzed in this study were required to have ≥2 medical encounters of any type in the year before their index encounter and ≥2 medical encounters of any type in the year following their index encounter. Patient demographic information consisting of age, sex, and race was extracted for all patients. Clinical event covariates, defined using ICD-10 codes (shown in Table 1), were extracted for all patients and were categorized into past history (>1 year before index encounter), recent history (<1 year before index encounter), index encounter (occurred during index encounter), and postencounter (occurred 30–365 days after index encounter). Each clinical covariate is a true/false value representing whether each patient in the data set experienced that specific clinical event during the specified time period. For example, a patient for whom the variable “index encounter fever” has the value of “true” was diagnosed with a fever during their index encounter.
ICD-10 Codes Used to Define Diagnoses
| Diagnosis | ICD-10 Codes |
|---|---|
| Hair Loss | L65 |
| Headache | R51/G44/G43 |
| Myocarditis | I40/I41/I51.4/I09.0 |
| Heart Failure | I09.81/I11.0/I50 |
| Tachycardia | I47/R00.0 |
| Obesity | E66.0/E66.1/E66.2/E66.8/E66.9/Z68.3/Z68.4 |
| Palpitations | R00.2 |
| Fatigue | R53.8/G93.3 |
| Weakness | R53.1/M62.81/R26.89 |
| Cough | R05 |
| Dyspnea | R06.0 |
| Myalgia | M79.1/M60 |
| Tinnitus | H93.1 |
| Chest Pain | R07.1/R07.8/R07.9 |
| Joint Pain | M25.5 |
| Anosmia | R43.0 |
| Unspecified Anemia | D64.9 |
| Fever | R50 |
| Diarrhea | K59.1/R19.7 |
| Hypoxemia | R09.02 |
| Pneumonia | J12-J18 |
| Dependence on Respirator or Oxygen | Z99.81 |
| CKD | N18 |
| ARDS | J80 |
| COPD | J44 |
| Asthma | J45 |
| Other Respiratory Failure | J96 |
| Pulmonary Embolism | I26 |
| Septic Shock | R65.21 |
| Ischemic Stroke | I63/I65/I66 |
| Intracerebral Hemorrhage | I61 |
| Subarachnoid Hemorrhage | I60 |
| Acute Myocardial Infarction | I21/I22/I25.2 |
| Unstable Angina | I20.0 |
| Hyperlipidemia | E78 |
| Hypertension | I10/O10.0/O10.9/I16/I6.74 |
| Type 1 Diabetes | E10 |
| Type 2 Diabetes | E11 |
| Nicotine Dependence/Tobacco Use | F17/Z72.0 |
| Atrial Fibrillation | I48 |
| Alcohol Use or Abuse | F10 |
| Cognitive Impairment | R40/R41/R48/G93.40/G31.84/G30/F01/F02/F03/F05/F06.8/G30/G31.0/G31.83 |
| Rheumatoid Arthritis | M05/M06 |
| Lupus | M32 |
| Anxiety/Depression | F30-/F48 |
| Unspecified Pain | G89/R52 |
| Peripheral Neuropathy | G60–G65 |
Abbreviations: ARDS, acute respiratory distress syndrome; CKD, chronic kidney disease; COPD, chronic obstructive pulmonary disease; ICD-10, International Classification of Diseases, Tenth Revision.
In addition to specific clinical and demographic variables, we attempted to adjust for the frequency and intensity of pre–index encounter medical care by categorizing prior medical encounters into emergency, inpatient, outpatient, and other and recording the number of each available in each patient's records. Using these demographic and clinical variables, patients from the 3 cohorts were matched using propensity score matching to form 3 separate matched cohorts for comparison, COVID-19 vs VRI, COVID-19 vs noninfected, and VRI vs noninfected. Propensity scores were estimated with a logistic regression model using data for each patient from before or during their index encounter. Populations were propensity score–matched to ensure that the distributions of demographics and comorbidities were similar between the populations, as shown in Table 2. The full list of covariates, outcomes, and their frequencies in each comparison group is available in Supplementary Table 1.
Demographics of Study Population
| COVID vs VRI | COVID vs No Infection | VRI vs No Infection | |||||||
|---|---|---|---|---|---|---|---|---|---|
| Characteristics | Patients With SARS-CoV-2, No. (%) | Patients With VRI, No. (%) | P | Patients With SARS-CoV-2, No. (%) | Patients With No Infection, No. (%) | P | Patients With VRI, No. (%) | Patients With No Infection No. (%) | P |
| Total | 17 487 (100.0) | 17 487 (100.0) | - | 15 694 (100.0) | 15 694 (100.0) | 15 694 (100.0) | 15 694 (100.0) | ||
| Demographics | … | … | … | … | |||||
| Age | … | … | |||||||
| 18–24 y | 1871 (10.7) | 1764 (10.1) | .0608 | 1436 (9.1) | 1609 (10.3) | .001 | 1578 (10.1) | 1609 (10.3) | .5624 |
| 25–34 y | 2534 (14.5) | 2572 (14.7) | .565 | 2190 (14.0) | 2290 (14.6) | .1066 | 2288 (14.6) | 2290 (14.6) | .9745 |
| 35–49 y | 3717 (21.3) | 3797 (21.7) | .2976 | 3394 (21.6) | 3346 (21.3) | .5094 | 3409 (21.7) | 3346 (21.3) | .3869 |
| 50–64 y | 4525 (25.9) | 4655 (26.6) | .1141 | 4207 (26.8) | 4130 (26.3) | .3251 | 4192 (26.7) | 4130 (26.3) | .4279 |
| 65–80 y | 3839 (22.0) | 3701 (21.2) | .0727 | 3540 (22.6) | 3342 (21.3) | .0069 | 3349 (21.3) | 3342 (21.3) | .9231 |
| >80 y | 1001 (5.7) | 998 (5.7) | .9449 | 927 (5.9) | 977 (6.2) | .2371 | 878 (5.6) | 977 (6.2) | .0178 |
| Sex | … | … | |||||||
| Sex: male | 5919 (33.8) | 5921 (33.9) | .982 | 5362 (34.2) | 5108 (32.5) | .0024 | 5278 (33.6) | 5108 (32.5) | .0414 |
| Sex: female | 11 560 (66.1) | 11 561 (66.1) | .991 | 10 324 (65.8) | 10 581 (67.4) | .0021 | 10 411 (66.3) | 10 581 (67.4) | .0415 |
| Race/ethnicity | … | … | |||||||
| Race: White | 12 816 (73.3) | 12 802 (73.2) | .8657 | 11 353 (72.3) | 11 578 (73.8) | .0042 | 11 533 (73.5) | 11 578 (73.8) | .5643 |
| Race: Black | 1794 (10.3) | 1723 (9.9) | .2068 | 1591 (10.1) | 1479 (9.4) | .0333 | 1520 (9.7) | 1479 (9.4) | .4311 |
| Race: Hispanic | 720 (4.1) | 737 (4.2) | .6491 | 699 (4.5) | 504 (3.2) | <.0001 | 598 (3.8) | 504 (3.2) | .0039 |
| Race: Asian | 273 (1.6) | 254 (1.5) | .4043 | 244 (1.6) | 239 (1.5) | .8187 | 239 (1.5) | 239 (1.5) | 1 |
| Race: other | 1884 (10.8) | 1971 (11.3) | .1374 | 1807 (11.5) | 1894 (12.1) | .1278 | 1804 (11.5) | 1894 (12.1) | .1151 |
P values were calculated using a 2-tailed chi-square test.
Abbreviations: SARS-CoV-2, severe acute respiratory syndrome coronavirus 2; VRI, viral respiratory infection.
Statistical Analysis
The effect of SARS-CoV-2 infection was assessed using a logistic regression analysis to test the influence of SARS-CoV-2 infection on the probability of developing each outcome in the period between 30 and 365 days after the index encounter. In addition to demographic factors and infection status, the presence of diagnoses/clinical events that occurred in the previously specified time intervals for past history, recent history, and during the index encounter was used as a predictor to predict diagnoses in the postencounter period. All P values are 2-tailed.
Due to the large number of outcomes being tested, P values for the effect of SARS-CoV-2 infection were adjusted for false discovery rate using the Benjamini-Hochberg Procedure [27] with an alpha of .01. Separate statistical analyses were carried out using the same methodology to assess the long-term effects of both COVID-19 infections and generic VRIs in comparison with the noninfected control group. We consider COVID-19 infection specifically to be associated with an outcome if its predicted effect is positive, with P < .05 in both the comparison against the noninfected control group and against patients with generic VRIs.
RESULTS
Compared with generic VRIs, SARS-CoV-2 infection during the index encounter was a significant positive predictor for receiving diagnoses of palpitations (OR, 1.32; 95% CI, 1.17–1.49), hair loss (OR, 1.32; 95% CI, 1.05–1.67), fatigue (OR, 1.13; 95% CI, 1.05–1.22), chest pain (OR, 1.1; 95% CI, 1.02–1.18), dyspnea (OR, 1.09; 95% CI, 1.01–1.16), joint pain (OR, 1.08; 95% CI, 1.02–1.15), and obesity (OR, 1.08; 95% CI, 1.01–1.15) in the time period between 30 and 365 days after the index encounter. The full list of effect estimates is shown in Figure 1, with exact values available in Table 3.
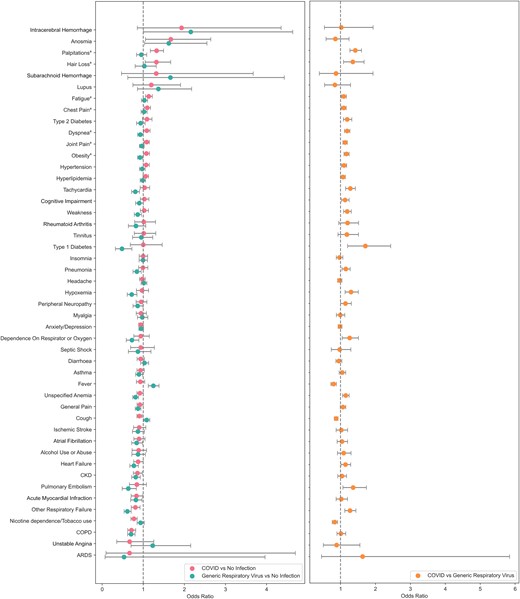
Effect of index encounter infection on the probability of receiving each diagnosis 30–365 days postinfection. Comparison of COVID-19 and generic respiratory virus using noninfected controls (left). Comparison of COVID vs generic respiratory viral infection (right). aDiagnoses that are significant in both COVID vs no infection and COVID vs VRI comparisons. Abbreviations: COVID-19, coronavirus 2019; VRI, viral respiratory infection.
Effect of Infection on Probability of Receiving Each Diagnosis 30–365 Days Postinfection
| COVID vs VRI | COVID vs No Infection | VRI vs No Infection | ||||
|---|---|---|---|---|---|---|
| Outcome | Odds Ratio (95% CI) | P | Odds Ratio (95% CI) | P | Odds Ratio (95% CI) | P |
| Type 1 diabetes | 1.71 (1.2–2.44) | .0028 | 1.0 (0.69–1.46) | .998 | 0.48 (0.32–0.73) | .0004 |
| ARDS | 1.63 (0.45–5.84) | .453 | 0.67 (0.09–4.7) | .684 | 0.53 (0.07–3.96) | .538 |
| Palpitations | 1.42 (1.27–1.6) | <.0001 | 1.32 (1.17–1.49) | <.0001 | 0.95 (0.84–1.08) | .467 |
| Pulmonary embolism | 1.36 (1.07–1.74) | .0129 | 0.84 (0.66–1.08) | .173 | 0.64 (0.49–0.83) | .0009 |
| Hair loss | 1.35 (1.08–1.67) | .0071 | 1.32 (1.05–1.67) | .0197 | 1.03 (0.8–1.31) | .831 |
| Hypoxemia | 1.3 (1.13–1.51) | .0003 | 0.97 (0.83–1.13) | .698 | 0.72 (0.61–0.85) | .0001 |
| Tachycardia | 1.28 (1.15–1.42) | <.0001 | 1.03 (0.92–1.16) | .561 | 0.81 (0.72–0.91) | .0003 |
| Other respiratory failure | 1.27 (1.12–1.44) | .0002 | 0.81 (0.71–0.92) | .0016 | 0.61 (0.53–0.71) | <.0001 |
| Dependence on respirator or oxygen | 1.26 (1.05–1.51) | .014 | 0.94 (0.77–1.15) | .545 | 0.72 (0.59–0.89) | .0026 |
| Rheumatoid arthritis | 1.2 (0.95–1.52) | .129 | 1.01 (0.79–1.3) | .915 | 0.82 (0.64–1.06) | .131 |
| Dyspnea | 1.19 (1.11–1.27) | <.0001 | 1.09 (1.01–1.16) | .0206 | 0.93 (0.86–1.0) | .0442 |
| Weakness | 1.19 (1.09–1.31) | .0002 | 1.02 (0.93–1.13) | .638 | 0.86 (0.78–0.96) | .0044 |
| Type 2 diabetes | 1.19 (1.08–1.32) | .0005 | 1.09 (0.98–1.21) | .107 | 0.94 (0.84–1.05) | .242 |
| Tinnitus | 1.18 (0.93–1.51) | .181 | 1.01 (0.78–1.3) | .933 | 0.95 (0.74–1.23) | .718 |
| Obesity | 1.17 (1.1–1.25) | <.0001 | 1.08 (1.01–1.15) | .0277 | 0.92 (0.86–0.99) | .0206 |
| Pneumonia | 1.15 (1.04–1.28) | .006 | 0.99 (0.89–1.11) | .906 | 0.84 (0.75–0.95) | .0051 |
| Unspecified anemia | 1.15 (1.06–1.25) | .0009 | 0.92 (0.85–1.0) | .0525 | 0.81 (0.74–0.89) | <.0001 |
| Peripheral neuropathy | 1.14 (1.0–1.31) | .0488 | 0.95 (0.83–1.09) | .455 | 0.86 (0.75–0.99) | .038 |
| Heart failure | 1.14 (1.01–1.29) | .0342 | 0.87 (0.77–1.0) | .0427 | 0.77 (0.67–0.88) | .0001 |
| Cognitive impairment | 1.13 (1.03–1.24) | .0124 | 1.03 (0.93–1.14) | .588 | 0.9 (0.81–1.0) | .0502 |
| Joint pain | 1.13 (1.07–1.19) | <.0001 | 1.08 (1.02–1.15) | .0103 | 0.96 (0.91–1.02) | .217 |
| Hypertension | 1.1 (1.03–1.17) | .0057 | 1.07 (1.0–1.15) | .0553 | 0.97 (0.91–1.05) | .479 |
| Chest pain | 1.09 (1.02–1.16) | .0142 | 1.1 (1.02–1.18) | .0113 | 1.02 (0.95–1.09) | .609 |
| Alcohol use or abuse | 1.09 (0.91–1.3) | .359 | 0.89 (0.73–1.08) | .232 | 0.87 (0.72–1.05) | .15 |
| Fatigue | 1.09 (1.02–1.17) | .0117 | 1.13 (1.05–1.22) | .0007 | 1.03 (0.95–1.11) | .473 |
| Hyperlipidemia | 1.07 (1.0–1.14) | .0381 | 1.06 (0.99–1.13) | .0846 | 0.99 (0.92–1.06) | .726 |
| General pain | 1.07 (0.99–1.15) | .0901 | 0.92 (0.85–1.0) | .0376 | 0.87 (0.81–0.94) | .0007 |
| Asthma | 1.05 (0.96–1.15) | .299 | 0.93 (0.85–1.03) | .155 | 0.9 (0.81–0.98) | .0223 |
| Atrial fibrillation | 1.04 (0.9–1.2) | .587 | 0.9 (0.77–1.04) | .158 | 0.84 (0.72–0.98) | .0264 |
| CKD | 1.04 (0.92–1.17) | .56 | 0.86 (0.76–0.98) | .0191 | 0.82 (0.72–0.93) | .0018 |
| Ischemic stroke | 1.02 (0.87–1.2) | .764 | 0.9 (0.76–1.06) | .213 | 0.87 (0.74–1.03) | .105 |
| Acute myocardial infarction | 1.02 (0.87–1.2) | .783 | 0.84 (0.71–0.99) | .0363 | 0.82 (0.69–0.97) | .0192 |
| Intracerebral hemorrhage | 1.02 (0.54–1.93) | .954 | 1.93 (0.86–4.35) | .113 | 2.16 (1.0–4.63) | .0491 |
| COPD | 1.01 (0.9–1.15) | .816 | 0.71 (0.62–0.82) | <.0001 | 0.7 (0.62–0.8) | <.0001 |
| Myalgia | 0.99 (0.88–1.12) | .91 | 0.95 (0.83–1.08) | .397 | 0.98 (0.86–1.11) | .709 |
| Anxiety/depression | 0.98 (0.93–1.04) | .554 | 0.94 (0.89–1.0) | .0521 | 0.95 (0.89–1.01) | .0822 |
| Septic shock | 0.98 (0.73–1.29) | .861 | 0.94 (0.69–1.27) | .678 | 0.87 (0.64–1.19) | .38 |
| Headache | 0.97 (0.91–1.04) | .408 | 0.98 (0.91–1.05) | .495 | 1.02 (0.95–1.09) | .66 |
| Insomnia | 0.97 (0.88–1.07) | .498 | 1.0 (0.9–1.11) | .986 | 1.0 (0.9–1.1) | .927 |
| Diarrhea | 0.95 (0.87–1.04) | .236 | 0.94 (0.85–1.03) | .177 | 1.03 (0.94–1.13) | .545 |
| Unstable angina | 0.89 (0.51–1.55) | .676 | 0.67 (0.35–1.26) | .21 | 1.23 (0.7–2.15) | .47 |
| Cough | 0.87 (0.82–0.93) | <.0001 | 0.91 (0.85–0.97) | .0056 | 1.08 (1.01–1.16) | .0199 |
| Subarachnoid hemorrhage | 0.87 (0.39–1.93) | .731 | 1.32 (0.47–3.67) | .6 | 1.66 (0.62–4.43) | .311 |
| Anosmia | 0.85 (0.58–1.24) | .405 | 1.67 (1.05–2.64) | .0287 | 1.62 (1.03–2.55) | .0358 |
| Lupus | 0.84 (0.54–1.29) | .417 | 1.2 (0.75–1.91) | .455 | 1.37 (0.86–2.18) | .186 |
| Nicotine dependence/tobacco use | 0.83 (0.76–0.91) | .0001 | 0.77 (0.7–0.85) | <.0001 | 0.93 (0.85–1.03) | .151 |
| Fever | 0.8 (0.73–0.88) | <.0001 | 0.93 (0.83–1.04) | .188 | 1.25 (1.12–1.38) | <.0001 |
P values were calculated using a 2-tailed chi-square test.
Abbreviations: ARDS, acute respiratory distress syndrome; CKD, chronic kidney disease; COPD, chronic obstructive pulmonary disease; COVID, coronavirus disease; VRI, viral respiratory infection.
Pulmonary Effects
Dyspnea and chest pain were the only pulmonary diagnosis found to be significantly elevated in both comparisons between COVID-19 and VRI patients and COVID-19 and control patients. Pulmonary embolism, hypoxemia, other respiratory failure, dependence on oxygen, and pneumonia were significantly more frequent in COVID-19 patients compared with VRI patients but were not significantly more frequent in COVID-19 patients compared with control patients.
Neurological Effects
SARS-CoV-2 infection was not uniquely associated with any long-term neurological symptoms in this analysis. Anosmia appeared significantly elevated in both COVID-19 and generic VRI patients, but the difference between the groups was not found to be significant. This lack of significant difference in rates of persistent anosmia is precedented, as previous work has linked influenza viral infections to damaged olfactory nerves in a subset of cases [28]. Although previous studies [29, 30] have suggested that symptoms such as peripheral neuropathy and tinnitus may be long COVID symptoms, we did not observe a significant relationship in this study in either comparison. Long-term negative impacts of COVID-19 infection on mental health through anxiety and mood disorders have also been reported [13], but we found no significant relationship between infection and anxiety/depression in either comparison. Rates of cognitive impairment were also observed to be elevated in COVID-19 patients relative to VRI patients, but this relationship was not observed when compared with the control group.
Cardiovascular Effects
SARS-CoV-2 infection was uniquely associated with an increased risk of receiving a diagnosis for heart palpitations. Tachycardia, unspecified anemia, heart failure, hypertension, and hyperlipidemia were more frequent in COVID-19 patients relative to generic VRI patients but were not significantly elevated in COVID-19 patients compared with the control groups. Lasting thrombotic effects of SARS-CoV-2 infection have previously been suggested [31] to be risk factors that could increase the probability of stroke or intracerebral hemorrhage post-COVID-19, but no significant relationship between index SARS-CoV-2 infection and an increased risk of stroke or cerebral hemorrhage post-COVID-19 was observed. Relationships between index SARS-CoV-2 infection and heart failure and atrial fibrillation were not significant in our analysis.
Musculoskeletal Effects
Fatigue and joint pain were specifically associated with an index encounter SARS-CoV-2 infection. Muscle weakness was significantly more frequent in COVID-19 patients compared with VRI patients but was not significantly elevated when COVID-19 patients were compared with controls.
Immune Effects
Increased risk of immune-mediated conditions as a result of SARS-CoV-2 infection has also previously been suggested in relation to lupus, rheumatoid arthritis [32, 33], and type 1 diabetes [21]. Our analysis observed no significant relationships between COVID-19 infection and these diagnoses. Diagnoses of type 1 diabetes were significantly more frequent in COVID-19 patients compared with VRI patients, but no significant relationship was observed when comparing COVID-19 and control patients.
Duration of Symptoms
Figure 2 shows the approximate duration of symptoms for selected diagnoses where COVID-19 infection had a large predicted effect size. The frequencies of some symptoms converge to baseline rates over time, while others show persistent over-representation in the COVID-19 population. The distribution of final hair loss diagnoses shows that COVID-19-associated hair loss peaks roughly 100 days after the initial infection, before declining roughly to baseline levels after 250 days. Supplementary Table 2 shows the average number of days between the index encounter and the date when the symptom was last recorded for each comparison group. Compared with VRI patients, the average dates of the last recorded fatigue (P = .0001) and joint pain (P = .0359) diagnoses were significantly earlier in COVID-19 patients, suggesting recovery to baseline levels may occur during the study period of 1 year postinfection.
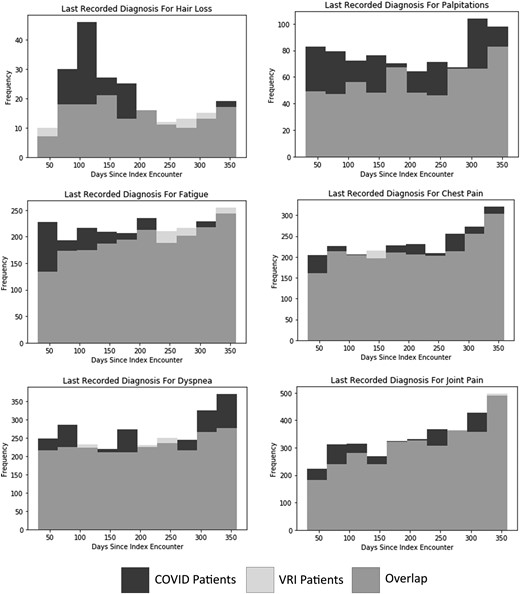
Overlayed histograms of number of days between index encounter and last recorded diagnosis for long COVID symptom for COVID vs non-COVID VRI patients for selected symptoms. Abbreviations: COVID-19, coronavirus 2019; VRI, viral respiratory infection.
DISCUSSION
Our analysis attempts to provide additional information regarding how unique long COVID symptoms are to COVID-19 infections. We make use of a large de-identified EHR data set with the goal of capturing a large and diverse cohort of patients. Our patient cohort was limited primarily by the number of adult patients diagnosed with generic VRIs during the pandemic period. Females were over-represented in this population, making up roughly 66% of eligible adult patients with generic VRIs. Using this study population, we were able to identify 7 diagnoses for which SARS-CoV-2 infection during the index encounter acted as a significant positive predictor for diagnosis 30–365 days after the index encounter when compared with both index encounters with a generic respiratory viral infection and to control patients. Our analysis also identified that differences in symptom duration exist between common VRIs and COVID-19. However, the granularity of these temporal data is limited, as information was only recorded when patients were seen by clinicians during medical encounters. Studying how the long-term implications of each infection type vary over time presents an opportunity for future research.
The persistent pulmonary, cardiovascular, and musculoskeletal symptoms observed to be specifically associated with COVID-19 have the potential to seriously impact quality of life for affected patients. It is possible that the COVID-19-associated increase in obesity diagnoses observed in these data may be a result of reduced physical activity due to lingering effects of COVID-19 infection. However, a definitive relationship cannot be established from the available data, and additional research is needed.
The core symptoms we report as being COVID-specific have been repeatedly found to be associated with earlier COVID-19 in large-scale studies of EHR data [34]. Diagnoses indicating fatigue, body pain, and continuing respiratory problems most commonly characterize this condition. These core symptoms are also prevalent in studies that apply different methodologies to identify and study patient cohorts. For example, large-scale studies of long COVID symptoms through surveys targeted toward users of online long COVID support groups have been conducted as an alternative to EHR studies [35]. These studies have the benefit of allowing for the collection of much more detailed information than is commonly available through EHR data while retaining large sample sizes. However, patients participating in such communities consist of individuals who seek out and continuously participate in discussions about the health implications of COVID-19. These individuals represent a highly self-selecting subset of the general population, and findings may not generalize to more typical patients. Self-selection in testing, treatment, and reporting of symptoms remains a major confounder when attempting to study the long-term implications of COVID-19 in large-scale studies. Additional scrutiny is necessary when attempting to determine which long-term symptoms are truly distinct to SARS-CoV-2 infection.
Clinical Implications
June 2022 data from the Census Bureau and the Center for Disease Control and Prevention's National Center for Health Statistics reveal that >40% of adults in the United States report having been infected with COVID-19 in the past, and nearly one-fifth of those adults who have had COVID-19 report that they are currently still experiencing symptoms of “long COVID.” Overall, this means that up to 7.5% of adult Americans may have long COVID-19 symptoms, defined as symptoms not experienced before the COVID-19 infection and lasting for ≥3 months after first being infected. Interestingly, certain subgroups (eg, by geography [KY, AL, TN, SD], age [middle > elderly], ethnicity (Hispanic, gender [women], gender identity [transgender], and sexual orientation [bisexual]) tend to report higher percentages of long COVID-19 symptoms. Understanding the population and subgroup risks for long COVID associated with outcomes, including lingering and chronic never-before-experienced symptoms and new medical diagnoses such as those reported here, is important for clinicians and researchers, so that clinical guidelines for treatments and symptom management can be more appropriately developed for the growing number of adults affected by COVID-19. The long-term clinical implications of SARS-CoV-2 infection are complex and will have ongoing significant impacts on quality of life and patient care. A better understanding of these implications will be important for patient care in the coming period due to the widespread and persistent nature of COVID-19 infection and the growing number of persons who have been infected.
Limitations
This study does not cover the post-Omicron period of the pandemic as a full year of post-Omicron data were not present in the available data due to the recency of the Omicron wave. As additional post-Omicron data become available, it may become possible to study the long-term effects of the Omicron variant. However, any future studies will be complicated by the extremely widespread nature of Omicron infections, which may not be documented.
Our data are limited to diagnoses documented in EHR systems through billing codes at medical institutions that are part of the Cerner Learning Health Network. It is not possible to exclude all patients who have COVID-19 or generic VRIs from the study populations if there are no records of the infection. Furthermore, it is not possible to conclusively verify that patients were never infected with SARS-CoV-2 during the year after their index encounter using these data. Confirming a persistent lack of infection would require rigorous patient surveillance, which is not available in a data set consisting of medical records derived from routine medical care. COVID-19 testing procedures may also vary by institution and by time period. Underdiagnosis of COVID-19 would be expected to reduce the significance of differences observed when comparing COVID-19 and non-COVID-19 groups. COVID-19 vaccination status was not reliably available in these data as they consist of medical records, not insurance records, and presumably a large proportion of individuals may have received their COVID-19 vaccines outside of medical institutions.
The consistency of available records did not allow for in-depth studies regarding the effects of medications potentially being used to treat COVID-19. Heterogeneity between institutions regarding what prescriptions were documented and how they were documented reduced the quality of medication-related data. Due to this data limitation and lack of perfectly comparable medications also being used to treat generic VRIs, we chose not to include potential COVID-related medications in this study.
Variations in when patients were infected and in the geographic location of those patients are also a source of potential bias in results, as these are not necessarily uniform between groups. Differences in geographic location and phase of the pandemic could affect health care procedures, which has the potential to impact long-term care and outcomes. It was not possible to adjust for these factors due to the lack of location information as a result of data anonymization.
This analysis examined only patients with ≥2 medical encounters in the year before their index encounter and ≥2 medical encounters in the following year. This was necessary to ensure adequate screening for ascertainment of comorbidities and events but did introduce a degree of bias into the patient selection criteria, as patients with a higher number of encounters were over-represented. However, as outpatient encounters were included in our criteria, we do not think that having 2 outpatient encounters per year necessarily represents poor health in the study sample disproportionate to the health status of general public.
Propensity score matching and regression using linear models are not capable of adjusting for nonlinear relationships between variables. Though these methods are effective in adjusting for most confounding factors, some differences in the underlying relationships between covariates may continue to persist.
An inherent limitation of EHR data is that they consist of a nonrandom self-selecting population. Patients who are less likely or less able to seek care are inherently underrepresented. This may affect the generalizability of results attained from EHR data. The diagnostic process is not necessarily clear, and thus it is necessary to rely on diagnoses assigned by clinicians. Depending on the condition and the medical scrutiny a patient receives, chronic conditions can go undiagnosed for significant periods of time. Incomplete or inaccurate diagnoses have the potential to reduce the accuracy of results attained.
Due to heterogeneity in data recording between institutions, it is not possible to unambiguously confirm the presence or nonpresence of SARS-CoV-2 infection in patients with respiratory infections beyond the diagnosis assigned by clinicians. Misclassification of patients would be expected to reduce the statistical power of any differences observed when comparing COVID-19 patients with generic VRI patients. We expect a high level of accuracy due to rigorous criteria for screening established at each medical facility during the COVID-19 pandemic.
EHR data obtained from many different institutions contain significant heterogeneity regarding what was recorded and how it was recorded. The nature of the data also makes it challenging to determine with certainty when patients stopped experiencing certain symptoms. Patients may not receive billing codes for all symptoms or conditions at every medical encounter and may go significant periods between medical encounters. Providers may prioritize and code the more urgent, acute, or new medical diagnoses at a given encounter. This limits our findings regarding the duration of long COVID symptoms, as we are largely relying on the presence of diagnoses, rather than exactly when they occurred.
COVID-19, VRI, and noninfected populations within EHR data sets consistently represent noticeably different distributions of patients. Attempts to select similar patient populations through propensity score matching and to control for confounders using regression analyses are useful, but it is challenging to fully adjust for every possible confounder because many important factors are not recorded in the medical data. Furthermore, influenza and other VRIs had a significantly decreased incidence early in the pandemic during quarantine and other COVID-19 control measures [36], which may have skewed the data set toward long COVID symptoms. In addition, the postviral symptoms studied here were not widely known before the COVID-19 pandemic, limiting the time period for patient selection.
Supplementary Data
Supplementary materials are available at Open Forum Infectious Diseases online. Consisting of data provided by the authors to benefit the reader, the posted materials are not copyedited and are the sole responsibility of the authors, so questions or comments should be addressed to the corresponding author.
Acknowledgments
Financial support. This work was supported by the National Institutes of Health (grant number: 5T32LM012410) to William Baskett and by the Shumaker Endowment to Chi-Ren Shyu.
Disclaimer. The content is solely the responsibility of the authors and does not necessarily represent the official views of the National Institutes of Health.
Patient consent. Patient consent and institutional review board approval were not required for this study due to the deidentified nature of the medical records.
References
Author notes
Potential conflicts of interest. All authors: no reported conflicts of interest. All authors have submitted the ICMJE Form for Disclosure of Potential Conflicts of Interest. Conflicts that the editors consider relevant to the content of the manuscript have been disclosed.


Comments
Unlike other symptoms supported in your analysis, obesity does not appear to be a frequently reported symptom of long-Covid.
The statistically significant results in favour of obesity could be explained by other factors (e.g. the effect of lockdowns on diet) without any connection with long-Covid.
There appear to be multiple long-Covid associated symptoms which were not supported, where statistically significant differences were observed in the Covid vs VRIs set, but not in the Covid vs control set.
The mismatch between long-Covid associated symptoms and lack of statistically significant results could be explained by a non-representative or biased control group.
It is not easy to obtain a non-biased control group for this type of analysis and I appreciated your acknowledgement of bias in the dataset and the record selection methodology used.
For future similar analyses it may prove useful to include more than one control group, employing different selection methodologies for each control group. Significant differences in results compared with each control group could highlight instances where control selection bias has a stronger influence on the result than the target variable(s).