


Abstract
The mortality rates of coronavirus disease 2019 (COVID-19) have been changed across the epidemiological waves. The aim was to investigate the differences in mortality rates of COVID-19 patients in Japan across the 6 epidemiological waves stratified by age group and Coronavirus Clinical Characterisation Consortium (4C) mortality score risk group.
A total of 56 986 COVID-19 patients in the COVID-19 Registry Japan from 2 March 2020 to 1 February 2022 were enrolled. These patients were categorized into 4 risk groups based on their 4C mortality score. Mortality rates of each risk group were calculated separately for different age groups: 18–64, 65–74, 75–89, and ≥90 years. In addition, mortality rates across the wave periods were calculated separately in 2 age groups: <75 and ≥75 years. All calculated mortality rates were compared with reported data from the United Kingdom (UK) during the early epidemic.
The mortality rates of patients in Japan were significantly lower than in the UK across the board, with the exception of patients aged ≥90 years at very high risk. The mortality rates of patients aged ≥75 years at very high risk in the fourth and fifth wave periods showed no significant differences from those in the UK, whereas those in the sixth wave period were significantly lower in all age groups and in all risk groups.
The present analysis showed that COVID-19 patients had a lower mortality rate in the most recent sixth wave period, even among patients ≥75 years old at very high risk.
There have been >570 million confirmed cases of coronavirus disease 2019 (COVID-19) caused by the severe acute respiratory syndrome coronavirus 2 (SARS-CoV-2), with >6.4 million deaths worldwide as of August 2022 since the outbreak in Wuhan, China, in 2019 [1]. COVID-19 severity and mortality are affected by a variety of factors, including age, race, public health policy, and the medical care system [2–6].
Old age is a well-known risk factor for COVID-19 severity and mortality [7]. Japan has become a “super-aged” society, in which the population of elderly people aged 65 years or older (29.3% in 2021) exceeds 21% of the population according to the World Health Organization definition [8]. The Japan Gerontological Society (JGLS) and the Japan Geriatrics Society (JGS) proposed an alternative definition in which people aged 75 years or older are considered as elderly patients because of their maintained physical and psychological health [9]. Based on this concept, elderly COVID-19 patients aged 65 years or older have been actively hospitalized and treated in Japan [7].
The clinical presentation of COVID-19 is highly variable, with most patients presenting with mild symptoms, though some patients develop severe respiratory failure [3]. Therefore, risk prediction is essential for efficient management and triaging of COVID-19 patients. The Coronavirus Clinical Characterisation Consortium (4C) mortality score is a risk stratification score for COVID-19 patients derived from a large and diverse cohort within the United Kingdom (UK) during the initial phase of the pandemic [10]. Although the 4C mortality score is used and has been validated worldwide [7–9], strategies for COVID-19 prevention and management have changed over time with the development of vaccines and new treatment options, including antiviral agents, SARS-CoV-2 neutralizing antibodies, immunomodulators, and anticoagulants [3, 11, 12]. Furthermore, the clinical features of COVID-19 have changed due to the emergence and spread of new variants of SARS-CoV-2 with different infectivity and pathogenicity [13]. Although differences in mortality rates of COVID-19 patients in the different epidemiological wave periods have been examined in several countries [14, 15], how the mortality rates of COVID-19 patients in each risk group of the 4C mortality scores differ with the age of patients in the different epidemiological wave periods has not been fully investigated.
The COVID-19 Registry Japan (COVIREGI-JP) is the largest nationwide registry of hospitalized patients with laboratory-confirmed COVID-19, in which 56 986 COVID-19 patients collected from 708 Japanese healthcare facilities from the start of the COVIREGI-JP on 2 March 2020 to 1 February 2022 were enrolled [4, 16]. The purpose of this study was to investigate the differences in the mortality rates of COVID-19 patients in Japan across the 6 epidemiological wave periods, stratified by age and 4C mortality score risk group using the data from COVIREGI-JP.
METHODS
The institutional review board approved this retrospective, observational study and waived the requirement for informed consent from the patients. This study initially enrolled all the 56 986 COVID-19 patients from 708 voluntarily participating Japanese healthcare facilities registered in COVIREGI-JP from 2 March 2020 to 1 February 2022 [16]. The inclusion criteria for COVIREGI-JP were (1) a positive SARS-CoV-2 test [17] and (2) inpatient treatment at a healthcare facility [4, 16]. For patients with multiple COVID-19 hospitalizations, each admission was included [4]. Some eligible inpatients who refused to participate by opting out or who were participating in other clinical studies have not been registered by the principal investigator's decision [4]. All the study data were collected and managed using the Research Electronic Data Capture (REDCap), a secure web-based data capture application hosted at the Joint Center for Researchers, Associates and Clinicians data center of the National Center for Global Health and Medicine [18]. Data monitoring and outlier queries were performed at the data center.
The 4C mortality scores (0 to 21) were calculated based on the patient data using 8 independent parameters at the time of admission, including age, sex, number of comorbidities, respiratory rate, peripheral oxygen saturation level, Glasgow Coma Scale score, blood urea nitrogen level, and C-reactive protein level [10]. Missing values were given 0 points. The patients were categorized into 4 risk groups based on their 4C mortality score: low (0–3), intermediate (4–8), high (9–14), and very high (15–21) [10].
The mortality rates of COVID-19 patients, defined as the number of deaths divided by the total number of patients, were calculated in the following 3 ways:
Mortality rates for each 4C mortality score risk group were calculated separately in different age groups stratified by JGLS and JGS: 18–64 years, 65–74 years, 75–89 years, and ≥90 years [9]. Of a total of 56 986 registered patients, those whose age was unknown (n = 3742) were excluded, and the remaining 53 244 patients were enrolled to calculate mortality rates for each 4C score risk group in different JGLS and JGS age groups.
The mortality rates for each 4C mortality score risk group were calculated separately in the different epidemiological wave periods in Japan. The epidemiological wave periods in Japan were defined using the data from the COVID-19 situation reports provided by the Japanese Ministry of Health, Labour and Welfare; a single wave was determined to start at a trough of daily recorded COVID-19 cases, which rose to a defined peak before falling to another trough [19]. This established 6 epidemiological waves: the first wave from 2 March 2020 to 8 June 2020; the second wave from 9 June 2020 to 23 September 2020; the third wave from 24 September 2020 to 2 March 2021; the fourth wave from 3 March 2021 to 21 July 2021 (dominated by the Alpha variant); the fifth wave from 22 July 2021 to 22 November 2021 (dominated by the Delta variant); and the sixth wave from 23 November 2021 to 1 February 2022 (dominated by the Omicron variant) [19]. Mortality rates of the second to sixth wave periods were compared with the first wave period. In the comparison of epidemiological wave periods, patients whose date of admission was unknown (n = 6541) were excluded, and the remaining 50 455 patients were included.
Mortality rates for each 4C mortality score risk group across all epidemiological wave periods were calculated separately for 2 age groups: <75 years and ≥75 years. Patients whose age and date of admission were unknown (n = 8295) were excluded.
All of the above mortality rates were compared with reported data from the UK, which are based on the early epidemic data of the UK from 6 February to 29 June 2020 [10]. To assess significance, the χ2 test was used for analysis of categorical variables. For all analyses, P < .05 was considered significant.
RESULTS
The mortality rates separated into different age groups are shown in Table 1 and Figure 1A. The overall mortality rates was significantly lower in Japan than in the UK (P < .05). The mortality rates in each age group were also significantly lower in Japan than in the UK (all P < .05) (Figure 1A and Table 1). When stratified by 4C mortality score risk groups, the mortality rates of patients aged ≥90 years at intermediate and very high risk were not significantly different between Japan and the UK (all P > .05, respectively) (Figure 1A and Table 1).
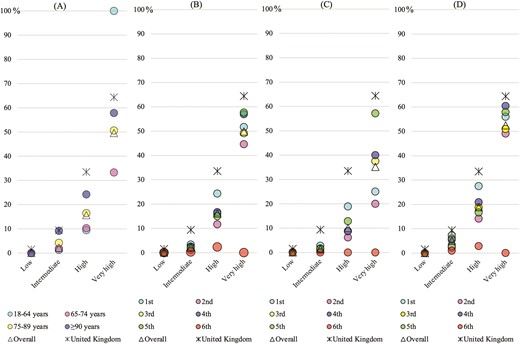
A–D, The mortality rates of patients with coronavirus disease 2019 (COVID-19) in each Coronavirus Clinical Characterisation Consortium (4C) mortality score risk group (low, intermediate, high, and very high) are compared in each age group (A), in each epidemic wave period (B), in patients aged <75 years in each epidemic wave period (C), and in patients aged ≥75 years in each epidemic wave period (D).
Mortality Rates of Patients With Coronavirus Disease 2019 by Age Group, Stratified by 4C Mortality Score Risk Group
| 4C Mortality Score Risk Group | Age Group, y | Overall | United Kingdom | |||
|---|---|---|---|---|---|---|
| 18–64 | 65–74 | 75–89 | ≥90 | |||
| All 4C score | .68%a (217/32 040) | 5.0%a (418/8435) | 14%a (1419/10 482) | 23%a (519/2287) | 4.8%a (2573/53 244) | 31.3% (18 155/57 924) |
| Low (0–3) | .078%a (17/21 857) | 0/0 | 0/0 | 0/0 | .078%a (17/21 857) | 1.5% (65/4224) |
| Intermediate (4–8) | 1.3%a (126/9411) | 1.9%a (107/5577) | 4.2%a (145/3440) | 9.2% (41/447) | 2.2%a (419/18 875) | 9.4% (1237/13 166) |
| High (9–14) | 9.5%a (73/771) | 10%a (287/2786) | 17%a (1108/6714) | 24%a (423/1745) | 16%a (1891/12 016) | 34% (9976/29 755) |
| Very high (15–21) | 100% (1/1) | 33%a (24/72) | 51%a (166/328) | 58% (55/95) | 50%a (246/496) | 64% (6877/10 679) |
Numbers indicate number of deaths/total number of patients (%). P values were assessed by χ2 test compared with the reported data from the United Kingdom.
Abbreviation: 4C, Coronavirus Clinical Characterisation Consortium.
P < .01.
The mortality rates separated into different epidemiological wave periods are shown in Table 2 and Figure 1B. The mortality rates in the second to sixth wave periods were significantly lower than in the first wave (all P < .05). When stratified by 4C mortality score risk group, the mortality rate in the second wave period of patients at low risk and the mortality rates in the second to sixth wave periods of patients at intermediate and high risk were significantly lower than those of the first wave periods (all P < .05). The mortality rate of patients at very high risk was significantly lower in the sixth wave period than in the first wave period (P < .05).
Mortality Rates of Patients With Coronavirus Disease 2019 by Epidemiological Wave Period, Stratified by 4C Mortality Score Risk Group
| 4C Mortality Score Risk Group | Epidemiological Wave Period | Overall | |||||
|---|---|---|---|---|---|---|---|
| First | Second | Third | Fourth | Fifth | Sixth | ||
| All 4C score | 7.3% (388/5289) | 2.4%a (215/8881) | 6.0%a (1165/19 326) | 5.4%a (437/8064) | 2.4%a (187/7855) | 0.58%a (6/1030) | 4.8% (2398/50 455) |
| Low (0–3) | 0.13% (3/2332) | 0%b (0/5085) | 0.12% (8/6637) | 0.10% (3/2931) | 0.045% (2/4442) | 0% (0/488) | 0.073% (16/21 915) |
| Intermediate (4–8) | 3.3% (57/1707) | 1.2%a (28/2338) | 2.5%b (173/7055) | 2.3%b (72/3105) | 1.8%a (46/2562) | 0.31%a (1/325) | 2.2% (374/17 102) |
| High (9–14) | 24% (283/1163) | 12%a (161/1383) | 16%a (870/5402) | 17%a (329/1970) | 15%a (124/825) | 2.4%a (5/121) | 16% (1772/10 955) |
| Very high (15–21) | 52% (45/87) | 45% (29/65) | 49% (114/232) | 57% (33/58) | 58% (15/26) | 0%b (0/5) | 50% (236/473) |
Numbers indicate number of deaths/total number of patients (%). P values for the second to sixth waves were assessed by χ2 test compared with the first wave.
Abbreviation: 4C, Coronavirus Clinical Characterisation Consortium.
P < .01.
P < .05.
The mortality rates separated into different epidemiological wave periods and subdivided into patients aged <75 years and ≥75 years are shown in Figure 1C and Table 3, and Figure 1D and Table 4, respectively. The overall mortality rates of patients aged <75 years and ≥75 years were both significantly lower in Japan than in the UK (all P < .05) (Figure 1C and 1D and Tables 3 and 4). When stratified by 4C mortality score risk group and separated into epidemiological periods, the mortality rates of patients aged ≥75 years at intermediate and very high risk in the first wave period showed no significant differences from those in the UK (all P > .05) (Figure 1C and Table 3). The mortality rates both of patients aged <75 years and those aged ≥75 years at very high risk in the fourth and fifth wave periods also showed no significant differences from those in the UK (all P > .05) (Figure 1C and 1D and Tables 3 and 4). On the other hand, the mortality rate of patients aged ≥75 years at very high risk in the sixth wave period was significantly lower in Japan than in the UK (P < .05) (Figure 1D and Table 4).
Mortality Rates of Patients With Coronavirus Disease 2019 by Epidemiological Wave Period, Stratified by 4C Mortality Score Risk Group in Patients Aged <75 Years
| 4C Mortality Score Risk Group | Epidemiological Wave Period | Overall | United Kingdom | |||||
|---|---|---|---|---|---|---|---|---|
| First | Second | Third | Fourth | Fifth | Sixth | |||
| All 4C score | 3.1%a (128/4162) | .64%a (46/7241) | 1.7%a (222/13 009) | 1.8%a (107/5876) | 1.4%a (92/6671) | 0%a (0/643) | 1.6%a (595/37 602) | 31.3% (18 155/57 924) |
| Low (0–3) | .13%a (3/2240) | 0%a (0/4816) | .14%a (8/6114) | .11%a (3/2665) | .051%a (2/3955) | 0%b (0/386) | .079%a (16/20 176) | 1.5% (65/4224) |
| Intermediate (4–8) | 2.8%a (41/1482) | .86%a (17/1979) | 1.4%a (76/5424) | 1.6%a (40/2521) | 1.7%a (40/2351) | 0%a (0/220) | 1.5%a (214/13 977) | 9.4% (1237/13 166) |
| High (9–14) | 19%a (81/428) | 6.2%a (27/436) | 8.8%a (126/1439) | 8.8%a (60/680) | 13%a (46/358) | 0%a (0/37) | 10%a (340/3378) | 34% (9976/29 755) |
| Very high (15–21) | 25%a (3/12) | 20%a (2/10) | 38%a (12/32) | 40% (4/10) | 57% (4/7) | 0/0 | 35%a (25/71) | 6877/10 679 (64%) |
Numbers indicate number of deaths/total number of patients (%). P values were assessed by χ2 test compared with the reported data from the United Kingdom.
Abbreviation: 4C, Coronavirus Clinical Characterisation Consortium.
P < .01.
P < .05.
Mortality Rates of Patients With Coronavirus Disease 2019 by Epidemiological Wave Period, Stratified by 4C Mortality Score Risk Group in Patients Aged ≥75 Years
| 4C Mortality Score Risk Group | Epidemiological Wave Period | Overall | United Kingdom | |||||
|---|---|---|---|---|---|---|---|---|
| First | Second | Third | Fourth | Fifth | Sixth | |||
| All 4C score | 25%a (260/1032) | 12%a (169/1368) | 16%a (943/5789) | 17%a (330/1921) | 14%a (95/694) | 2.1%a (6/258) | 16%a (1803/11 089) | 31% (18 155/57 924) |
| Low (0–3) | 0/0 | 0/0 | 0/0 | 0/0 | 0/0 | 0/0 | 0/0 | 1.5% (65/4224) |
| Intermediate (4–8) | 7.2% (16/222) | 2.2%a (8/366) | 6.0%a (97/1626) | 5.5%a (32/583) | 2.9%a (6/208) | .95%a (1/105) | 5.1%a (160/3110) | 9.4% (1237/13 166) |
| High (9–14) | 27%a (202/735) | 14%a (134/947) | 19%a (744/3963) | 21%a (269/1290) | 17%a (78/467) | 2.9%a (5/175) | 19%a (1432/7577) | 34% (9976/29 755) |
| Very high (15–21) | 56% (42/75) | 49%b (27/55) | 51%a (102/200) | 60% (29/48) | 58% (11/19) | 0%a (0/5) | 52%a (211/402) | 64% (6877/10 679) |
Numbers indicate number of deaths/total number of patients (%). P values were assessed by χ2 test compared with the reported data from the United Kingdom.
Abbreviation: 4C, Coronavirus Clinical Characterisation Consortium.
P < .01.
P < .05.
DISCUSSION
The present analysis showed that mortality rates of COVID-19 patients in all age groups <90 years were significantly lower in Japan than in the UK during the first epidemic wave period, regardless of 4C score risk group. In Japan, all elderly COVID-19 patients were actively hospitalized regardless of symptomatic severity [3, 7]. Since early supportive care may prevent severe outcomes in elderly COVID-19 patients [20], this policy may have reduced the mortality of elderly COVID-19 patients in Japan. Furthermore, the present analysis showed that the overall mortality rates were significantly lower in the second to fifth wave periods than in the first wave period. Throughout the present study period, posthospitalization treatment in Japan evolved. As the understanding of the pathogenesis of COVID-19 improved, more effective treatments including corticosteroids, remdesivir, and anticoagulants were introduced after the second wave period [3, 12]. Matsunaga et al reported the results of the nationwide COVID-19 cohort in Japan [3]. Of the first 3 waves prior to the widespread use of vaccination, the mortality rates in Japan were highest in patients aged >65 years in the first wave period [3]. Pharmacological treatments including corticosteroids in combination with antivirals reduce the mortality risk of elderly COVID-19 patients [20]. The severity of COVID-19 varies by SARS-CoV-2 variants [13, 21]. In addition, the present analysis showed that mortality rates of patients aged ≥90 years at very high risk were not significantly different in Japan from those in the UK. When separated into different epidemiological wave periods, mortality rates of patients at very high risk in the second to fifth wave periods did not differ significantly from that in the first wave. The mortality rate of patients at very high risk in the fourth and fifth wave periods were not significantly different in Japan from those in the UK. This may suggest that advances in treatments such as hospitalization, careful supportive care, and widespread application of steroids and remdesivir did not contribute to the improvement in the prognosis of very high-risk patients, especially those aged ≥75 years prior to the sixth wave period.
During the sixth wave period in Japan, COVID-19 patients were infected predominantly with the Omicron variant [19]. Previous reports have suggested significantly lower severity and mortality risk for COVID-19 patients infected with the Omicron variant compared to other variants [13, 21]. In addition, the medical situation in the sixth wave period in Japan surrounding the COVID-19 pandemic also changed rapidly with the increased accessibility of oral antivirals, neutralizing antibodies, and vaccines. Such factors may have been associate with the significantly low mortality rate of patients in Japan during the sixth wave period, seen even in patients aged ≥75 years at very high risk.
The present research has some limitations. First, an exact comparison of mortality rates of COVID-19 patients in Japan and in the UK in each epidemic wave period is not possible because the data from the UK were based only on the early stage of the epidemic. Second, the sample size in the sixth wave period was limited, although it included all the patients registered in COVIREGI-JP by 1 February 2022. Third, the present study did not assess the independent effects of influential factors, including true differences in the pathogenicity of each variant, or changes in treatment and vaccination rates. Systematic surveillance is still necessary for rapid detection and characterization of new variants with increased virulence and/or resistance to current treatments and vaccines. Nevertheless, the mortality rate in COVID-19 patients has dropped to an unprecedented level in the current epidemiological wave period driven by the Omicron variant.
In conclusion, the present study showed the effects of 4C mortality score risk group, age group, and wave period on mortality from COVID-19 in Japan. Further analysis based on other factors such as treatment, vaccination, and viral mutation is needed to develop strategies to further reduce mortality.
Notes
Author contributions. H. B., S. I., T. I., E. K., and T. U. designed the study. Y. A., N. M., and N. O. contributed to data collection. H. B., S. I., S. A., T. I., E. K., and T. U. analyzed the data. H. B., with support from S. I., T. I., H. K., K. T., E. K., and T. U., wrote the manuscript. T. U. supervised the findings of this work. All authors discussed the results and contributed to the final manuscript.
Patient consent. The present study was approved by the institutional review board of Tohoku University Graduate School of Medicine (IRB number 2021–1–1223) and the National Center for Global Health and Medicine ethics review (NCGM-G-003494–0). Information regarding opting out of the study is available on the registry website (https://COVID-registry.ncgm.go.jp).
Financial support. I. S. and T. U. were supported by the Japan Science and Technology Agency (JST) Core Research for Evolutional Science and Technology (CREST) (grant number JPMJCR15D1). T. I. was supported by the Japan Society for the Promotion of Science (KAKENHI grant numbers JP20K21837 and JP21K02356). E. K. was supported by JST Moonshot R&D (grant number JPMJMS2025), JST CREST (grant number JPMJCR20H4), and the Japan Agency for Medical Research and Development (grant numbers JP21wm0325007, JP20fk0108412, JP20fk0108413, and JP21gm5010003).
All authors have submitted the ICMJE Form for Disclosure of Potential Conflicts of Interest. Conflicts that the editors consider relevant to the content of the manuscript have been disclosed.
References
Author notes
Potential conflicts of interest. All authors: No reported conflicts.


Comments