


Abstract
Isoniazid (INH) preventative therapy is recommended for people with HIV (PWH) in resource-constrained settings. Valid measures are needed to assess adherence. We aimed to examine agreement between measures overall and by level of social desirability.
PWH with latent tuberculosis (TB) were recruited in Mbarara, Uganda. Past 30-day adherence was measured by the number of days with pill bottle openings using a medication event monitoring system (MEMS) and self-reported number of days pills taken. INH concentration (INH plus acetyl INH and their ratio) in hair samples was measured. We used Bland-Altman plots to examine agreement between adherence measures and calculated the area under the receiver operating characteristics curve (AUROC) to determine if INH hair concentration predicted optimal MEMS-measured adherence (≥90%).
A total of 301 participants enrolled; 92% were virologically suppressed, and adherence was high. The median (interquartile range [IQR]) number of pill bottle openings in 30 days was 28 (24–30) compared with 30 (28–30) via self-report. The median INH concentration (IQR) was 36.2 (17.2–62.4), and the INH:acetyl ratio was 2.43 (0.99–3.92). Agreement between self-reported and MEMS adherence was greater at more optimal adherence levels. INH:acetyl INH ratio was not predictive of optimal adherence according to MEMS (AUROC, 0.62; 95% CI, 0.52–0.72) in a subset (n = 161).
Lower MEMS adherence levels compared with self-report suggest the need for objective adherence measures. Biologic measures have potential, although in this study INH concentration was not predictive of MEMS measured adherence. More data are needed to assess the accuracy of biologic measures.
Tuberculosis (TB) is one of the leading causes of death worldwide from an infectious disease, particularly impacting people with HIV (PWH). Of the 1.2 million TB deaths in 2019, 208 000 were among PWH [1]. In addition to primary progression from infection to disease, TB disease may result from the reactivation of latent TB infection (LTBI), occurring more often in PWH compared with those without HIV [2]. Isoniazid (INH) preventative therapy (IPT) has been shown to effectively lower the rates of active TB disease among PWH, including among populations already on antiretroviral therapy (ART) [3]. Due to the high risks for TB disease and mortality and IPT efficacy, the World Health Organization (WHO) recommends 6 months of IPT for all PWH in resource-constrained settings [4].
Medication adherence is a key component of treatment programs, as many medications require a full course to be effective [5]. Much of the adherence research among PWH has focused on ART adherence. Less is known about adherence to IPT, which differs from ART; ART is lifelong and is treatment of disease, while IPT is given for a shorter treatment period and to prevent disease. Valid adherence measures are key to examining IPT. However, there is no gold standard for measuring adherence [6]; neither is there an easily measurable clinical outcome. Directly observed therapy is a possible gold standard adherence measure, but it is hard to implement widely and reliably and impedes privacy and autonomy.
Self-report, the most commonly used medication adherence measure, is cost-effective and easy to collect [7]. However, it is not objective, and its reliability varies by study population and circumstances. For instance, social desirability and recall biases can lead people to over-report adherence when compared with other measures [8].
Medical event monitoring systems (MEMS), which electronically record the number of pill bottle openings, have often been used as an objective measure of adherence [9]. MEMS measures have been highly predictive of HIV viral suppression for ART [10] and are not subject to recall bias. However, individuals may take out >1 pill or open the bottle and take no pills [7], actions that are sometimes due to social desirability bias.
Lastly, INH concentration in hair may be a more objective measure of pill-taking [11]. Prior research has shown that antiretroviral hair levels were predictive of virologic outcomes for HIV treatment [12, 13] and viral suppression [14]. A proof-of-concept study among children with tuberculosis found a median isoniazid concentration of 9 ng/mg, showing that measuring INH in hair is possible [15], and collection has been found to be feasible in East Africa, where a study collected hair samples from 95% of participants [16]. The advantages of this method include hair's ability to hold drug concentrations for weeks to months and the relative ease by which hair is collected. However, measuring INH in hair can be costly, requiring sophisticated laboratory assays, and the validity of INH levels in hair has not been extensively studied.
We conducted the Alcohol Drinkers’ Exposure to Preventive Therapy for TB (ADEPTT) study to determine the risk of liver toxicity and level of adherence in PWH who engage in unhealthy alcohol use during a 6-month course of IPT, as this population is at high risk for TB disease. Prior research on ART adherence has shown that alcohol use is a barrier to adherence [17], leads to poor outcomes, and is a “major contributor to the tuberculosis burden of disease” [18]. In addition, we found poorer medication adherence at higher alcohol use categories in this cohort [19]. We therefore sought to assess agreement between 3 measures of IPT adherence (MEMS, self-report, and INH hair concentration) in a PWH population with a high proportion of unhealthy alcohol use. Lastly, in exploratory analyses, we assessed whether agreement between measures varied by levels of a social desirability scale, by gender, and by alcohol use.
METHODS
Study Population and Procedures
The ADEPTT study (NCT03302299) enrolled PWH with LTBI (identified via positive tuberculin skin test [TST] ≥5 mm within 72 hours of placement) who were patients at the Immune Suppression Syndrome Clinic of Mbarara Regional Hospital from April 2017 to March 2021. The main aim of the study was to compare the rate of hepatotoxicity to INH among those who reported prior 3-month alcohol use with those who abstained from such use in a 2:1 ratio. Patients were eligible for further screening if they were age ≥18, on an ART regimen for ≥6 months, not previously treated with anti-TB or TB preventive medication, not on nevirapine, not currently pregnant, had alanine transaminase (ALT) and aspartate transaminase (AST) levels ≤2 times the upper limit of normal (ULN), were not taking anticonvulsant medications, and showed no evidence of active TB disease. Active TB was ruled out via a symptom screen. Those with 1 of 4 symptoms (current cough, fevers, weight loss, or night sweats) were further assessed for TB via chest x-ray and sputum testing. Those with LTBI were invited to enroll in the study. We enrolled 201 PWH who reported any prior 3-month alcohol use and 100 PWH who reported abstaining from alcohol for ≥1 year.
Participant follow-up visits were once every 2 weeks for the first month, and then monthly thereafter until the completion of the 6-month IPT course of treatment (up to 9 months). At each follow-up visit, we conducted monitoring for both toxicity and adherence. If a participant at any time during the study developed a grade 3 or 4 adverse event, defined as ALT or AST ≥5 times the ULN or grade 3 or 4 symptoms [20], IPT was stopped. At the baseline, 3-month, and 6-month visits, we conducted an interviewer-administered questionnaire; baseline questions included demographics, alcohol use, and ART adherence; the 3- and 6-month visits additionally asked about INH adherence.
Specimen Collection and Testing
We collected blood for viral load testing, creatinine, platelets, hepatitis B, CD4, and complete blood counts at baseline, and for ALT and AST levels at monthly follow-up visits. Blood was also pipetted onto dried blood spots (DBS) at baseline, 3 months, and 6 months to test for phosphatidylethanol (PEth; an alcohol biomarker). DBS were tested for PEth concentrations (16:0/18:1 homologue) using previously published methods [21] via liquid chromatography with tandem mass spectrometry (LC-MS/MS) at the US Drug Testing Laboratory in Des Plaines, Illinois. We tested all baseline specimens, and for follow-up, we selectively tested specimens for participants who self-reported any alcohol use or tested PEth positive (≥8 ng/mL) at any visit.
We asked participants not to shave or cut their hair for 1 month before their 3- and 6-month study visits. We collected ∼20 strands (10–20 mg) of hair at each visit, cutting as close to the scalp as possible; we wrapped the hair sample in foil, sealed it in a Ziploc bag, and stored it at room temperature until it was batch-shipped to the Hair Analytical Lab at the University of California, San Francisco. Once there, we (R.A. and A.R.R.) extracted and quantified INH and acetyl INH (a metabolite that is dependent on host acetylation status) in the hair samples using the isotope dilution method (internal standards: INH-d4 and acetyl-INH-d4) by LC-MS/MS [22, 23].
Measures of Adherence
The data for this analysis were collected at the 3- and 6-month follow-up visits, at which INH adherence was measured in the following 3 ways.
Medication Event Monitoring System
We distributed electronic pill bottles to each participant at the start of their INH course (“MEMS Cap,” AARDEX). The pill bottle cap records the date and time of each pill bottle opening. At study visits, we downloaded data from the MEMS and calculated the number and percentage of days in the last 30 days with ≥1 opening.
Self-Report
At the 3- and 6-month follow-up visits, participants were asked “In the past 30 days, how many days in total have you not taken your pill?” and were presented with a visual analog scale (VAS) to indicate the percentage of medication taken in the past 30 days. For this analysis, we converted the VAS percentage into number of days out of 30 to match the first question. Because prior evidence suggests that people are more likely to over-report, rather than under-report, their adherence, our final self-report measure, was the minimum number of the 2 self-reported measurements.
HAIR Analysis
Our INH hair concentration measures were the sum of the number of pmol INH and pmol acetyl INH per mg of hair and the ratio of INH to acetyl INH. INH is metabolized into acetyl INH at different rates depending on the acetylation status (which is a genetic trait) of individuals. Based on previous work by other groups, we thereby decided to measure both INH and the acetyl INH ratio in this paper to determine if acetylation status was related to outcomes [24]. We had funding to analyze the first shipped batch (n = 161 total visits, representing 97 unique participants), collected August 2017 to August 2018, and analyzed in January 2019. We have done stability studies in our laboratory showing that drug levels in hair are stable for ≥5 years. While hair collection was occurring, we successfully collected hair samples at all but 2 visits where hair collection was expected.
Other Variables
We dichotomized social desirability at the median, measured using the Marlowe Crowne Social Desirability Scale. This scale measures the level to which respondents are concerned with social approval [25]. PWH with an Alcohol Use Disorders Identification Test–Consumption (AUDIT-C) [26] score of ≥3 (women) or ≥4 (men) and/or PEth ≥50 ng/mL [27] were considered to have engaged in unhealthy alcohol use, while those with a PEth level of ≥8 ng/mL, or who self-reported any alcohol use, were categorized as any/not unhealthy alcohol users, and those with a PEth level of <8 ng/mL were categorized as abstainers.
Statistical Analysis
We calculated descriptive statistics (frequencies and means/medians) of baseline demographic variables and self-reported adherence, MEMS concentrations, and hair INH concentrations at 3 and 6 months.
Agreement Between Measures: Bland Altman
Self-reported adherence and MEMS adherence were continuous measurements on the same scale (number of days). We assessed the agreement between the 2 measures using a Bland-Altman plot, in which the difference between 2 measures (bias) is plotted against the average of the measures (magnitude) [28]. We calculated the Pearson correlation coefficient to assess the strength of the association between the bias and magnitude. In addition, we assessed the mean difference between the 2 measures using a paired t test.
Area Under the Curve
Because INH concentration in hair is on a different scale than both self-report and MEMS, we could not directly compare its agreement with these 2 measures. Instead, we investigated whether INH concentration is predictive of optimal adherence. For this purpose, MEMS was categorized as suboptimal (<90% of days with ≥1 pill bottle opening) vs optimal (≥90% of days) adherence. The 90% threshold for optimal adherence was set a priori as a clinically relevant cutoff point. We fit logistic regression models to calculate the areas under the receiver operating characteristics curve (AUROCs), which determine how accurately a continuous predictor (INH concentration measured by INH and acetyl INH sum and ratio) predicts a dichotomous outcome (optimal adherence) [29]. We visually compared the distribution of INH concentration measures using side-by-side histograms dichotomized by optimal vs suboptimal MEMS adherence.
RESULTS
After screening, 308 participants were eligible. Three hundred one completed a baseline interview and were included in this analysis. Participants’ mean age was 41, 51% were female, and 27% had more than a primary education (Table 1). Half of the sample engaged in unhealthy alcohol use, 21% engaged in alcohol use but not at unhealthy levels, and 29% abstained from drinking for the past 3 months. The mean time since HIV diagnosis was 8 years; 92% had an undetectable viral load (<40 copies/mL). Throughout the course of the study, there were 37 adverse events.
Study Participant Characteristics at Baseline (n = 301)
| No. (%) | |
|---|---|
| Age, median (IQR), y | 40 (33–47) |
| Gender | … |
| Female | 154 (51.2) |
| Male | 147 (48.8) |
| More than a primary education | … |
| No | 220 (73.1) |
| Yes | 81 (26.9) |
| Married | … |
| No | 100 (33.3) |
| Yes | 200 (66.7) |
| Literacy (able to read full sentences) | … |
| No | 83 (27.6) |
| Yes | 218 (72.4) |
| AST value, median (IQR) | 32 (25–40) |
| ALT value, median (IQR) | 28 (22–38) |
| Self-reported ART adherence, prior 30 d | … |
| Excellent | 164 (54.5) |
| Very good | 81 (26.9) |
| Good | 51 (16.9) |
| Fair | 3 (1.0) |
| Poor | 1 (0.3) |
| Very poor | 1 (0.3) |
| Social Desirability Score, median (IQR) | 20 (18–22) |
| Self-reported alcohol use (any in the prior 3 mo) | … |
| No | 100 (33) |
| Yes | 201 (67) |
| Alcohol use (combination of self-report, Audit-C, and PEth) | … |
| Abstainer | 86 (28.6) |
| Any, not unhealthy | 66 (21.9) |
| Unhealthy | 149 (49.5) |
| Time since HIV diagnosis, median (IQR), y | 7.16 (5.05–11.40) |
| Undetectable viral load | … |
| No | 23 (7.9) |
| Yes | 269 (92) |
Abbreviations: ALT, alanine transaminase; ART, antiretroviral therapy; AST, aspartate transaminase; IQR, interquartile range.
At 3 months, the median number of days with a MEMS pill bottle opening was 28 out of 30. This did not meaningfully change at 6 months, at which point the median number of days with an opening was 27. Combining the 3- and 6-month visits, the median MEMS-measured adherence (interquartile range [IQR]) was 28 (24–30) out of 30 days. Self-reported adherence was 30 days out of 30 at both the 3- and 6-month time points, and in the 30 days before the 3- and 6-month visits combined (IQR, 28–30). At 3 months, the median INH hair concentration was 36.0 pmol/mg and the INH:acetyl INH concentration ratio was 2.4, at 6 months it was 37.8 pmol/mg and the INH:acetyl INH concentration ratio was 2.5, and in the combined 3- and 6-month visits it was 36.2 pmol/mg (27.2–62.4) and the INH:acetyl INH concentration ratio was 2.4 (1.0–3.9) (Table 2).
Measures of Adherence
| Overall (3 Months and 6 Months Combined) | 3 Months | 6 Months | |
|---|---|---|---|
| Self-report: number of days taken in the past 30 d | … | … | … |
| No. | 553 | 285 | 268 |
| Median (IQR) | 30 (28–30) | 30 (28–30) | 30 (27–30) |
| Days with any MEMS cap opening in the past 30 d | … | … | … |
| No. | 537 | 276 | 261 |
| Median (IQR) | 28 (24–30) | 28 (25–30) | 27 (22–29) |
| Final INH result, inh pmol + acinh pmol | … | … | … |
| No. | 161 | 96 | 65 |
| Median (IQR) | 36.2 (17.2–62.4) | 36.0 (18.7–63.3) | 37.8 (13.7–60.4) |
| Final INH ratio, INH:acetyl INH | … | … | … |
| No. | 161 | 96 | 65 |
| Median (IQR) | 2.4 (1.0–3.9) | 2.4 (0.9–3.7) | 2.5 (1.1–4.6) |
Abbreviations: INH, isoniazid; IQR, interquartile range; MEMS, medication event monitoring system.
The Bland-Altman plot shows that the level of agreement between measures was lower, and the difference between MEMS and self-reported adherence larger, when the average of MEMS and self-reported adherence was lower (Figure 1). The correlation between bias (difference between methods) and magnitude (average of the methods) was moderate to high and statistically significant (Pearson correlation, −0.8; P < .0001). Most data points are above the reference line of 0, illustrating that self-reported adherence was often higher than MEMS adherence, which was confirmed with a paired t test (P < .001, data not shown).

Bland-Altman plot. Plot of the difference between self-reported adherence and MEMS adherence vs the mean of self-reported adherence and MEMS adherence. Including: a solid reference line for the mean of the difference, a larger dashed reference line for ±2 SDs of the mean of the difference, and a smaller dashed reference line for ±3 SDs of the mean of the difference. Abbreviation: MEMS, medication event monitoring system.
The logistic regression models predicting optimal MEMS adherence from the INH and acetyl INH sum yielded an AUC of 0.5 (95% CI, 0.4–0.6), and 0.6 (95% CI, 0.5–0.7) using the ratio. In descriptive analyses, the median INH plus acetyl INH sum (IQR) was not significantly different among those with optimal vs suboptimal MEMS adherence (37.8 [18.9–66.7] pmol/mg vs 45.9 [17.7–62.9] pmol/mg; P = .99), while the median INH:acetyl INH ratio (IQR) was lower for those with optimal vs suboptimal adherence (1.80 [0.85–3.64] vs 2.83 [1.34–4.90]; P = .02). The side-by-side histograms show that there is a lot of overlap in the distribution of INH hair concentrations between those who had optimal adherence (≥90%, 60% of the sample) and those who had suboptimal adherence (<90%) via MEMS. Although for the INH plus acetyl INH sum, there are some high INH concentration values in the optimal adherence group that are not in the suboptimal adherence group (Figure 2), and for the INH:acetyl INH ratio, there are some higher ratios in the suboptimal adherence group that are not in the optimal group (Figure 3).
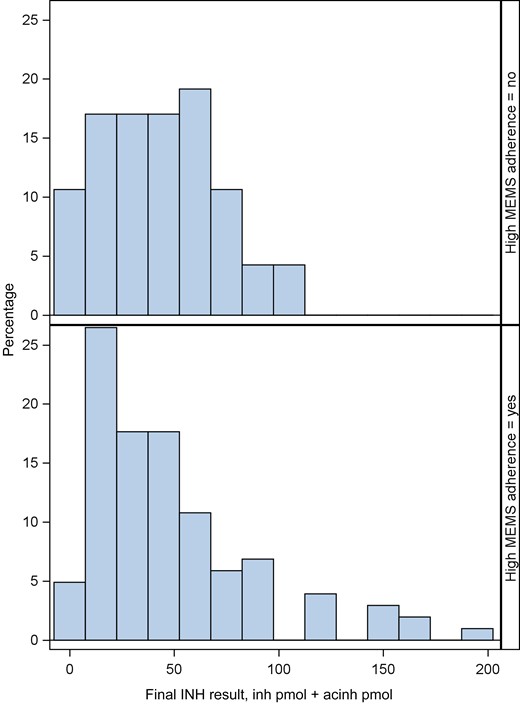
INH concentration (INH plus acetyl INH) among those with optimal (60%, n = 323; bottom panel) vs suboptimal (40%, n = 214; top panel) MEMS adherence (3- and 6-month visits combined). Abbreviations: INH, isoniazid; MEMS, medication event monitoring system.
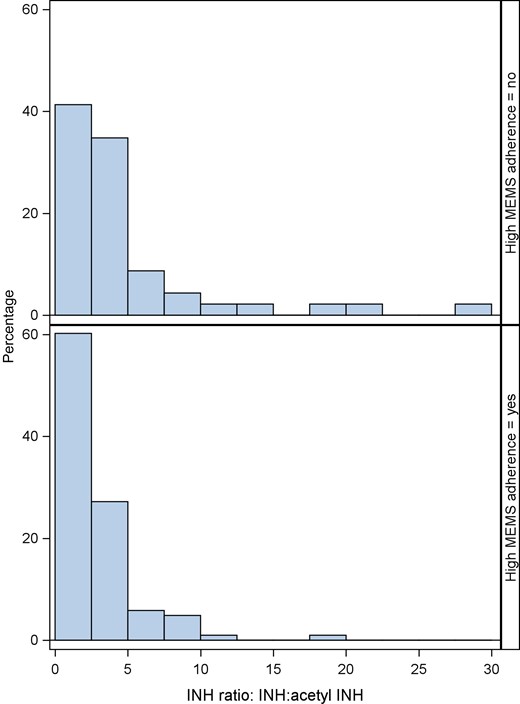
Ratio of INH:acetyl INH concentration among those with optimal (60%, n = 323 bottom panel) vs suboptimal (40%, n = 214 top panel) MEMS adherence (3- and 6-month visits combined). Abbreviations: INH, isoniazid; MEMS, medication event monitoring system.
In exploratory logistic regression analyses using the INH sum to predict MEMS adherence, we obtained similar results when stratifying by social desirability, gender, and level of alcohol use. Among females, the INH ratio yielded an AUC of 0.7 (95% CI, 0.5–0.8), while the AUC among males was lower and similar to the overall results (AUC, 0.5; 95% CI, 0.4–0.7). Among unhealthy drinkers, the INH ratio yielded an AUC of 0.6 (95% CI, 0.4–0.7), among not unhealthy drinkers, the INH ratio yielded an AUC of 0.7 (95% CI, 0.4–1.0), and among abstainers, the INH ratio yielded an AUC of 0.6 (95% CI, 0.4–0.9). The results stratified by social desirability were as follows: AUC, 0.7 (95% CI, 0.5–0.8) for those with high social desirability; and AUC, 0.6 (95% CI, 0.4–0.8) for those with not-high social desirability.
DISCUSSION
Our study found that self-reported INH adherence was consistently higher than MEMS adherence at both the 3- and 6-month time points in this population of PWH with a high proportion of unhealthy alcohol use. This overestimate was more prevalent in participants with less optimal adherence. These results are consistent with other studies concluding that self-reported measures tend to overestimate adherence when compared with electronic measures for several medical conditions [30].
For instance, self-reported measures of ART adherence have multiple limitations, including social desirability and recall bias [31], that often lead to over-reporting of adherence when compared with electronic measurements [32]. These biases may also be occurring in this study, as we found that agreement between self-report and MEMS was stronger at more optimal levels of reported adherence.
Poor adherence to preventative TB treatment is a major barrier to global TB control [5]. It is therefore notable that there was a lack of consistent agreement between self-reported and MEMS adherence in our study—agreement between the 2 measures was lower at less optimal levels of adherence. It is of note that we found discrepancies even in the setting of high viral suppression (92%); thus, we expected INH adherence to be high. Developing an objective, low-cost adherence measure against which these measures can be compared would help to accurately measure medication adherence in treatment studies.
The use of drug concentrations in hair samples has been extremely successful for monitoring ART adherence [13, 14, 33, 34], and the median INH:acetyl INH concentration ratio (2.4) in this study was consistent with INH concentrations found in previous studies [22]. However, the research into using INH concentration in hair for IPT adherence is nascent, expected thresholds to indicate optimal adherence have not yet been established, and we do not yet know if concentrations differ by level of alcohol use. In this study, we found wide variability in INH concentration in hair, and INH concentrations were not predictive of optimal medication adherence using MEMS as the gold standard measure. However, because we had a narrow range of adherence measured by MEMS (median, 28/30 days of pill-taking) and self-report (30/30 days), our sample was less than ideal for determining the validity of hair concentration as a measure of INH adherence. The ratios of INH to acetyl INH levels were higher in those with MEMS-measured suboptimal adherence, which was not what we were expecting. In exploratory analyses, we found that INH ratio was more predictive among females compared with males. Further work among subgroups, in addition to studying INH hair concentrations in populations with a wider range of adherence, will allow us to better assess this biologic metric.
Limitations
INH medication adherence in our study was high and relatively homogeneous according to both self-reported adherence and MEMS adherence, so we were unable to examine these metrics across a full range of adherence. In addition, self-reported prior 30-day adherence for this study was only collected at 3 and 6 months; thus, we may have missed some month-to-month variability in adherence. We also only analyzed hair samples from 33% of the sample at 3 months and 25% of the sample at 6 months, and therefore we were only able to assess agreement on a subset of participants, rather than the whole cohort. While ART adherence has a clear biologic end point (viral suppression), there is no parallel end point for IPT adherence. As a result, there is no relevant clinical measure against which we can measure IPT adherence, and we are therefore limited to comparing adherence measures with each other. In addition, while MEMS is considered a more objective measure than self-report, it is limited because it records pill bottle openings but does not record actual pill ingestion.
CONCLUSIONS
In conclusion, we show that self-reported adherence and MEMS adherence are highly correlated at optimal levels of adherence, but less so at the lower range of adherence, suggesting the limitations of self-report. INH concentrations were not good predictors of optimal MEMS adherence, but given the need for objective measures, further research into this marker is warranted. Valid measures are crucial components for measuring adherence to IPT, especially among PWH at high risk for TB. Electronic adherence measures are a popular substitute for self-report and are generally objective, although they cannot measure actual drug consumption. Biologic measurements, such as hair concentrations or point-of-care urine assays, allow for the assessment of pill-taking. However, a larger study over a wider range of adherence patterns is needed to examine the utility of INH concentrations as a metric of adherence to IPT.
Acknowledgments
Financial support. This work was supported by the National Institutes of Health (U01 AA020776, K24 AA022856, U24 AA020779).
Data availability. Data not publicly available.
Patient consent. The ADEPTT study activities were approved by the ethics review boards of Mbarara University of Science and Technology, University of California, San Francisco, and Boston University. Administrative approvals were also secured from the President's Office and the Ugandan National Council for Science and Technology and from ClinicalTrials.gov (NCT03302299). All study participants gave written informed consent.
References
Author notes
Potential conflicts of interest. All authors: no reported conflicts of interest. All authors have submitted the ICMJE Form for Disclosure of Potential Conflicts of Interest. Conflicts that the editors consider relevant to the content of the manuscript have been disclosed.


Comments