


Abstract
Liver disease remains a significant cause of morbidity and mortality in HIV-infected persons. Soluble CD163 is a marker of Kupffer cell activation that is highly associated with development of hepatic fibrosis. The relative contributions of HIV-associated systemic immune activation vs other etiologies of injury are poorly characterized.
We utilized subjects in the Miami Adult Studies on HIV (MASH) cohort to evaluate 464 participants including 361 people with HIV (PWH) and 103 hepatitis C virus (HCV)/HIV-uninfected controls. Subjects underwent testing for hepatic fibrosis using both magnetic resonance elastography and the Enhanced Liver Fibrosis Index. Steatosis was evaluated by magnetic resonance imaging–derived proton density fat fraction. Immune activation markers and cytokines were quantitated using Luminex methodologies.
Participants with HIV with or without HCV coinfection had higher levels of sCD163 than uninfected controls (P < .05). Soluble sCD163 was highly associated with elevated alanine aminotransferase, a key marker of inflammation/injury and with hepatic fibrosis. Hepatic steatosis was also associated with a cytokine pattern suggestive of Kupffer cell activation but was not associated with an increase in sCD14 or sCD27.
Injury and resultant hepatic fibrosis occur by distinct though overlapping mechanistic pathways. In PWH, sCD163 is highly associated with both injury and fibrosis, suggesting that persistent systemic immune activation is a major contributor to long-term outcomes, adding to damage caused by alcohol, steatosis, and other hepatotoxic drug effects.
In people with HIV (PWH), liver disease is the result of a complex and interwoven set of etiologies that contribute to liver injury and fibrosis formation. Tight junctions in the gut are injured early in HIV infection, resulting in leakage of endotoxin, also known as lipopolysaccharide (LPS) [1]. Before development of significant fibrosis, gut-derived products enter the splanchnic circulation and pass through the liver before distribution throughout the body. The presence of resident macrophages (Kupffer cells) that line the hepatic sinusoids leads to their activation following exposure to endotoxin. This activation creates a cascade of cytokines that contribute to development of hepatic inflammation and progression to hepatic fibrosis. Activation of Kupffer cells is associated with production and excretion of soluble CD163 [2, 3].
sCD163 has been associated with increased hepatic fibrosis in PWH including those with hepatitis C virus (HCV)/HIV coinfection [4]. However, in the complex milieu of competing liver etiologies, it is unclear if mechanistic pathways of injury are the same. We examined the relationship of sCD163 with the presence of other inflammatory cytokine markers, as well as associations related to the use of alcohol, opioids, and cocaine. We postulated that these factors may differentially impact macrophage activation and increase the risk of hepatic injury in PWH by that pathway. Steatosis (both alcohol-related and non-alcohol-related) leading to steatohepatitis may represent an alternate pathway of injury, mediated through increased reactive oxygen species and marked by hepatocellular ballooning. The interplay between these factors remains poorly characterized, particularly in PWH.
METHODS
Patient Cohort
The Miami Adult Studies on HIV (MASH) cohort is a longitudinal National Institute on Drug Abuse (NIDA)–funded cohort that was established to study the effects of substance abuse on PWH. It includes enrollees with HIV, HCV/HIV coinfection, and uninfected controls. The majority of subjects who are HIV infected are on combination antiretroviral therapies (cARTs), and HBV infection is an exclusion criterion. Patients receive baseline clinical, laboratory, and research assessments, including standardized instruments assessing alcohol and drug use, and are followed at 6-month intervals, at which time all assessments are repeated. Samples for biomarkers and other research parameters were processed and frozen for later analysis at each time point. All cohort enrollees provided informed consent, and the protocol was approved by the institutional review board (IRB) at Florida International University.
Measures of Hepatic Fibrosis and Steatosis
Magnetic resonance elastography (MRE) was conducted using a 3T Siemens MAGNETOM Prisma MRI. The mean stiffness of the liver was calculated through an inversion algorithm that generates elastogram/stiffness maps of the tissue in kilopascals (kPa). Thresholds of 3.0, 3.7, and 4.5 kPa were used for diagnosing presence of fibrosis, advanced fibrosis, and cirrhosis, respectively [5]. The proton density fat fraction (PDFF) was also determined on the same instrument, and levels >5% were reported as steatosis (fatty liver). This analysis utilized baseline samples and MRE with PDFF obtained shortly after cohort entry. The Enhanced Liver Fibrosis (ELF) Index is based upon an algorithm that utilizes plasma-derived values for hyaluronic acid (HA), tissue inhibitor of metalloproteinase (TIMP-1), and Human Procollagen III (PIIINP) levels calculated as follows: [ELF Index = −7.412 + (ln (HA) × 0.681) + (ln(PIIINP) × 0.775) + (ln(TIMP1) × 0.494) + 10]. Levels were quantified using the following assays: Human PIIINP ELISA Kit (Cloud-Clone Corp), Human HA Quantikine ELISA kit (R&D Systems), and Human TIMP-1 ELISA (Abcam). Fibrosis stage determination utilized validated cut-points [6]. The validation of concordance between these assays has been published [7]. Recently, the first large-scale assessment of ELF compared directly with liver histology confirmed the superiority of ELF compared with other less sensitive biomarkers of fibrosis among PWH [6].
Cytokine/Chemokine Analysis
Cytokines and chemokines in the plasma of MASH enrollees were quantified in plasma samples collected at baseline. Included were transforming growth factor (TGF) beta, tumor necrosis factor alpha, macrophage inflammatory protein (MIP-1) (alpha and beta), interferon (IFN) alpha 2, IFN gamma, interleukin (IL)-1 beta, IL-4, IL-6, IL-8, IL-10, IL-12p70, IL-13, IL-17, IL-22, IL-33, Regulated upon Activation, Normal T cell Expressed, and Secreted (Rantes), monokine induced by interferon-gamma (MIG), granulocyte chemotactic protein (GCP)-2, interferoninducible T-cell alpha chemoattractant (ITAC), interferon γ-induced protein (IP)-10, and monocyte chemoattractant protein (MCP)-1. Briefly, immune markers were quantified by analyte-specific bead-based Luminex multiplex immunoassays (EMD Millipore Corporation). The mean fluorescence intensity for each analyte was detected on a flow-based Luminex platform. Luminex was also used to determine levels of sCD14, sCD27, and sCD163. Concentrations were calculated using a standard curve derived from the known reference concentration supplied by the manufacturer. Concentrations below the sensitivity limit of detection (LOD) of the method were coded as a decimal unit below the LOD value.
Measures of Alcohol and Cocaine Use
The standardized Alcohol Use Disorders Identification Test (AUDIT) instrument was utilized to identify alcohol misuse and hazardous alcohol drinking among study participants. Hazardous drinking was defined as an AUDIT score of ≥8. Cocaine and opioid use were evaluated by both patient report and detection of cocaine and opioids by plasma testing methods.
Statistical Analysis
Relevant groups were compared with regard to demographic characteristics using parametric and nonparametric methods suitable for the data type. Analysis of variance (ANOVA) and stepwise linear regression models were utilized to determine relative contributions of factors associated with described outcomes. A P value of alpha <.05 was used for significance. Log-transformations were performed for all cytokines evaluated. Analysis was performed using Statistix 10.0 software (Tallahassee, FL, USA). The Spearman correlation coefficient was used to assess pairwise correlation between cytokine levels and immune activation marker log-transformed levels. Cluster analysis was applied to the correlation coefficient matrix to identify clusters of cytokines. GraphPad Prism, version 8 (San Diego, CA, USA), and a web-enabled heat mapping software were used for analysis [8].
RESULTS
Data were available on 470 unique individuals enrolled in the MASH cohort. The mean age (range) was 53 (28–78) years. The majority were Black, non-Hispanic (64.5%), followed by White, Hispanic (20.6%); 360 participants were infected with HIV (76.8%), and 19.6% had hepatitis C infection, mostly in conjunction with HIV infection. The majority (~99%) of the HIV population received antiretroviral therapy, with 78% of HIV-monoinfected persons achieving viral suppression and HCV/HIV-coinfected individuals achieving 75% undetectable HIV. This is reflected by the very low median HIV viral loads observed. Hepatitis B infection was excluded. Table 1 shows the breakdown for those with HIV only, HCV/HIV coinfection, and controls (uninfected with either virus). As only 6 subjects had HCV alone, these were excluded from further analysis.
Baseline Demographic Characteristics of the Study Population
| Characteristic | All (n = 464) | HIV (n = 275) | HCV/HIV (n = 86) | Uninfected (n = 103) | P Value |
|---|---|---|---|---|---|
| Mean age, y | 53.2 | 53.1 | 53.5 | 53.2 | .36 |
| (Range) | (23–78) | (23–78) | (27–74) | (26–68) | |
| Male sex, No. (%) | 270 (58) | 166 (60) | 54 (63) | 50 (49) | |
| Race/ethnicity, No. (%) | |||||
| White, non-Hispanic | 35 (7.5) | 16 (5.8) | 10 (11.6) | 9 (8.7) | .09 |
| Black, non-Hispanic | 299 (64.4) | 183 (66.5) | 51 (59.3) | 65 (63.1) | |
| White, Hispanic | 97 (20.9) | 56 (20.4) | 19 (22.1) | 22 (21.4) | |
| Black, Hispanic | 10 (2.2) | 2 (0.7) | 4 (4.7) | 4 (3.9) | |
| Other | 23 (5.0) | 18 (6.5) | 2 (2.3) | 3 (2.9) | |
| Median BMI, kg/m2 | 28.45 | 28.5 | 27.25 | 29.6 | |
| Median HIV VL, copies/mL | 19 | 19 | NA | ||
| Mean ALT | 24.5 | 22.2 | 34.4 | 20.7 | .17 |
| Mean CD4 | 600 | 604 | 588 | N/A | .69 |
| Median MRE score | 2.12 | 2.13 | 2.62 | 2.01 | |
| Median ELF score | 9.09 | 9.02 | 9.54 | 9.01 | |
| % steatosis (>5% fat) | 15.1 | 13.8 | 10.9 | 21.1 | |
| % substance abuse | |||||
| Cocaine | 45.5 | 44 | 45.3 | 49. | |
| Heroin | 10.6 | 9.8 | 17.4 | 6.8 | |
| Opioid | 20.5 | 21.1 | 25.6 | 14.6 |
Abbreviations: ALT, alanine aminotransferase; BMI, body mass index; ELF, Enhanced Liver Fibrosis Index; MRE, magnetic resonance elastography; VL, viral load.
Figure 1 shows the relationship between disease classification and sCD163, sCD14, and sCD27 levels. One-way ANOVA demonstrates significant differences between group means (P < .0001), with the highest levels seen in sCD163 in those coinfected with HCV/HIV. Individually, HIV-monoinfected individuals have higher sCD163 levels than uninfected controls (mean, 659 ng/mL vs 559 ng/mL; P = .016), as do HCV/HIV-coinfected individuals (mean, 917 ng/mL vs 559 ng/mL; P < .0001). In the coinfected group, Caucasians had higher levels than those seen in Black, non-Hispanic enrollees (1472 ng/mL vs 792 ng/mL; P < .03). Similar group differences were noted for sCD14 and sCD27 (Figure 1).
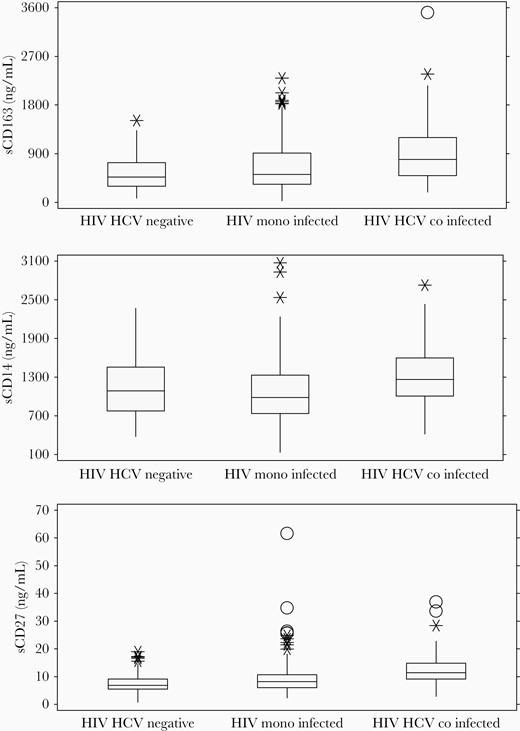
sCD163, sCD14, and sCD27 levels by disease classification group. Shown are median values and interquartile ranges. *Possible outliers (±1.5 IQR). OProbable outliers (±3.0 IQR). Abbreviation: IQR, interquartile range.
The relationship of hepatic fibrosis and inflammation to sCD163 was examined using several parameters. Soluble CD163 was elevated, with advanced fibrosis (mean, 1328 ng/mL) vs less fibrosis (mean, 669 ng/mL) determined by MRE (P < .05) (Figure 2). This association was also seen using the Enhanced Liver Fibrosis Index (ELF). Univariate analysis was performed by ANOVA with Sheffe comparison of means, including key demographic and clinical variables (Table 2). Using stepwise linear regression and including variables with P < .05, log-transformed sCD163 was highly associated with plasma alanine aminotransferase (ALT) levels (P = .015) and HCV (P = .001). Other factors were dropped from the model. Individual cytokine values were compared across disease groups. In general, proinflammatory cytokines were increased in HIV-infected persons vs uninfected controls. For example, interferon alfa was 41.5 in uninfected controls vs 54.2 in the HIV-monoinfected group and 57.6 in the HCV/HIV-coinfected group (P < .01). Similar patterns were noted for IL-6 and IL-8. The heat diagram in Figure 3 shows the relationships between cytokines and immune activation markers. Using a sequential best subset regression model including all tested cytokines/chemokines, and then using linear regression to determine significant factors associated with advanced fibrosis by MRE, sCD163 was significant (P < .02), with RANTES, interferon alpha, and TGF beta falling out of the final model. Overall, sCD163 clustered with sCD14 and sCD27 in HIV-monoinfected and HCV/HIV-coinfected participants, as well as with other macrophage activation markers. The correlation matrix of the cytokines was clustered to identify modules related to disease phenotypes. Each disease group demonstrated distinct cytokine cluster patterns (Figure 3). Participants with HIV monoinfection were noted to have 3 distinct clusters of immune markers (M1, TH1/2/17, and MI/M2). In the HCV/HIV coinfection group, the separation between markers was much clearer where 2 clusters of macrophage activation markers and T-helper cell activation markers were identified. These same modules of cytokines and chemokines were not observed in the uninfected control group.
Univariate Analysis of Factors Associated With Log-Transformed sCD163
| Characteristic | P Value |
|---|---|
| Age | .4865 |
| Sex | .23 |
| Race/ethnicity | .001 |
| HIV status | .0067 |
| HCV status | <.0001 |
| BMI | .4264 |
| ALT (>30 IU/mL) | .0027 |
| Steatosis (>5%) | .0334 |
| AUDIT | .8294 |
| Fibrosis (Stage >1) | .0027 |
| Characteristic | P Value |
|---|---|
| Age | .4865 |
| Sex | .23 |
| Race/ethnicity | .001 |
| HIV status | .0067 |
| HCV status | <.0001 |
| BMI | .4264 |
| ALT (>30 IU/mL) | .0027 |
| Steatosis (>5%) | .0334 |
| AUDIT | .8294 |
| Fibrosis (Stage >1) | .0027 |
Abbreviations: ALT, alanine aminotransferase; BMI, body mass index; ELF, Enhanced Liver Fibrosis Index; MRE, magnetic resonance elastography; VL, viral load.
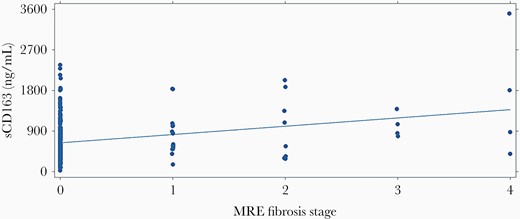
Scatter plot illustrating relationship of sCD163 biomarker and the MRE fibrosis stages 0–4. Linear regression line is shown. Abbreviation: MRE, magnetic resonance elastography.
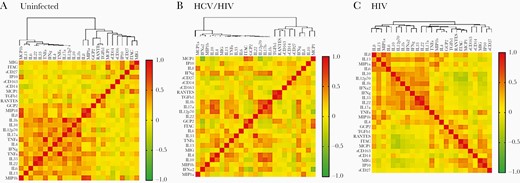
Heat map representation of cytokines and immune activation marker relationships among the 3 groups of subjects. The panels show the hierarchical clustering of Spearman correlation coefficients of log-transformed cytokine and immune activation marker levels in (A) uninfected controls, (B) HCV/ HIV-coinfected participants, and (C) HIV-monoinfected participants. Abbreviation: HCV, hepatitis C virus.
We examined the association between sCD163 and substance abuse in the MASH cohort. The levels of sCD163 were not associated with use of opioids, cocaine, or hazardous drinking, as measured by the AUDIT (score ≥8). In contrast, plasma ALT levels were highly associated with hazardous drinking (P < .001), and heroin use trended toward significance (P = .08). This suggests that hepatocyte injury is a direct effect of exposure to these substances rather than the downstream effect of a macrophage-associated cytokine cascade.
Steatosis and steatohepatitis represent another source of hepatic injury and fibrosis development. Magnetic resonance imaging–derived proton density fat fraction (MRI-PDFF) was used to determine the proportion of steatosis, which ranged from <1% to 24.2% fat. Fatty liver, defined as >5% fat, was present in 15.1% of the 284 individuals for whom MRI-PDFF was available. The groups did not show differences in terms of proportion of liver steatosis by HIV infection (P = .24). ALT levels did correlate with the proportion of liver fat (r = 0.33), and those meeting the definition of steatosis had significantly higher ALT levels (P < .001). Fatty liver was not significantly associated with levels of sCD14 or sCD27, but the association with sCD163 approached significance by ANOVA (P = .058), with higher levels seen in those with >5% hepatic fat (803 ng/mL vs 653 ng/mL).
DISCUSSION
Mechanisms of liver injury and collagen deposition in the setting of HIV infection are diverse and may include direct injury to hepatocytes from drugs and toxins, or viral coinfections, or indirect injury due to oxidative stress and activation of cytokine pathways that cause inflammation, injury, and stellate cell activation [9]. One such pathway is endotoxin-associated activation of resident macrophages, which is associated with increased gut permeability in the setting of HIV infection [1]. The presence of plasma CD163 has been identified as a key marker of Kupffer cell activation [2]. Herein, we describe the association of this marker with the presence of liver injury and hepatic fibrosis in a large cohort of subjects who have been well characterized with regard to liver injury, fibrosis, and hepatic steatosis.
Soluble CD163 levels were higher in PWH than in uninfected subjects. Interestingly, the highest levels were observed in those with HCV/HIV coinfection. In patients with HCV monoinfection, sCD163 and sCD14 did not correlate with ALT levels, suggesting that HCV injury is not mediated through activated macrophage pathways [10]. The significant association between sCD163 and ALT that we observed supports the concept that increased gut permeability in the setting of HCV/HIV coinfection plays a contributory role to accelerated liver injury, which may be distinct from the injury/inflammatory response within HCV-replicating hepatocytes. This concept is further supported by the findings of Lopez-Cortes et al., who reported that HCV/HIV-coinfected patients who were successfully cured of HCV using an interferon-free regimen had significant reductions in sCD14, LPS, and 16s ribosomal RNA [11]. Interestingly, reduction in gut permeability did not affect CD4 levels, though other studies have reported improvement in nonhepatic morbidities following successful HCV treatment [12]. Our data suggest that those with HIV infection have sCD14 levels comparable to the uninfected control group. We speculate that this is due to long-term HIV control with antiretroviral agents. Burdo and colleagues described persistent sCD163 elevation with long-term macrophage-monocyte activation among HIV virally suppressed persons, even after 1 year of antiretroviral therapy, and suggested that persistent activation may have other systemic implications [13]. Wallet et al. also noted a persistent pro-inflammatory state that persists among PWH who are on effective cART, which is supported by our data [14]. Among HIV-infected persons, serious non-AIDS adverse events (SNAEs; including cardiovascular events [coronary artery disease {CAD} requiring surgery or intervention, myocardial infarction {MI}, cerebrovascular accident or transient ischemic attack {CVA/TIA}, pulmonary embolism {PE}, and cardiac arrest]), end-stage renal disease (ESRD), decompensated cirrhosis, and non-AIDS malignancies were more frequently associated with illicit drug use. Biomarkers that predicted this outcome included failure to see declines in sCD14 and IL-6, while longitudinal changes in sCD163 failed to predict these outcomes, suggesting that at least some of the SNAEs were due to direct organ toxicity effects [15].
The use of a multiplex cytokine assay allowed evaluation of both individual cytokines and analysis of group associations using cluster techniques. Not surprisingly, pro-inflammatory cytokines tend to be elevated among those with HIV infection and are highest in those with ongoing HCV-related injury.
The role of cocaine, opioids, and other drugs of abuse in the promotion of hepatic injury remains uncertain. Alcohol is clearly a factor in liver injury and development of fibrosis, but the relative contribution sCD163-producing macrophages vs direct injury from acetaldehyde adducts is unclear. Alcoholic hepatitis probably represents a combined injury pattern that includes both direct effects on hepatocytes, leading to fat accumulation and ballooning, and an inflammatory immunologic response.
The relationship between fatty liver and sCD163 remains uncertain. It has been suggested that bidirectional cross-talk exists between fat-laden cells and liver resident macrophage-monocyte subsets. Some data suggest that this is related to adiposity associated with insulin resistance [16]. Central adiposity is highly predictive of NAFLD/NASH and is a key feature of lipodystrophy in PWH [17]. In a small study of subjects with HIV monoinfection, macrophage activation was thought to be more related to the presence of NAFLD with obesity than to immune activation associated with gut permeability [18]. The clustering pattern of subsets of macrophage and T-cell activation markers revealed trends toward mechanistic immunological variations in the HIV, HCV/HIV coinfected, and control groups.
This study has several limitations. First, the cohort had a very limited enrollment of HCV-monoinfected participants, and the small number precluded analysis of this subgroup. The data presented herein are cross-sectional in nature. Findings related to inflammation are likely to be active associations, but findings related to hepatic fibrosis are likely to be representative of prior rather than current injury patterns. The cohort is longitudinal in nature, however, and full follow-up over several years is anticipated at a later date. At entry, participants identified as HCV/HIV-coinfected were not yet treated with direct-acting agents, but as the cohort progresses we anticipate that a high percentage will achieve HCV cure. We plan to capture data on HCV treatment and response(s) in future analyses. While the study employs state-of-the-art noninvasive measures of hepatic fibrosis and fat, liver biopsies are not performed. Therefore, we cannot definitively characterize the intrahepatic cytokine environment, instead relying upon blood-based results to generate a picture of the inflammatory and fibrogenic pathways. Samples were not tested using replicates. Cytokine levels below the limit of detection were evaluated using imputed values. While this methodology can lead to biased correlation analysis, exclusion may also lead to erroneous conclusions. Despite this limitation, we feel that the large-scale cytokine analyses do shed light upon differential mechanisms of injury and response in this population.
In conclusion, soluble CD163 levels, reflective of Kupffer and/or macrophage cell activation, were significantly associated with liver fibrosis, which was determined with MRE and ELF. These data suggest that persistent immune activation is a major contributor to liver disease, adding to damage caused by alcohol and non-alcohol-related steatosis and perhaps other hepatotoxic drug effects.
Acknowledgments
We would like to acknowledge the Research Flow Cytometry Core at Cincinnati Children’s Hospital Medical Center and the Digestive Health Center (National Institute of Diabetes and Digestive and Kidney P30 DK078392); as well as NIH National Institute of Biomedical Imaging and Bioengineering R37 EB001981 partial support to R.L.E.
Financial support. This study was supported by the NIH National Institute on Drug Abuse grant 5U01DA040381 to M.B.
Potential conflicts of interest. All authors: no reported conflicts of interest. All authors have submitted the ICMJE Form for Disclosure of Potential Conflicts of Interest. Conflicts that the editors consider relevant to the content of the manuscript have been disclosed.
Author contributions. Conceptualization: K.E.S. and M.B. Methodology and data curation: K.E.S., H.M., S.D.R., E.A.A.-H., J.H., J.T., J.C., and R.L.E. Software and analysis: K.E.S., H.M., S.D.R., E.A.A.-H., J.T., J.C., and M.B. Funding and resources: K.E.S., R.L.E., and M.B. Writing—original draft preparation: K.E.S. Writing—review and editing: K.E.S., H.M., S.D.R., E.A.A.-H., J.T., J.C., R.L.E., and M.B.
Patient consent. All cohort enrollees provided written informed consent, and the NIDA-280-funded cohort study protocol was approved by the Florida International University institutional review 281 board in 2014, IRB protocol Approval # IRB-13-0028-CR07 and IRB-13-0024-CR07.


Comments