


Abstract
The efficacy of nucleot(s)ide analogs (NAs) and pegylated interferon (PegIFN) combination therapy for hepatitis B e antigen–positive (HBeAg+) patients is still controversial. Whether PegIFN and entecavir (ETV) combination therapy could provide a greater benefit for HBeAg+ patients was assessed.
Treatment-naïve HBeAg+ patients initiated on PegIFN alfa-2a (PegIFNα-2a) for 24 weeks without early response (early response: HBsAg <1500 IU/mL and hepatitis B virus [HBV] DNA <105 copies/mL) were recruited in the current study. Among total of 94 patients, 51 were continued on PegIFNα-2a monotherapy, and 43 were offered PegIFNα-2a and ETV combined therapy.
Better outcomes in response to the combined therapy, compared with that of the monotherapy, were demonstrated, including more HBsAg decline and loss and HBV DNA decline and HBeAg clearance. Importantly, the patients with HBsAg levels between 1500 and 20 000 IU/mL initially or between 5000 and 20 000 IU/mL after 24 weeks of PegIFNα-2a benefitted more from the combined therapy, compared with those on monotherapy.
Combined therapy of PegIFNα-2a and ETV is more efficacious for HBeAg+ patients without early response to PegIFN monotherapy, and HBsAg levels are a good predictor of treatment outcomes.
Chronic hepatitis B (CHB) patients often progress to liver fibrosis, cirrhosis, and hepatocarcinoma [1]. Covalently closed circular hepatitis B virus DNA (cccDNA), which persistently replicates within the nucleus of hepatocytes, is the most important contributing factor in chronic HBV infection. HBsAg level could act as a surrogate for cccDNA level in the nucleus; thus the ultimate goal of antiviral therapy for CHB is HBsAg loss and sustained remission afterwards [2]. Pegylated interferon (PegIFN) and nucleot(s)ide analogs (NAs) are 2 first-line treatments recommended by AASLD, APASL, EASL, and Chinese guidelines for the treatment of CHB patients [3]. NAs effectively suppress viral replication, and PegIFN enhances the efficacy of outcomes via burst host immunity [2, 4, 5], but the effect of NAs and PegIFN on the reduction and/or elimination of HBsAg remains to be explored.
HBeAg+ patients can reach up to 40% response to PegIFN treatment, including HBeAg seroconversion and HBV DNA decline, but only with ~5% HBsAg loss [6]. However, no response or incomplete response is still observed in ~60% of HBeAg+ patients. More recently, results from a multicenter, prospective study of HBeAg+ patients on extended PegIFNα-2a and/or who received adefovir in addition to PegIFNα-2a in China were reported [7]. The authors reported on a response-guided therapy (RGT) strategy [7]; that is, these patients continued to be treated with different therapy strategies based on their 24-week response to PegIFNα-2a. Interestingly, there was no additional benefit of extending PegIFNα-2a or combining it with adefovir for non–early responders [7]. Controversial data have been also reported from others on the optimization of efficacy in nonresponding or partially responding patients [8–10].
However, international guidelines do not recommend the use of combination therapy with NAs and PegIFN, due to controversy in the real world and lack of sufficient evidence to support combination therapy [2, 3, 5]. Thus, verification of the efficacy of combined therapy and optimization of the benefit of the combination approach, including which patients would benefit and when to start the combination, which NAs should be added, and how long the combination therapy should last, are needed.
In the current study, we prospectively analyzed HBeAg+ patients who were initiated on PegIFNα-2a for 24 weeks without early response, whose therapy was either extended or combined with entecavir (ETV) for 72 weeks. We aimed to clarify if a longer time combination with ETV could result in greater efficacy in these difficult-to-treat patients.
METHODS
Study Patients
In this prospective cohort study, all of the patients were admitted to the Infectious Disease Department of Ruijin Hospital between December 2016 and July 2019. The inclusion criteria were (1) age ≥18 years; (2) confirmed diagnosis of CHB with HBeAg+, hepatitis B e antibody (HbeAb)-, serum HBV DNA >105 copies/mL; (3) initiated on PegIFNα-2a (180 μg/wk) for 24 weeks without early response (early response: HBsAg <1500 IU/mL and HBV DNA <105 copies/mL). Exclusion criteria were as follows: (1) received any antiviral treatment within the prior 6 months; (2) coincident with other hepatitis, including viral (hepatitis A, hepatitis C, hepatitis E), autoimmune, drug-induced, or alcohol-related; (3) decompensated liver disease (Child-Pugh score >5); (4) hepatocellular carcinoma; (5) abnormal blood cell count (a neutrophil count <1500 cells/mm3 or platelet count <90 000 cells/mm3, hemoglobin <11.0 g/dL for females and <12 g/dL for males).
Patient Consent Statement
All patients’ clinical data and serum were obtained with written consent for use for diagnostic and research purposes in an unidentified manner. All of the patients were adults who were older than age 18 years. The current study was approved by the Clinical Trial Ethics Committee of Ruijin Hospital, Shanghai Jiao Tong University School of Medicine (reference number 2016–111).
Treatment Protocol
The current study was not a registered clinical trial. CHB patients were recruited based on their basal levels after receiving 24 weeks of PegIFNα-2a; those who were recruited were classified as non–early responsders (early response: HBsAg <1500 IU/mL and HBV DNA <105 copies/mL). These patients were divided into groups A (continued on PegIFNα-2a for another 72 weeks) and B (continued on PegIFNα-2a with addition of ETV for another 72 weeks of combination) depending on patient consent, which did not include attributes or confounding variables (Figure 1). The definition of early response for the current study is based on a previous study [7].
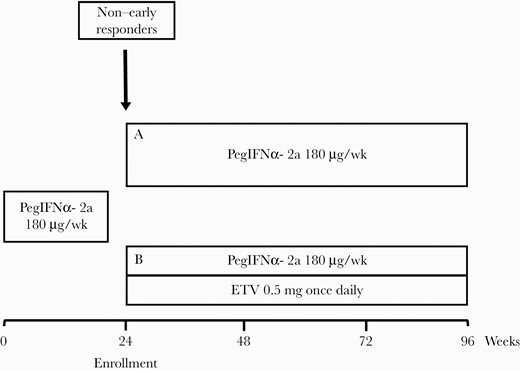
Treatment protocol of the study. Abbreviation: ETV, entecavir.
Patients from both groups were followed up with examinations at 0 (the first PegIFNα-2a shot), 12, 24, 48, 72, and 96 weeks, as well as 24 weeks after the end of treatment (EOT; group B patients were continued on ETV), including clinical characteristics, quantitative HBsAg, HBeAg, HBeAb, HBV DNA (COBAS TagMan, Roche Molecular Diagnosis; below the limit was considered negative; limit of detection, 20 IU/mL; 1 IU/mL = 5.82 copies/mL), alanine aminotransferase (ALT), and aspartate aminotransferase (AST). In this study, we used the fully automated chemiluminescent microparticle immunoassay (Architect HBsAg QT) to detect HBsAg.
Assessment of Efficacy
Per-protocol analysis included patients who finished the predefined length of treatment, which was 96 weeks and 24 weeks post-EOT follow-up, without major protocol deviation. Patients who dropped out during the study (4 in group A and 7 in group B) were not included in the analysis. The efficacy of treatment was assessed with HBsAg decline and/or loss, HBeAg serum conversion, and HBV DNA decline and/or undetectability during treatment, at EOT, and 24 weeks post-EOT. The primary end point was change of quantitative HBsAg from week 0 (time of the first PegIFNα-2a shot) to EOT. No adjustment for multiple comparisons was made.
Statistical Analysis
GraphPad 8.0 software was used for part of the statistical analysis. Quantitative variables were expressed as mean ± standard error of the mean. Differences between the 2 groups were tested using t tests, chi-square tests, or Fisher’s exact tests. Logistic regression was performed using SPSS software (version 19.0). P values ≤.05 (2-tailed) were considered statistically significant.
RESULTS
Patient Characteristics
The flowchart of the study is presented in Figure 2. A total of 145 HBeAg+ patients eligible for PegIFNα-2a treatment were initiated on PegIFNα-2a monotherapy (the inclusion and exclusion criteria are provided in the Supplementary Data). Only 105 patients without early response at 24 weeks were recruited, including 55 and 50 in groups A and B, respectively. Four and 7 patients dropped out from groups A and B, respectively. In group A, 2 patients dropped out due to adverse effects (1 had a thyroid problem, and the other had a low white blood cell count), 1 withdrew consent, and 1 was lost to follow-up. In group B, 3 patients dropped out due to adverse effects (2 had thyroid problems, and 1 had unacceptable itching), 2 patients withdrew consent, and 2 patients were lost to follow-up (Figure 2). In the end, 94/105 (89.5%) patients finished the treatment and were analyzed in this study. During the study, 5 and 3 patients were put on a reduced dose of PegIFNα-2a, from 180 μg/wk to 135 μg/wk, at different times in group A and group B, respectively. In group A, 3 patients’ doses were reduced for 3 weeks, and 2 patients’ doses were reduced for 4 weeks. In group B, 4 patients’ doses were reduced for 4 weeks, and 1 patient’s dose was reduced for 3 weeks.

Flowchart of the study. Abbreviation: AE, adverse event.
The clinical characteristics at week 0 (the time of the first PegIFNα-2a shot) were similar between the 2 groups, without significance (Table 1), even though the groups were not randomized. Most patients were male, with a mean age around 37 years, and HBsAg levels at week 0 were 4 log10 IU/mL in both groups. HBV DNA and ALT levels were marginally higher in group A than group B, while HBeAg level was lower in group A than group B, without significance. The patients’ clinical characteristics at week 24 were also similar between the 2 groups, including Fibrosis-4 index scores (Table 2).
The Characteristics of Patients Initiated on the First PegIFNα-2a Shot at Week 0
| Total (n = 94) | Group A (n = 51) | Group B (n = 43) | P (Group A vs Group B) | |
|---|---|---|---|---|
| Male, No. (%) | 68 (72.3) | 34 (66.7) | 34 (79.0) | NS |
| Age, y | 37.9 ± 8.1 | 37.8 ± 8.6 | 38.0 ± 7.8 | .8887 |
| BMI, kg/m2 | 23.3 ± 2.7 | 22.9 ± 2.9 | 23.7 ± 2.2 | .1284 |
| HBsAg, log10 IU/mL | 4.0 ± 0.6 | 4.0 ± 0.6 | 4.0 ± 0.7 | .9573 |
| HBeAg, log10 PEIU/mL | 2.5 ± 0.9 | 2.3 ± 1.0 | 2.6 ± 0.8 | .0815 |
| HBV DNA, log 10 IU/mL | 7.3 ± 1.4 | 7.3 ± 1.6 | 7.1 ± 1.0 | .3628 |
| ALT, IU/mL | 222.0 ± 182.4 | 248.3 ± 193.1 | 191.0 ± 165.6 | .1326 |
Data are presented as mean ± SD, unless otherwise indicated.
Abbreviations: ALT, alanine aminotransferase; BMI, body mass index; HBV, hepatitis B virus.
Characteristics of Patients at Week 24
| Total (n = 94) | Group A (n = 51) | Group B (n = 43) | P (Group A vs Group B) | |
|---|---|---|---|---|
| HBsAg, log10 IU/mL | 3.7 ± 0.6 | 3.7 ± 0.6 | 3.6 ± 0.7 | .2285 |
| HBeAg, log10 PEIU/mL | 2.0 ± 1.0 | 1.9 ± 1.0 | 2.1 ± 0.9 | .2121 |
| HBV DNA, log 10 cps/mL | 5.2 ± 1.8 | 5.0 ± 1.7 | 5.4 ± 1.8 | .2507 |
| ALT, IU/mL | 121 ± 96.7 | 125.8 ± 81.6 | 115.3 ± 112.7 | .6149 |
| FIB-4 | 1.7 ± 0.7 | 1.7 ± 0.7 | 1.6 ± 0.7 | .2976 |
Data are presented as mean ± SD.
Abbreviations: ALT, alanine aminotransferase; FIB-4, Fibrosis-4; HBV, hepatitis B virus.
The Efficacy of Monotherapy or Combination Therapy for HBsAg Decline
A 2.8-fold decrease in HBsAg was observed in group B vs group A (group A vs group B, –0.605 log10 IU/mL vs –1.684 log10 IU/mL; P = .0025) at EOT. This effect continued; group B had a greater decline in HBsAg than group A at 24 weeks post-EOT as the off-treatment response (group A vs group B, –0.855 log10 IU/mL vs –2.001 log10 IU/mL; P = .0004) (Figure 3A). A more profound difference in HBsAg level was detected with prolonged treatment (48 weeks: group A vs group B, 3.567 log10 IU/mL vs 3.039 log10 IU/mL; P = .0174; 96 weeks: group A vs group B, 3.344 log10 IU/mL vs 2.266 log10 IU/mL; P = .0012) (Figure 3B).
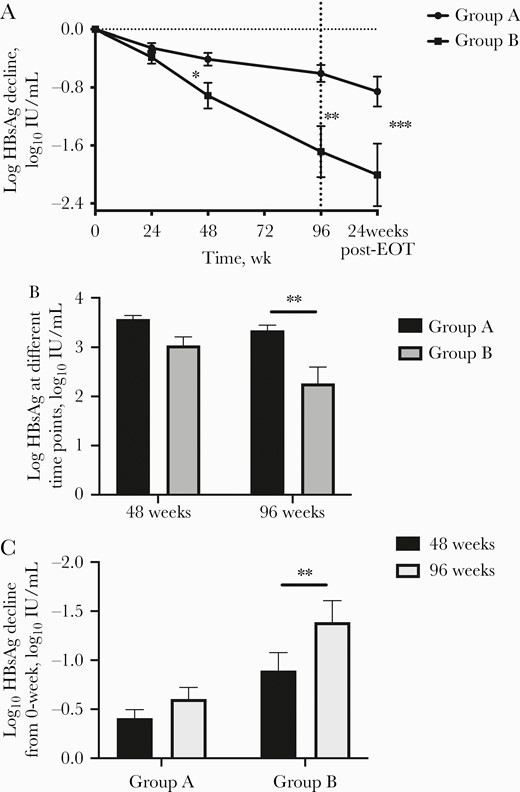
The effect of HBsAg in the study. A, The HBsAg decline of the 2 groups from 0 to 96 weeks and 24 weeks post-EOT. B, The HBsAg value of the 2 groups at 48 and 96 weeks. C, HBsAg decline of the 2 groups with 48 and 96 weeks of treatment. Abbreviation: EOT, end of treatment.
There was no significant difference of HBsAg decline between 48 and 96 weeks in group A (48 weeks vs 96 weeks: –0.409 log10 IU/mL vs –0.605 log10 IU/mL; P = .1841), but a striking difference was detected in group B (48 weeks vs 96 weeks: 0.912 log10 IU/mL vs 1.685 log10 IU/mL; P = .0492) (Figure 3C). Interestingly, a lower HBsAg decline was observed in group B at 48 weeks than in group A at 96 weeks, without significance (96 weeks: group A, 0.605 log10 IU/mL; 48 weeks: group B, 0.912 log10 IU/mL; P = .174).
Efficacy of HBeAg Clearance and HBV DNA Decline/Undetectable
Clearance of HBeAg was also greater in group B than in group A at EOT, even with a higher baseline (groups A vs B, 33.3% vs 55.8%; P = .0373) (Figure 4A).

Comparison of HBeAg clearance and HBV DNA decline/loss between the 2 groups. A, HBeAg clearance of the 2 groups at 96 weeks. B, HBV DNA decline of the 2 groups from week 0 to 96 weeks. C, HBV DNA clearance at 96 weeks of the 2 groups. Abbreviation: EOT, end of treatment.
Similarly, group B also achieved a greater HBV DNA decline at EOT (group A vs group B, –6.674 log10 copies/mL vs –9.498 log10 copies/mL; P = .0064) (Figure 4B), with 57% and 86% of patients achieving HBV DNA undetectability in grous A and B, respectively (P = .01) (Figure 4C).
HBeAg Clearance and HBsAg Loss at Different Time Points
The first patient had HBsAg loss at week 48 in group B, and 1 more patient had HBsAg loss every 24 weeks. At EOT, 3 patients (7%) had HBsAg loss in group B, but none in group A. Off-treatment response was evaluated at 24 weeks post-EOT; 1 (2%) patient and 4 (9.3%) patients had HBsAg loss in groups A and B, respectively, at that time (Figure 5A). The percentage of HBeAg loss was increasing with greater treatment time. Group A still had 33.3% at 24 weeks post-EOT, while group B had slightly dropped to 48.4% (Figure 5B).
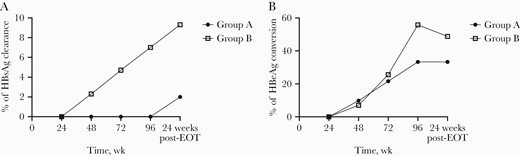
Percentage of patients with HBsAg loss and HBeAg conversion at different time points. A, Percentage of patients with HBsAg loss at different time points. B, Percentage of patients with HBeAg conversion at different time points. Abbreviation: EOT, end of treatment.
Prediction of Response
Binary logistic regression analysis was applied to explore the values of the week 0 characteristics for response at EOT. HBeAg loss and HBV DNA <2000 IU/mL at EOT defined “response” in a previous study [7]. We found that HBsAg level at week 0 (continuous variable, log10 IU/mL; P = .04) and ETV combination (with ETV = 1, without ETV = 0; P = .01) had an influence on response, but age, gender, HBeAg, HBV DNA, and ALT did not. The odds ratios (ORs) for HBsAg and ETV combination were 0.461 (95% CI, 0.22–0.966) and 3.172 (95% CI, 1.316–7.647), respectively (Table 3).
Logistic Regression Analysis of Patient Characteristics
| Variable | Regression Coefficient | Standard Error | Wald χ 2 Value | P Value | OR | 95% CI of OR | |
|---|---|---|---|---|---|---|---|
| Lower | Upper | ||||||
| HBsAg, log10 IU/mL | –0.774 | 0.378 | 4.206 | .040 | 0.461 | 0.220 | 0.966 |
| ETV combination, (with ETV = 1, without ETV = 0) | 1.154 | 0.449 | 6.611 | .010 | 3.172 | 1.316 | 7.647 |
| Constant | 2.165 | 1.497 | 2.090 | .148 | 8.714 | - | - |
Abbreviations: ETV, entecavir; OR, odds ratio.
Using HBsAg level at week 0 to predict the effect, CHB patients were further divided into 3 groups according to the previous study [7]. We found that 60% of the patients achieved response at EOT with HBsAg <1500 IU/mL at week 0 (Figure 6A), irrespective of the treatment used (group A vs group B, 66.7% vs 57.1%; P > .05) (Figure 6B). However, the lowest response was observed in the patients with HBsAg >20 000 IU/mL at week 0 (27.6%) (Figure 6A), despite that combination therapy increased the response rate >2-fold without significance (group A vs group B, 15.4% vs 37.5%; P > .05) (Figure 6B). Interestingly, for the patients with HBsAg between 1500 and 20 000 IU/mL at week 0, combination therapy improved the response rate significantly more in group B than group A (group A vs group B, 34.3% vs 70.0%; P = .0408) (Figure 6B).

The prediction value of HBsAg at 0 and 24 weeks. A, The response rate of all patients at 96 weeks with different HBsAg levels at 0 weeks. B, The response rate of patients in the 2 groups at 96 weeks with different HBsAg levels at 0 weeks. C, The response rate of patients in the 2 groups at 96 weeks with different HBsAg levels at 24 weeks. Abbreviation: HBV, hepatitis B virus.
HBsAg level at enrollment (24 weeks after PegIFNα-2a) predicted the outcomes of treatment. A previous study showed that the HBsAg cutoff of 1500 IU/mL at week 24 can be used to predict outcomes [7]. In our study, the CHB patients included all had HBsAg >1500 IU/mL. A cutoff of 5000 IU/mL was selected, instead of 1500 IU/mL. We found that the patients with HBsAg levels between 5000 and 20 000 IU/mL at week 24 had a better response with combination therapy than the monotherapy group (group A vs group B, 12.5% vs 50%; P = .0484) (Figure 6C). The patients with HBsAg <5000 IU/mL displayed a higher response rate with combination therapy than monotherapy, without statistical difference (Figure 6C). However, no patient had response at EOT with HBsAg >20 000 IU/mL at week 24 in either group.
DISCUSSION
“APASL Clinical Practice Guidelines on the Management of Hepatitis B: A 2015 Update” recommends the ideal end point of hepatitis B treatment as sustained off-therapy HBsAg loss (A1 recommendation) [3]. PegIFN and NAs with potent virus suppression are recommended as the first choice antiviral therapy. NAs should be taken for the patient’s lifetime, with rare HBsAg loss. Currently, PegIFN could have a greater chance of achieving HBeAg seroconversion and HBsAg clearance. However, fewer CHB patients respond with PegIFN monotherapy. Thus it is critically important to optimize the combination of NAs and PegIFN therapy at this stage. Response-guided treatment is a promising approach that has been successfully applied for the treatment of CHC [7, 11], while its usage in CHB patients remains to be clarified. The RGT strategy was also applied in the current study, but with a focus on non–early responders.
The combination of PegIFNα and NAs is not recommended currently by the guidelines because of unproven superior efficacy [3, 12] and lack of well-designed randomized clinical trials. The data from a classic global registration study do not show efficacy with the combination of PegIFNα and lamivudine [9], which is consistent with studies in China [10, 13]. A more recent multicenter clinical study in China also demonstrates that extending and/or combining PegIFNα with adefovir does not provide superiority for non–early responders [7]. However, NAs with stronger HBV DNA suppression and less resistance were not included, and NAs were only offered for a short duration (<24 weeks), which might have led to the unsatisfying results. It has been reported that PegIFNα combined with tenofovir improved the reduction of HBsAg, even in HBeAg-negative patients, in 2016 [14]. Interestingly, our study demonstrated that regardless of HBsAg decline/loss, HBeAg clearance or HBV DNA decline in combination therapy was better than that in monotherapy for non–early responders based on the RGT strategy [7]. Our data further demonstrate that the reduction of HBsAg in the combined therapy group B was 2.8 times greater than that of monotherapy at EOT, which is consistent with the decrease in HBsAg value of group B from 4 to 2.266 log10 IU/mL, while this decrease was only 4 to 3.344 log10 IU/mL in group A. In addition, 13 out of 43 (30.2%) patients in group B had 2 logs of HBsAg reduction, compared with 2 out of 51 (3.9%) patients in group A at EOT. Moreover, 3 out of 43 (7%) patients in group B achieved HBsAg loss, while none in group A were cleared. Similarly, the combination therapy also affected more HBeAg clearance and HBV DNA decline/loss. The explanation for the discrepancy between our findings and those of others [7] might be as follows: (1) ETV was chosen as the add-on NA because ETV is able to suppress virus more effectively in a shorter time than adefovir or lamivudine; (2) we initiated and further extended ETV add-on time, which started at 24 weeks and combined for a total 72 weeks, which is the longest combination therapy in the literature.
It has been reported that extending PegIFNα treatment creates an advantage in virological response and HBsAg decline in HBeAg- patients [15, 16]. We also demonstrate that HBsAg decline was not improved significantly with extension of PegIFNα monotherapy from 48 to 96 weeks (48 weeks vs 96 weeks: group A, –0.433 log10 IU/mL vs 0.656 log10 IU/mL; P > .05), which was the same as HBeAg clearance (48 weeks vs 96 weeks: group A, 31.37% vs 33.3%; P > .05). Interestingly, HBV DNA loss improved significantly (48 weeks vs 96 weeks: group A, 19.6% vs 56.8%; P = .0002). Our data suggest that monotherapy extension may not be necessary for non–early responders, 48 weeks might provide the maximum effect, and 96 weeks may not be necessary as there was no additional benefit and possibly more adverse effects of PegIFNα. Although HBV DNA loss benefits patients, NA monotherapy can achieve HBV DNA loss with fewer adverse effects. We also acknowledge that the study did not have sufficient power to detect a difference in these 2 groups between weeks 48 and 96.
Our current findings show that week 0 HBsAg level may influence EOT response, which is consistent with previous studies [7, 17]. Of the patients with week 0 HBsAg <1500 IU/mL, 60% were responders at EOT, whereas of the patients with baseline HBsAg >20 000 IU/mL, only 27.6% were responders, with either monotherapy or combination therapy. Thus our data further suggest that patients with low week 0 HBsAg have a better chance of responding to PegIFNα-2a, and no combination with NAs is necessary. On the other hand, it is not recommended that patients with high HBsAg begin PegIFNα therapy, because long-term NA therapy is probably more appropriate to achieve a lower HBsAg level before PegIFNα therapy.
More importantly, HBsAg levels at week 24 could predict treatment outcomes in advance. Patients with HBsAg levels <5000 IU/mL at week 24 could have an optimal response rate with either monotherapy or combination therapy (group A vs group B, 42.4% vs 66.7%; P > .05). Furthermore, combination therapy seems to provide a greater benefit for patients with HBsAg levels between 5000 and 20 000 IU/mL. In addition, it is recommended that patients with HBsAg levels between 5000 and 20 000 IU/mL be added with first-line NAs as soon as possible and that they be given combination therapy for at least 72 weeks. The optimal cutoff value of HBsAg for combination therapy with the same HBsAg range remains to be explored. Unfortunately, patients with HBsAg levels higher than 200 000 IU/mL at week 24 should stop IFN therapy and switch to NAs because of poor outcomes at EOT.
Although this was a prospective cohort study in single center with <150 patients, our data offer some useful information in utilizing RGT in HBeAg+ patients and show optimistic results for combination therapy with PegIFNα-2a and ETV. We realize that this is not the best selection. Nevertheless, it was the best option we had at the time. We will, of course, extend our study with randomized and multicenter investigation in the future.
Supplementary Data
Supplementary materials are available at Open Forum Infectious Diseases online. Consisting of data provided by the authors to benefit the reader, the posted materials are not copyedited and are the sole responsibility of the authors, so questions or comments should be addressed to the corresponding author.
Acknowledgments
Author contributions. Lu Chen and Lanyi Lin designed the experiments and wrote the manuscript draft. Huijuan Zhou, Weiliang Tang, Hui Wang, and Wei Cai were involved in patient recruitment and data collection. Shisan Bao and Simin Guo conceived the study and critically reviewed the manuscript. Qing Xie had full access to all the data in the study and takes responsibility for the integrity of the data.
Financial support. This study was supported by the National Natural Science Foundation of China (81770587, 81570535; Q.X.), the National Key Programs on Infectious Diseases of China (2017ZX10202202-005-004, 2017ZX10203201-008, 2018ZX09201016-003-001; Q.X.), Project of Shanghai Municipal Health and Family Planning (20184Y0091; L.C.), and Shanghai Municipal Key Clinical Specialty (Infectious Disease, shslczdzk01103; Q.X.).
Potential conflicts of interest. The authors declare that there is no conflict of interest. All authors have submitted the ICMJE Form for Disclosure of Potential Conflicts of Interest. Conflicts that the editors consider relevant to the content of the manuscript have been disclosed.
References
Author notes
Equal contribution
Equal contribution


Comments