


Abstract
Background. Phenome-Wide Association Studies (PheWAS) identify genetic associations across multiple phenotypes. Clinical trials offer opportunities for PheWAS to identify pharmacogenomic associations. We describe the first PheWAS to use genome-wide genotypic data and to utilize human immunodeficiency virus (HIV) clinical trials data. As proof-of-concept, we focused on baseline laboratory phenotypes from antiretroviral therapy-naive individuals.
Methods. Data from 4 AIDS Clinical Trials Group (ACTG) studies were split into 2 datasets: Dataset I (1181 individuals from protocol A5202) and Dataset II (1366 from protocols A5095, ACTG 384, and A5142). Final analyses involved 2547 individuals and 5 954 294 imputed polymorphisms. We calculated comprehensive associations between these polymorphisms and 27 baseline laboratory phenotypes.
Results. A total of 10 584 (0.17%) polymorphisms had associations with P < .01 in both datasets and with the same direction of association. Twenty polymorphisms replicated associations with identical or related phenotypes reported in the Catalog of Published Genome-Wide Association Studies, including several not previously reported in HIV-positive cohorts. We also identified several possibly novel associations.
Conclusions. These analyses define PheWAS properties and principles with baseline laboratory data from HIV clinical trials. This approach may be useful for evaluating on-treatment HIV clinical trials data for associations with various clinical phenotypes.
Access to safe and effective antiretroviral medications is critical for the global response to the acquired immunodeficiency syndrome (AIDS) pandemic. Polymorphisms in drug absorption, distribution, metabolism, and elimination (ADME) genes and off-target genes have been associated with side effects and/or pharmacokinetics of antiretroviral drugs including abacavir [1], atazanavir [2], efavirenz [3–5], etravirine [6], lopinavir [7], and nevirapine [8], and genetic screening to prevent abacavir hypersensitivity reaction is now standard of care. Genetic testing to inform antiretroviral prescribing may benefit from considering polymorphisms associated with end-organ and physiologic pathway effects in human immunodeficiency virus (HIV)-negative populations, especially if associations are not abrogated by HIV-1 infection.
Genome-Wide Association Studies (GWAS) explore whether an individual trait (ie, phenotype) is associated with single-nucleotide polymorphisms (SNPs) across the genome. In GWAS, each analysis considers only 1 (or relatively few) phenotype, ignoring other potentially informative phenotypes in the dataset. Phenome-wide association studies (PheWAS) compliment GWAS by testing for genotype-phenotype associations across many phenotypes [9, 10].
Data from prospective clinical trials offer unique opportunities to apply PheWAS. The National Institutes of Health-funded AIDS Clinical Trials Group (ACTG) is the world's largest HIV therapeutics trials network. In ACTG protocols 384 [11], A5095 [12, 13], A5142 [14], and A5202 [15, 16], treatment-naive individuals were randomized to specific antiretroviral regimens as initial therapy. Before initiating therapy, blood was obtained for chemistry, hematology, virology, and immunology assays. We used data from these protocols for a proof-of-concept PheWAS, exploring associations between SNPs and antiretroviral-naive laboratory data.
This PheWAS was performed: (1) to establish baseline associations between clinical laboratory measurements and SNPs before pursuing PheWAS of on-treatment phenotypes; (2) to identify properties and principles of PheWAS using baseline laboratory data from clinical trials; (3) to test the utility of a data analysis pipeline for this first-ever PheWAS to use clinical trials data; (4) and to perform the first PheWAS using genome-wide genotypic data. We show that analyses are robust, demonstrate associations with multiple phenotypes in 2 independent datasets, and demonstrate some results that replicate previously reported associations. We also identify associations previously reported only in HIV-negative populations. We replicate a well established association with control of plasma HIV-1 RNA [17]. We also describe potentially novel associations that may warrant further study, and we demonstrate the principle of pleiotropy.
MATERIALS AND METHODS
Study Participants
The 4 ACTG protocols enrolled antiretroviral treatment-naive individuals at least 18 years of age. Study designs and primary study results have been reported [11–16]. Table 1 provides samples sizes and self-reported race or ethnicities. Informed consent for genetic research was obtained under ACTG protocol A5128.
Information Regarding ACTG Protocols
| Genotyping Phase | PheWAS Dataset | Study | Number Subjects | Self-Reported Race/Ethnicity | % Provided DNA | References |
|---|---|---|---|---|---|---|
| I | I | A5095 | 1147 | 40% White | 88 | [12, 13] |
| 37% Black | ||||||
| 21% Hispanic | ||||||
| II | I | ACTG 384 | 898 | 46% White | 63a | [11] |
| 35% Black | ||||||
| 17% Hispanic | ||||||
| II | I | A5142 | 757 | 36% White | 87 | [14] |
| 42% Black | ||||||
| 19% Hispanic | ||||||
| III | II | A5202 | 1864 | 47% White | 87 | [15, 16] |
| 26% Black | ||||||
| 25% Hispanic |
Abbreviations: ACTG, AIDS Clinical Trials Group; PheWAS, Phenome-Wide Association Studies.
a Genetic consenting and DNA from protocol ACTG 384 is lower than other protocols because the ACTG's genetic consent protocol A5128 became available in 2002 because follow-up of ACTG 384 participants was ending.
Laboratory Phenotypes
Data for 27 pretreatment and baseline laboratory assays (ie, before initiating therapy) were available. Using a MySQL database, we assembled data for these laboratory phenotypes and applied quality control (QC) measures (Figure 1). For each phenotype, we inspected frequency distribution plots and reviewed summary information, identified phenotypes requiring transformation to approximate normality, assured consistent units of measurement, and censored outliers judged to be implausible. Post-QC information is summarized in Table 2. In regression analyses, CD4 T-cell count was only used as a covariate, not as a dependent phenotype. Absolute basophil count measurements were both natural log-transformed and used as a binary variable.
Data for 27 Pretreatment Laboratory Phenotypesa and Summary Statistics
| Phenotypes | Sample Size | Median | Min | Max | Transformation |
|---|---|---|---|---|---|
| Absolute basophil countb | 2739 | – | – | – | Binary |
| Absolute eosinophil count | 2809 | 2.06 | 0 | 3.51 | Natural log |
| Absolute lymphocyte count | 2847 | 3.13 | 0 | 4.83 | Natural log |
| Absolute monocyte count | 2823 | 2.6 | 0 | 4.36 | Natural log |
| Absolute neutrophil count | 2957 | 3.32 | 2.54 | 4.03 | Natural log |
| ALT | 2960 | 1.51 | 0.3 | 2.29 | Natural log |
| alkaline Phosphatase | 2966 | 1.89 | 0.78 | 2.72 | Natural log |
| AST | 2964 | 1.48 | 1.04 | 2.27 | Natural log |
| Blood urea nitrogen | 2954 | 1.11 | 0.2 | 2.17 | Natural log |
| Carbon dioxide/bicarbonate | 2664 | 26 | 12 | 35 | |
| CD4 T-cell countb | 3286 | 224 | 0 | 1336 | Square root |
| CD8 T-cell count | 3286 | 2.88 | 1.54 | 3.76 | Natural log |
| Chloride | 2773 | 103 | 89 | 116 | |
| Creatinine | 2986 | 0.9 | 0 | 2.5 | |
| Glucose (fasting) | 1761 | 1.93 | 1.53 | 2.64 | Natural log |
| Triglycerides (fasting) | 2023 | 2.06 | 1.11 | 3.45 | Natural log |
| Glucose (nonfasting) | 1175 | 1.93 | 1.48 | 2.6 | Natural log |
| Hematocrit | 3010 | 40 | 18 | 57.5 | |
| Hemoglobin | 3026 | 13.9 | 6 | 20 | |
| HDL-C | 2456 | 1.56 | 0.7 | 2.17 | Natural log |
| LDL-C | 2235 | 94 | 12 | 262 | |
| Platelet count | 3000 | 202 | 36 | 648 | |
| Potassium | 2773 | 4.1 | 2.2 | 5.7 | |
| HIV-1 RNA | 3269 | 4.61 | 0.95 | 7.27 | Natural log |
| Sodium | 2776 | 139 | 127 | 151 | |
| Total bilirubin | 2925 | 0.5 | 0.1 | 2.3 | |
| Total cholesterol | 2852 | 158 | 6 | 350 |
Abbreviations: ALT, alanine amino transferase; AST, aspartate amino transferase; HDL-C, high-density lipoprotein cholesterol; HIV, human immunodeficiency virus; LDL-C, low-density lipoprotein cholesterol; Max, maximum; Min, minimum.
a Original units (before transformations) for each phenotype were as follows: cells × 103/µL for absolute basophil count, absolute eosinophil count, absolute lymphocyte count, absolute monocyte count, absolute neutrophil count, and platelet count; U/L for ALT, alkaline phosphatase, and AST; mg/dL for blood urea nitrogen, creatinine, glucose (fasting), glucose (nonfasting), triglycerides (fasting), HDL-C, LDL-C, total bilirubin, and total cholesterol; mmol/L for carbon dioxide/bicarbonate, chloride, potassium, sodium; cells/µL for CD4 T-cell count and CD8 T-cell count; % for hematocrit; g/dL for hematocrit; copies/mL for HIV-1 RNA.
b Absolute basophil count measurements were used for regressions both natural log transformed as well as dichotomized into a binary variable, and CD4 T-cell counts were only used as a covariate and not as a dependent variable.
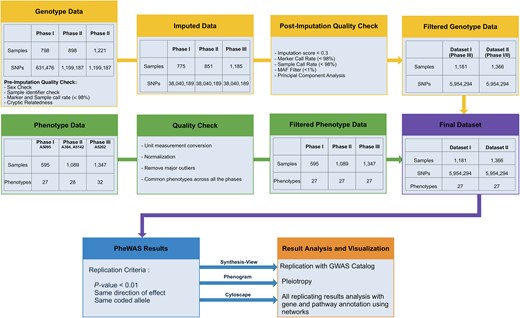
Study flowchart for genotypic and phenotypic data and analyses. The graphic illustrates steps used for quality control for genotypic and phenotype data, imputation of genotypic data, criteria for passing filtering threshold for associations across 2 datasets, and software tools used for result interpretation. Abbreviations: GWAS, Genome-Wide Association Studies; MAF, minor allele frequency; PheWAS, Phenome-Wide Association Studies; SNP, single-nucleotide polymorphisms.
Genotyping
A total of 2917 individuals were genotyped by 2 assays and in 3 phases, as part of a separate immunogenomics project [17]: Phase I (A5095) was genotyped with Illumina HumanHap 650Y array; Phase II (ACTG384 and A5142) and Phase III (A5202) were genotyped with the Illumina 1M duo array, as summarized in Table 3. Genotyping occurred in 3 phases, which we combined into 2 datasets for association testing and identifying results present in both datasets.
Genotyping Summary by Dataset and Phase
| Dataset | Phase | Study | N | Number of SNPs | Assay |
|---|---|---|---|---|---|
| Dataset 1 | Phase I | A5095 | 798 | 631 476 | Illumina 650Y |
| Phase II | A384, A5142 | 898 | 1 199 187 | Illumina 1M Duo | |
| Dataset 2 | Phase III | A5202 | 1221 | 1 199 187 | Illumina 1M Duo |
| Dataset | Phase | Study | N | Number of SNPs | Assay |
|---|---|---|---|---|---|
| Dataset 1 | Phase I | A5095 | 798 | 631 476 | Illumina 650Y |
| Phase II | A384, A5142 | 898 | 1 199 187 | Illumina 1M Duo | |
| Dataset 2 | Phase III | A5202 | 1221 | 1 199 187 | Illumina 1M Duo |
Abbreviation: SNP, single-nucleotide polymorphism.
Quality Control and Imputation
The PLINK program and R statistical programming language were used for QC procedures [18, 19] (summarized in Figure 1). Polymorphisms were censored for call rates <98%. We excluded 22 samples in which genetically inferred sex differed from clinical data, or missing sex status that could not be inferred. We excluded 30 samples from Phase II for specimen/data labeling inconsistency. We excluded 54 samples with overall genotyping call rates <98%. We excluded 4 samples with cryptic relatedness based on identity-by-descent estimates > 0.3 from approximately 100 000 pruned SNPs. This yielded 2811 samples for imputation.
Post-QC data from each phase were imputed to 1000 Genomes [20] after converting to genome build 37 using liftOver [21] and stratifying by chromosome to parallelize imputation processing. ShapeIt2 [22] was used to check strand alignment and to phase data. The IMPUTE2 algorithm [23] was used to impute additional genotypes that were available in the 1000 Genomes reference panel but not directly genotyped. Each chromosome was segmented into 6 Mb regions with at least 3500 reference variants in each region. Imputed genotypes were included if posterior probabilities exceeded 0.9.
Quality of imputed data was assessed following the Electronic Medical Records and Genomics (eMERGE) protocol [24]. Each chromosome from each phase was checked for 100% concordance with genotyped data. No batch effects were found. We dropped imputed SNPs with imputation scores <0.3, genotyping call rates <98% and minor allele frequencies < 0.01.
Statistical Analysis
Phase III represented many more subjects than Phase I or Phase II. Therefore, to seek replication, we divided the data into 2 comparable-sized groups: Dataset I (Phase III representing protocol A5202) and Dataset II (Phases I and II representing protocols ACTG384, A5095, and A5142). When linked with available clinical laboratory data, final datasets included 1181 subjects for Dataset I, 1366 subjects for Dataset II, and 5 954 294 SNPs for each dataset. Statistical analyses were limited to genetic loci shared by all genotyping phases after imputation.
Using the R statistical package, continuous traits were modeled with linear regression and dichotomous traits with logistic regression [19]. The first 5 principal components, calculated using EIGENSOFT [25], were used to adjust for global ancestry. Each analysis was also adjusted for sex and age. In the secondary analyses, we also adjusted for CD4 T-cell counts (square-root transformed), a marker of HIV-1 disease progression. All results presented herein are for PheWAS associations adjusted for square-root transformed CD4 T-cell counts. Results were not substantially different when not adjusted for this covariate (data not shown).
We first identified SNP-phenotype associations with P values < .01 and with the same direction of association in both datasets, using replication to reduce the impact of multiple testing [26]. In addition to seeking internal replication across the 2 datasets (instead of P-value correction to control type-I error), for external replication we leveraged SNP associations posted to the GWAS Catalog [27].
Biological Annotation of Results
Biofilter [28] was used to annotate PheWAS results with previously reported associations from the GWAS Catalog through October 2013, with GWAS Catalog P values < 1 × 10⁻⁵ [27]. Biofilter was also used to annotate (1) SNPs with gene information as well as (2) biological pathway information from the Kyoto Encyclopedia of Genes (KEGG) [29].
Summarizing Association Results
Many SNPs were correlated with each other due to extensive genotypic coverage provided by imputation. Using all SNPs that passed our PheWAS P-value filter threshold for associations across Dataset I and Dataset II, we estimated SNP haplotype blocks with Haploview [30] implemented in PLINK [18] separately for each dataset. We grouped these SNPs into linkage disequilibrium (LD) haplotype blocks using 10 000 kb windows. For Dataset I, 4246 SNPs collapsed into 668 LD blocks, and 6338 SNPs did not collapse into an LD block. For Dataset II, 4428 SNPs collapsed into 694 LD blocks, and 6156 SNPs did not collapse into an LD block. Haplotype blocks and association results were imported into a MySQL database. This process allowed results to be collapsed based on LD, streamlining exploration of association signals across correlated SNPs and facilitating evaluation of groups of SNPs in LD associated consistently with multiple phenotypes.
We provide all association results with haplotype block information for each dataset, as well as the nearest gene(s), and any known GWAS Catalog associations, at http://ritchielab.psu.edu/publications/supplementary-data/actg-phewas (Supplementary Table 1).
Visualizing Association Results
Synthesis-View [31] was used to visualize results that replicated GWAS Catalog associations. Phenogram [32] was used to visualize results for potentially pleiotropic SNPs. GGPlot2 [33] was used to generate Manhattan plots.
Phenotype Network Exploration Among Single-Nucleotide Polymorphisms, Genes, and Pathways
For SNPs passing the previously stated P-value threshold and associated with multiple phenotypes, we explored network connections and phenotypes in the context of pathways, and we visualized the results. Results are available at http://ritchielab.psu.edu/publications/supplementary-data/actg-phewas (File 1).
RESULTS
Among 2547 individuals, 5 954 294 SNPs were tested for association with 27 pretreatment laboratory phenotypes listed in Table 2. We summarize our overall data management, analysis, and interpretation strategy in Figure 1. For further study, we considered results with P ≤ .01 in both Datasets I and II for the same SNP and phenotype, with the same direction of association. These criteria were met by 10 584 (0.17%) of the SNPs, representing 10 963 SNP-phenotype associations. A Manhattan plot showing −log10P values for these SNP-phenotype associations is shown in Figure 2.
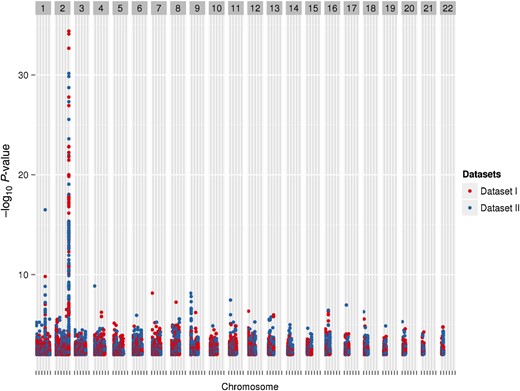
A Manhattan plot representing phenotype-single-nucleotide polymorphism (SNP) pairs that meet the P-value threshold. Each marker represents a phenotype-SNP pair with P < .01 in both datasets, with the same direction of association. Red markers represent Dataset I, and blue markers represent Dataset II. The peak on chromosome 2 is for total bilirubin with rs887829 in the UGT1A locus (Dataset I, β = 0.149 and P value = 4.04 × 10⁻³⁵; Dataset II, β = 0.115 and P value = 7.05 × 10⁻³¹).
Replication of Previously Reported Associations From Genome-Wide Association Studies
Among these 10 584 SNPs, we identified those matching any GWAS Catalog SNP regardless of phenotype. The GWAS Catalog includes results from published GWAS meeting catalog criteria [27]. A total of 43 SNPs from our study was represented in the GWAS Catalog. Summary information regarding associations for these 43 SNPs is in Figure 3.
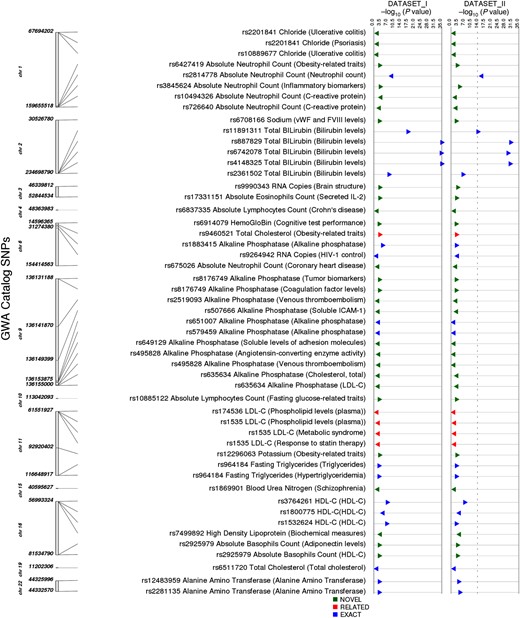
Results for single-nucleotide polymorphisms (SNPs) also in the Genome-Wide Association Studies (GWAS) Catalog and regardless of catalog phenotype. The track on the left indicates the chromosomal location of each SNP, the next track indicates the SNP, the associated phenotype in our study, and (in parenthesis) the GWAS Catalog phenotype. The next track indicates whether our association was as follows: an “exact” match with the GWAS Catalog phenotype; “related” with similarity to the GWAS Catalog phenotype; or “novel” with no apparent similarity to the GWAS Catalog phenotype. All P values less than 1 × 10⁻¹⁰ are represented by a larger triangle. Triangles point to the right if beta is positive and to the left if beta is negative. Abbreviations: HDL-C, high-density lipoprotein cholesterol; HIV, human immunodeficiency virus; LDL-C, low-density lipoprotein cholesterol.
Of the 43 SNPs, 20 (47%) SNP-phenotype pairs matched identical or very closely related GWAS Catalog associations (Figure 4, details at http://ritchielab.psu.edu/publications/supplementary-data/actg-phewas [Supplementary Table 2]). The lowest P value in our study was for higher total bilirubin levels and rs887829-T in UGT1A1 on chromosome 2 (Dataset I: β = 0.149 and P value = 4.04 × 10⁻³⁵, Dataset II: β = 0.115 and P value = 7.05 × 10⁻³¹) [34]. A second example was lower absolute neutrophil counts associated with rs2814778-C in DARC on chromosome 1 (Dataset I: β = −0.106, P = 1.5 × 10⁻¹⁰; Dataset II: β = −0.11, P = 3.2 × 10⁻¹⁷) [35]. Another very close match was rs1535-G within FADS2 on chromosome 11 associated with low-density lipoprotein cholesterol (LDL-C) levels in our study (Dataset I: β = −5.17 and P value = .0013, Dataset II: β = −5.11 and P value = .0037), which was previously associated with high-density lipoprotein cholesterol (HDL-C levels) [36], plasma phospholipid levels [37], and HDL-C response to statin therapy [38].
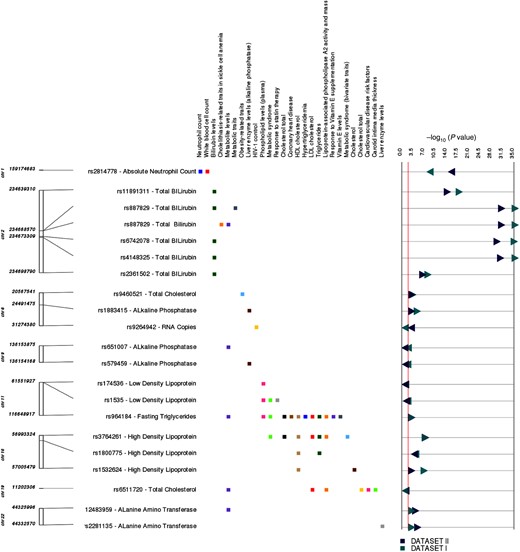
The graphic illustrates study associations replicating previously reported genotype-phenotype associations. The left-most track indicates chromosome and coordinate position. The single-nucleotide polymorphism (SNP) for each association is listed, with the associated clinical laboratory measurement. Each phenotype where we replicated a previous reported result is listed in the next track, with boxes to the right indicating the phenotype for the previously reported SNP-phenotype association: green, total bilirubin levels; brown, high-density lipoprotein cholesterol (HDL-C); blue, absolute neutrophil count; black, total cholesterol levels. Dark green triangles and dark blue triangles represent P values from Dataset I and Dataset II, respectively. Right-pointing triangles indicate positive direction of association, and left-pointing triangles indicate negative direction of association. Abbreviations: HDL, low-density lipoprotein; HIV, human immunodeficiency virus.
Of the 20 SNPs with identical or very closely related phenotypes in the GWAS Catalog, 3 traits associated with 6 SNPs had not been previously reported in HIV-positive individuals: alanine amino transferase (ALT) levels, alkaline phosphatase levels, and absolute neutrophil count, indicating that these associations were not completely abrogated by HIV-1 infection. External replications of PheWAS associations for 20 SNPs using the GWAS Catalog indicate that our PheWAS analysis pipeline is robust.
Potentially Novel Associations for Genome-Wide Association Studies Catalog Single-Nucleotide Polymorphisms
We identified 23 SNPs with 29 associations where the GWAS Catalog phenotype differed considerably from that in our study (http://ritchielab.psu.edu/publications/supplementary-data/actg-phewas) (Supplementary Table 2). For example, rs10494326 was associated with neutrophil count (Dataset I: P = 5.53 × 10⁻⁵, β = −0.062; Dataset II P = .0013, β = −0.049), but in the GWAS Catalog it was associated with C-reactive protein levels. Likewise, rs2201841 in IL23R-G was associated with plasma chloride concentrations (Dataset I: P = .0042 and β = −0.40, Dataset II: P = .0064 and β = −0.40), but in the GWAS Catalog it was associated with psoriasis, ulcerative colitis, and Crohn's disease [35, 39, 40].
Summary of All Results
As noted above, 10 584 SNPs passed our PheWAS P-value filter for association with at least 1 phenotype in more than 1 dataset, yielding 10 963 SNP-phenotype associations, because some SNPs were associated with multiple phenotypes. Separate Manhattan plots for each phenotype are provided at http://ritchielab.psu.edu/publications/supplementary-data/actg-phewas (Supplementary Figure 1). We leveraged LD between SNPs to identify regions of concomitant results that passed our PheWAS P-value filter threshold. These results are available at http://ritchielab.psu.edu/publications/supplementary-data/actg-phewas (Supplementary Table 1), sorted by SNP, chromosome, coordinate position, indicating LD blocks, nearby genes, and reported GWAS Catalog traits.
The most significant and consistent associations were with bilirubin. A region on chromosome 2 containing 166 SNPs, within multiple LD blocks in Dataset I and Dataset II, was associated with total bilirubin, including UGT1A rs887829-T, which replicates previous reports (Figure 3). This region contains 4 other SNPs replicating reported GWAS associations with bilirubin: UGT1A rs11891311-A, rs4148325-T, and rs6742078-T, and nearby HEATR7B1 rs2361502-C [41].
As another example, 160 closely located SNPs passed our PheWAS P-value filter threshold for association with neutrophil count. These include DARC rs2814778-C, a peak in Manhattan plot for neutrophil counts (http://ritchielab.psu.edu/publications/supplementary-data/actg-phewas) (Supplementary Figure 2). This SNP has been associated with lower neutrophil counts in African Americans [42], and it confers protection against malaria in West Africans [43]. This locus has been reported to have a wide peak of associations on chromosome 1, with white blood cell count associations in African Americans [42], consistent with our findings.
Our PheWAS P-value filter threshold also revealed clusters of associations with neutrophil counts on chromosome 2 (22 intergenic SNPs) and chromosome 6 (24 SNPs within OPRM1). Results are available in Supplementary Figure 2 (see link above) (http://ritchielab.psu.edu/publications/supplementary-data/actg-phewas). Loci on chromosome 2 do not match GWAS Catalog SNPs, whereas on chromosome 6, rs675026-A was previously associated with coronary disease in African Americans [44]. Associations with neutrophil counts for the SNPs on chromosome 6 are shown in Supplementary Figure 2 (link above) (http://ritchielab.psu.edu/publications/supplementary-data/actg-phewas).
Another example of a cluster of associations involves SNPs associated with hematocrit and hemoglobin levels, which is visible in a peak on chromosome 2 in Manhattan plots, available at http://ritchielab.psu.edu/publications/supplementary-data/actg-phewas (Supplemental Figures 1 and 3).
Evidence of Pleiotropy
An important property of PheWAS is the ability to reveal cross-phenotype associations and potential pleiotropy [45]. Several laboratory phenotypes in the present study were correlated (eg, LDL and total cholesterol), so it was expected that some SNPs would associate with multiple phenotypes. Locations of SNPs that passed our PheWAS P-value filter threshold and associated with multiple laboratory phenotypes are shown at http://ritchielab.psu.edu/publications/supplementary-data/actg-phewas (Supplemental Figure 4). For example, 45 SNPs in an 89 kb LD block on chromosome 7 were associated with the correlated phenotypes LDL-C and total cholesterol. In addition, there were associations of CD8 T-cell count and absolute lymphocyte count with 39 SNPs in an LD block of 183 kb on chromosome 6.
Exploration of Network Connections
We explored potential connections between SNPs and multiple phenotypes linked via gene information to biological pathways using KEGG, and we visualized these networks (presented at http://ritchielab.psu.edu/publications/supplementary-data/actg-phewas) (Supplementary File 1). Correlated phenotypes tended to cluster together (eg, hematocrit with hemoglobin; HDL-C with LDL-C and total cholesterol) because the same SNPs/genes had associations with correlated phenotypes. Integration of gene and KEGG pathway information showed a lipid measurement phenotype cluster in the network, with many connections to various metabolic pathways. For example, PGLS (a pentose phosphate pathway gene) connected with both total cholesterol and HDL phenotypes, because PGLS SNPs were associated with both phenotypes. Likewise, NT5M (a gene in purine metabolism and nicotinate and nicotinamide metabolism pathways) had SNPs connected with all 3 phenotypes.
DISCUSSION
The present proof-of-concept PheWAS considered pretreatment laboratory phenotypes collected from HIV-infected individuals enrolled in prospective, randomized clinical trials. We show that PheWAS effectively identified previously reported SNP-phenotype associations or associations with phenotypes very similar to SNP-phenotype associations reported in the GWAS Catalog. Several of the associations were not previously reported in HIV-infected cohorts. We also replicate a known genetic association with control of HIV-1 replication. These findings establish the utility of this PheWAS pipeline for detecting true associations, in anticipation of analyses that will be performed using on-treatment phenotypes during these clinical trials. We also identified potentially novel associations, supporting the utility of this PheWAS pipeline for hypothesis generation.
To date, PheWAS has only been pursued with electronic medical health data [46] and data from large epidemiological studies [9, 10]. The present study is the first PheWAS to use phenotypes collected from subjects enrolled in a prospective clinical trial (albeit focused on pretreatment phenotypes), and it is also the first PheWAS to use genome-wide genotypic data.
Among previous GWAS results also identified in this PheWAS, our most significant result was for UGT1A1 rs887829-T associated with bilirubin levels. Nearby SNPs were also associated with bilirubin levels at the UGT1A locus, including 4 SNPs that also had been previously reported in the GWAS Catalog as associated with bilirubin levels. We replicated other previously reported GWAS associations across the 27 phenotypes for identical or very closely related phenotypes. Phenotype associations that replicated previous reports included SNPs associated with absolute neutrophil counts, alkaline phosphatase levels, HDL-C levels, total cholesterol levels, LDL-C levels, HIV-1 RNA levels, and fasting triglycerides. With the high coverage of the genotypic data of this study, we found additional potentially novel associations, some of which were in LD with previously reported SNPs, whereas other associations were in separate regions and uncorrelated with previously reported SNPs. These included associations with neutrophil counts and fasting glucose levels. All potentially novel results may warrant further research to determine whether these represent biologically relevant relationships between genotype and phenotype.
There were limitations to the present study. Our samples size was relatively small compared with many GWAS. Although we readily identified multiple true associations, a larger sample size may have revealed additional associations. However, clinical trials data typically have sample sizes considerably smaller than epidemiological studies of complex traits. Despite this limitation, data from prospective clinical trials offer a unique opportunity for PheWAS. We did not use a Bonferroni correction for our P values in this study, for multiple reasons. First, Bonferroni corrections are usually applied to datasets in which replication is not sought in an independent dataset. Furthermore, the Bonferroni correction assumes independent tests, and we had correlated phenotypes (shown at http://ritchielab.psu.edu/publications/supplementary-data/actg-phewas) (Supplementary Figure 5) as well as correlated genotypes. Thus, we divided our larger dataset in 2 so we could seek replication across more than 1 dataset, to assist in filtering results for consistent association results for further study. Potentially novel associations reported herein will need further research to determine any relevant biology underlying these associations. We also relied heavily on reported associations of the GWAS Catalog, although some thoroughly validated SNP associations have not been posted to the GWAS Catalog. This is particularly the case for ADME SNPs, where many functional polymorphisms have been well replicated outside the context of GWAS. For on-treatment PheWAS, known functional polymorphisms in ADME genes will also be used for external replication, increasing our likelihood of detecting true associations. These may be particularly informative because effect sizes for ADME SNP associations are often marked. In this study, we limited analyses to individual SNPs, but for some phenotypes combinations of multiple SNPs provide better prediction. For example, plasma exposure for the antiretroviral drug efavirenz is best explained by a composite genotype comprising 3 SNPs in CYP2B6 and 1 SNP in CYP2A6 [3, 4, 47]. Such composite genotypes will be included in on-treatment PheWAS.
CONCLUSIONS
This analysis provides a better understanding of the properties of PheWAS, and principles that will inform PheWAS that we will apply to on-treatment data from these clinical trials. Using our criteria for evaluating results (ie, by seeking replication across 2 independent datasets), we identified numerous associations. All associations that may be novel will require additional study to determine whether they accurately reflect novel biological findings. Seeking replication across datasets has provided an initial filter to reduce false discovery. More importantly, we heavily leveraged a priori knowledge of SNP associations represented in the GWAS Catalog. With such knowledge, we readily identified associations previously reported only in HIV-negative populations. This empirically shows the utility of PheWAS for such SNPs. The present proof-of-concept PheWAS only considered 27 phenotypes, a modest number compared with some PheWAS analyses of large observational datasets that may consider hundreds or thousands of phenotypes. Our decision to analyze fewer phenotypes reflects an appreciation of issues that may arise in PheWAS using clinical trials data before embarking on more aggressive PheWAS, including on-treatment data. It is apparent that disease-specific knowledge will be essential to interpret associations and to prioritize potential associations for further replication and study. It has been possible to codify the principles of GWAS largely because the human genome is relatively static, and because phenotypes can typically be evaluated through either logistic or linear regression. Because every “phenome” is unique, PheWAS, at present, benefits more than GWAS from disease-specific knowledge and understanding, including relationships among phenotypes.
Identifying SNPs associated with drug response for HIV-infected patients has the potential to improve treatment safety and efficacy. This proof-of-concept PheWAS identified associations with multiple baseline laboratory phenotypes, thus validating this genome-wide PheWAS approach in anticipation of applying PheWAS to on-treatment data from prospective clinical trials. Identifying relationships with various phenotypes may benefit from analyses that consider intermediate phenotypes, sub-phenotypes, biomarkers, and endophenotypes that may be more closely tied to underlying mechanisms. We can also leverage networks of connections between phenotypes and genotypes, combined with additional biological information, to better understand associations. In the future, we will apply PheWAS to on-treatment phenotype data from prospective, randomized clinical trials.
Supplementary Material
Supplementary material is available online at Open Forum Infectious Diseases (http://OpenForumInfectiousDiseases.oxfordjournals.org/).
Acknowledgments
We are grateful to the many persons with HIV infection who volunteered for ACTG384, A5095, A5142, A5202, and A5128. In addition, we acknowledge the contributions of study teams and site staff for these protocols.
Disclaimer. The content is solely the responsibility of the authors and does not necessarily represent the official views of the National Institute of Allergy and Infectious Diseases or the National Institutes of Health.
Financial support. This project was supported by the National Institute of Allergy and Infectious Diseases ([NIAID] award number U01AI068636), the National Institute of Mental Health, and the National Institute of Dental and Craniofacial Research.
Grant support included TR000124 (to E. S. D.); AI064086 and AI36214 (to R. H.); AI077505, TR000445, AI069439 (to D. W. H.); and the National Human Genome Research Institute HG006385 and the National Heart, Lung, and Blood Institute HL065962 (to M. D. R.).
Study drugs were provided by Bristol-Myers Squibb Company (Princeton, NJ), Gilead Sciences (Gilead Sciences, Inc., Foster City, CA), GlaxoSmithKline, Inc. (Research Triangle Park, NC), and Boehringer Ingelheim (Ridgefield, CT).
Clinical research sites that participated in ACTG protocols ACTG 384, A5095, A5142, or A5202, and collected DNA under protocol A5128 were supported by the following grants from the National Institutes of Health (NIH) NIAID: AI069532, AI069484, AI069432, AI069450, AI069495, AI069434, AI069424, AI069439, AI069467, AI069423, AI069513, AI069477, AI069465, AI069419, AI069502, AI069474, AI069472, AI069501, AI069418, AI069494, AI069471, AI069511, AI069452, AI069428, AI069556, AI069415, AI032782, AI046376, AI046370, AI038858, AI034853, AI027661, AI025859, AI069470, AI027675, AI073961, AI050410, AI045008, AI050409, AI072626, AI069447, AI027658, AI027666, AI058740, and AI025868 and by the following grants from NIH National Center for Research Resources: RR000046, RR000425, RR025747, RR025777, RR025780, RR024996, RR024160, RR023561, RR024156, RR024160, and RR024160.
Potential conflicts of interest. E. S. D. has been principal investigator on research grants to University of California Los Angeles from Bristol Myers Squibb, Gilead, and ViiV and a consultant/advisor to Abbvie, Bristol Myers Squibb, Gilead, Merck, Teva, and ViiV. R. M. G. served as a coinvestigator on research grants to Weill Cornell Medical College sponsored by GlaxoSmithKline, Pfizer, and Viiv. R. H. has received honoraria or consultant fees from BMS, Gilead Sciences, Janssen, and Merck, and he has been principal investigator on a research grant to University of California, San Diego from Abbott, GlaxoSmithKline, Pfizer, and Merck. G. K. R. has been principal investigator on research grants to Massachusetts General Hospital from Gilead Sciences and has received royalties from Wolters Kluwer. D. W. H. has been principal investigator on a research grant to Vanderbilt from Merck, and he has been a consultant to Merck. All authors have submitted the ICMJE Form for Disclosure of Potential Conflicts of Interest. Conflicts that the editors consider relevant to the content of the manuscript have been disclosed.
References
Author notes
A. V. and C. M. contributed equally to this work.


Comments