


Abstract
In Australia, invasive meningococcal disease (IMD) incidence rapidly increased between 2014 and 2017 due to rising serogroup W (MenW) and MenY infections. We aimed to better understand the genetic diversity of IMD during 2017 and 2018 using whole genome sequencing data.
Whole genome sequencing data from 440 Australian IMD isolates collected during 2017 and 2018 and 1737 international MenW:CC11 isolates collected in Europe, Africa, Asia, North America, and South America between 1974 and 2020 were used in phylogenetic analyses; genetic relatedness was determined from single-nucleotide polymorphisms.
Australian isolates were as follows: 181 MenW (41%), 144 MenB (33%), 88 MenY (20%), 16 MenC (4%), 1 MenW/Y (0.2%), and 10 nongenogroupable (2%). Eighteen clonal complexes (CCs) were identified, and 3 (CC11, CC23, CC41/44) accounted for 78% of isolates (343/440). These CCs were associated with specific serogroups: CC11 (n = 199) predominated among MenW (n = 181) and MenC (n = 15), CC23 (n = 80) among MenY (n = 78), and CC41/44 (n = 64) among MenB (n = 64). MenB isolates were highly diverse, MenY were intermediately diverse, and MenW and MenC isolates demonstrated the least genetic diversity. Thirty serogroup and CC-specific genomic clusters were identified. International CC11 comparison revealed diversification of MenW in Australia.
Whole genome sequencing comprehensively characterized Australian IMD isolates, indexed their genetic variability, provided increased within-CC resolution, and elucidated the evolution of CC11 in Australia.
Invasive meningococcal disease (IMD) is a rare but life-threatening infection caused by the bacterium Neisseria meningitidis, an obligate human pathogen that commonly colonizes the nasopharynx [1]. IMD is an important cause of mortality and morbidity due to its significant case fatality rate (5%–15%) and high incidence of sequelae among survivors (10%–20%) [2, 3].
N meningitidis is classified into 12 serogroups based on capsular polysaccharide structure, with 6 (A, B, C, W, X, Y) causing most IMD worldwide [4, 5]. Vaccines against serogroups A/B/C/W/Y are currently available [6]. Meningococci are classified into lineages (sequence types [STs]) based on multilocus sequence typing (MLST) [7]. Closely related STs form clonal complexes (CCs) [7]. Some CCs (eg, CC41/44, CC11) cause most IMD and are termed hyperinvasive lineages [8, 9].
The epidemiology of IMD is unpredictable. Disease incidence and serogroup distribution vary temporally and geographically [5, 10]. The emergence of serogroup W (MenW) exemplifies this dynamism. MenW was previously a rare cause of IMD, but the first recorded MenW outbreak occurred in 2000 during the annual Hajj pilgrimage in Saudi Arabia, followed by a near-identical outbreak in 2001 [11, 12]. MenW subsequently emerged in the “meningitis belt” of sub-Saharan Africa, causing epidemics from the early 21st century [12, 13]. Thereafter, outbreaks and increases in endemic disease due to MenW were reported worldwide, including South America, Europe, and Australasia [14–17]. Many countries responded with MenACWY vaccination programs [10, 18].
Molecular typing of Hajj outbreak isolates identified a hypervirulent CC11 strain (PorA type P1.5,2) [12, 19]. Globally, most emergent MenW was attributed to CC11 [14]. Analysis of whole genome sequencing (WGS) data proved instrumental in elucidating the within-clone diversity of MenW:CC11 [20]. Two sublineages were identified: the Hajj and South American/UK sublineages, with the latter now delineated into the “original UK” and “UK-2013” strains [20, 21]. The original UK and UK-2013 strains were notable for atypical clinical presentations [22].
IMD is a notifiable disease in Australia: a federal nation comprising 8 states and territories [23]. IMD incidence decreased between 2002 and 2013 (from 3.5 to 0.6 cases per 100 000 population) [24]. This was associated with declining MenB and MenC infections and followed the 2003 inclusion of MenC vaccines on the National Immunisation Program (NIP) [23, 24]. A rapid increase in MenW and, to a lesser extent, MenY reversed this trend, and incidence increased yearly to 1.5 cases per 100 000 in 2017 [24].
Within Australia, MenW first emerged in 2014 in the state of Victoria (VIC), associated with older adults and atypical manifestations (eg, pneumonia, epiglottitis) [25, 26]. Molecular typing identified P1.5,2:ST11 meningococci; phylogenetic analysis revealed clustering with South American/UK strains [25]. MenW supplanted MenB as the predominant cause of IMD Australia-wide in 2016 [24]. Beginning mid-2017, there was a multijurisdictional MenW outbreak in the Northern Territory, Queensland (QLD), South Australia (SA), and Western Australia (WA); most cases occurred among Indigenous children in remote Central Australia [27, 28].
In Australia, vaccines are provided mostly through the NIP [23]. Additional vaccines may be funded through state/territory programs [29]. Until 2018, the NIP included MenC vaccines only, administered at 12 months. The NIP was amended in 2018 (MenACWY vaccines replaced MenC vaccines), in 2019 (MenACWY eligibility expanded to include 14- to 16-year-olds), and 2020 (MenB vaccines funded for Aboriginal and Torres Strait Islander children, certain medical conditions) [29]. Jurisdictions funded additional programs in 2017 and 2018: SA funded MenB vaccines for children and adolescents (2018–ongoing); VIC funded MenC vaccines for men who have sex with men (2018–2019); and multiple jurisdictions funded MenACWY vaccines prior to their NIP inclusion [27–31].
In response to the increase in MenW and to better understand the diversity of Australian meningococci, the Commonwealth Department of Health, in collaboration with states and territories, trialed a national IMD genomic surveillance initiative in 2017 with voluntary continuation in 2018. This initiative was coordinated by the Microbiological Diagnostic Unit Public Health Laboratory, the VIC bacterial reference laboratory. Here we outline the findings of this initiative and highlight valuable aspects of genomic surveillance.
METHODS
Epidemiologic Analysis
IMD is nationally notifiable: jurisdictions (New South Wales [NSW], Queensland [QLD], South Australia [SA], Tasmania [TAS], Victoria [VIC], Western Australia [WA], Australian Capital Territory [ACT], Northern Territory [NT]) must report confirmed/probable cases to the federal health department for inclusion in the National Notifiable Diseases Surveillance System. Laboratory specimens positive for N meningitidis are sent to reference laboratories in each jurisdiction—collectively, the National Neisseria Network, which undertakes national surveillance of N meningitidis and N gonorrhoeae. This study derived IMD notification data from the National Notifiable Diseases Surveillance System and the National Neisseria Network.
Isolate Selection
Australian Isolates
During the genomic trial period, N meningitidis isolates or sequence data from culture-positive Australian IMD cases were submitted to the Microbiological Diagnostic Unit Public Health Laboratory. Laboratories in QLD, NSW, and WA provided Illumina short-read sequence data. Isolates underwent WGS, quality control, and genomic analyses; sequence data underwent quality control and genomic analyses.
Samples collected between 1 January 2017 and 23 May 2019 were eligible for inclusion, covering the genomic trial and extended study period (Supplementary Table 1). Isolates from 2019 were opportunistically included to provide additional context. Non-VIC isolates from eye swabs were included; these jurisdictions classify such samples as having invasive potential.
International Sequences
Short-read sequence data (FASTQ) from 1737 international ST-11 isolates were selected for comparison with Australian CC11 isolates (Supplementary Table 2). These isolates were collected between 1974 and 2020 in Africa (n = 256, 11 countries represented), Asia (n = 10, 2 countries), Europe (n = 1458, 15 countries), North America (n = 1, 1 country), and South America (n = 11, 2 countries). Sixty-two isolates were of unknown collection year; 1 isolate was of unknown geographic origin. FASTQ files were preferred over genome assemblies for quality control purposes. These were identified through the PubMLST Neisseria database [32] on 3 June 2022 by using the following search criteria: serogroup/genogroup/capsule = W, clonal complex = ST-11, ENA accession number is not null (accession numbers were used to download sequence data from the Sequence Read Archive). Sequences were downloaded from the National Centre for Biotechnology Information Sequence Read Archive via SRA Toolkit version 3.0.0 (https://github.com/ncbi/sra-tools). These data were subject to quality control and genomic analyses.
Whole Genome Sequencing
Genomic DNA from pure isolates was extracted on QIAsymphony via the DSP Virus/Pathogen Mini Kit (Qiagen). Unique dual indexed libraries were prepared with the Nextera XT DNA sample preparation kit (Illumina). Libraries were sequenced on Illumina NextSeq 500/550 with 150-cycle paired end chemistry as described by the manufacturer.
Sequence Quality Control
Sequences were required to meet the following metrics for inclusion in genomic analyses: average Q score ≥30, estimated genome size within the range of N meningitidis (expected size, ∼2.2 MB), average estimated coverage ≥40, kmer identification of N meningitidis.
Genomic Analysis
Bioinformatics analysis was undertaken with bohra (https://github.com/MDU-PHL/bohra). De novo genome assemblies were used to establish in silico MLST (https://github.com/tseemann/mlst) and in silico serogroup and fine type (https://github.com/MDU-PHL/meningotype). Identification of core genome single-nucleotide polymorphisms (SNPs) was undertaken with snippy version 4.4.5 (https://github.com/tseemann/snippy). Reference genomes are listed in Supplementary Table 3.
Maximum likelihood phylogenies were generated with IQ-TREE [33] (http://www.iqtree.org/), with a GTR + G4 and 1000 bootstrap replicates. Phylogenies were annotated by R or iTOL (https://itol.embl.de/about.cgi) [34]. Genomic clusters were defined by single-linkage clustering of pairwise SNP distances with ≥2 sequences at the 30-SNP level. This cutoff was informed by the SNP distribution of the data set and supported by literature. Recombination was assessed with gubbins version 3.2.1 (https://github.com/nickjcroucher/gubbins) [35] and was found not to affect cluster interpretation.
RESULTS
To understand the diversity of Australian meningococci from 2017 to 2018, we analyzed 440 isolates from unique IMD cases (280 from 2017, 143 from 2018, 17 from 2019). Data set representativeness was assessed by comparing the number of isolates with the number of laboratory-confirmed cases reported, noting that isolates require a positive culture: 76% of cases (286/374) were culture positive in 2017, whereas 78% (216/278) were culture positive in 2018 [24]. Overall representativeness was higher for 2017 than 2018 (74% vs 51%). Representativeness by jurisdiction varied between the years; for example, NSW was the third most represented in 2017 (76%) but least represented in 2018 (18%). Representativeness decreased between 2017 and 2018 for all serogroups but dropped more for MenC (100% to 50%), MenW (86% to 53%), and MenY (83% to 60%) than MenB (60% to 47%). Isolates from 2019 were opportunistic inclusions; representativeness was not calculated. For more detail, see Supplementary Table 4.
Australian N meningitidis Population Is Diverse but Dominated by a Small Number of Clones
WGS typing agreed with most PCR-based results and could serogroup 11 of 21 isolates that were nongroupable by PCR techniques. Based on WGS results, the data set comprises 181 MenW, 144 MenB, 88 MenY, 16 MenC, 1 MenW/Y, and 10 nongenogroupable (NG) isolates.
WGS typing assigned isolates to 127 genotypes (serogroup: PorA: FetA: MLST: CC), including 77 finetypes (PorA/FetA), 78 STs, and 18 CCs (Supplementary Table 5). Most isolates in each serogroup were accounted for by a small number of finetypes belonging to 1 or 2 CCs. MenB was most diverse, being the only serogroup with 3 CCs assigned to ≥10 isolates (CC41/44, CC32, CC213) and accounting for 77 genotypes (61%) but only 144 isolates (33%). MenB isolates displayed the most phylogenetic diversity, as indicated by the longer branch lengths relative to MenC, MenY, and MenW (Figure 1).
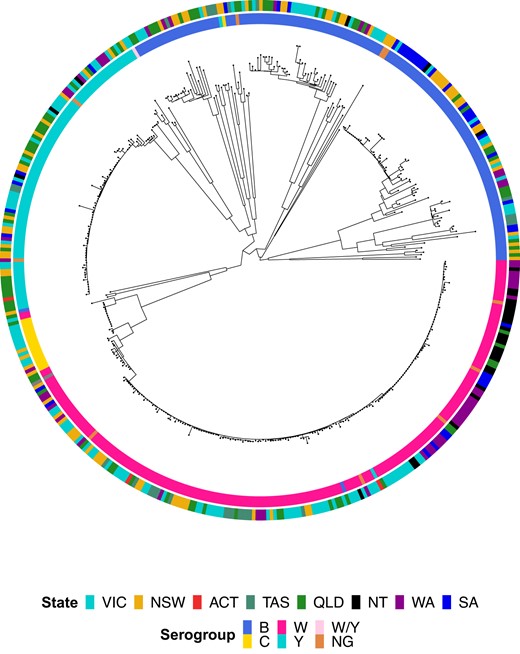
Maximum likelihood phylogenetic tree for all serogroup B, C, W, Y, W/Y, and nongenogroupable (NG) invasive meningococcal disease isolates submitted to the Microbiological Diagnostic Unit Public Health Laboratory, collected between 1 January 2017 and 23 May 2019. Isolate metadata are shown by the colored rings surrounding the tree. Isolate serogroup is displayed by the inner ring and jurisdiction by the outer ring; see legend for color scheme. ACT, Australian Capital Territory; NSW, New South Wales; NT, Northern Territory; QLD, Queensland; SA, South Australia; TAS, Tasmania; VIC, Victoria; WA, Western Australia.
WGS Can Describe Within-Strain Diversity
The identification of closely related cases may improve public health responses by enhancing understanding of local transmission dynamics and at-risk populations. Based on SNP-based analyses, genomic clusters of closely related isolates were identified. All clusters occurred within the 3 most prevalent CCs; they are described in turn.
ST-11 Complex
CC11 was the dominant CC during 2017 and 2018 (199/440, 45%), observed mostly in MenW (178/199, 89%) and MenC (15/199, 8%) isolates but also in MenB (1/199, 0.5%), MenY (1/199, 0.5%), and NG (4/199, 2%) isolates (Supplementary Table 5).
Fourteen genotypes were identified in MenW:CC11; most prevalent (111/178, 62%) was W:P1.5,2:F1-1:ST11. Most remaining MenW:CC11 (64/67, 96%) and all NG:CC11 (4/4, 100%) isolates differed from this genotype by just 1 of PorA, FetA, ST. Most MenW:CC11 clusters (12/15) comprised isolates of genotype W:P1.5,2:F1-1:ST11 (Table 1).
Genomic Clusters Detected Within Invasive Meningococcal Disease Isolates Submitted to the Microbiological Diagnostic Unit Public Health Laboratory, Collected Between 1 January 2017 and 23 May 2019
| Genomic Cluster | No. of Isolates | Age, y, Mean (Range) | Duration, d | Time Between Samples, Mean, d | WGS Genotype (No. of Isolates) | Jurisdictions (No. of Isolates) |
|---|---|---|---|---|---|---|
| B-1 | 2 | 3 (2–3) | 0 | 0.0 | B: P1.18–1,34: F1-5: ST-6058 (cc41/44) (2) | QLD |
| B-2 | 3 | 21 (15–28) | 362 | 120.7 | B: P1.5,2: F1-1: ST-154 (cc41/44) (3) | NSW |
| B-3 | 4 | 28 (0–61) | 367 | 91.8 | B: P1.7-2,4: F1-5: ST-154 (cc41/44) (4) | NSW (2), SA (2) |
| B-4 | 6 | 33 (4–59) | 420 | 70.0 | B: P1.7-2,4: F1-5: ST-154 (cc41/44) (6) | SA |
| B-5 | 3 | 39 (16–57) | 2 | 0.7 | B: P1.7-2,4: F1-5: ST-154 (cc41/44) (3) | SA (1), VIC (1), NT (1) |
| B-6 | 2 | 23 (22–24) | 13 | 6.5 | B: P1.7-2,4: F1-5: ST-154 (cc41/44) (2) | SA (1), VIC (1) |
| C-1 | 8 | 32 (25–37) | 188 | 23.5 | C: P1.5-1,10-8: F3-6: ST-11 (cc11) (8) | VIC (6), NSW (2) |
| W-1 | 5 | 38 (19–71) | 619 | 123.8 | W: P1.5,2: F1-1: ST-11 (cc11) (5) | VIC (5) |
| W-2 | 8 | 57 (0–79) | 476 | 59.5 | W: P1.5,2: F1-1: ST-11 (cc11) (7) W: P1.5,2: F1-1:—(1) | VIC (6), NSW (1), TAS (1) |
| W-3 | 5 | 63 (26–92) | 661 | 132.2 | W: P1.5,2: F1-1: ST-11 (cc11) (5) | QLD (2), NSW (2), TAS (1) |
| W-4 | 3 | 40 (0–68) | 61 | 20.3 | W: P1.5,2: F1-1: ST-11 (cc11) (3) | QLD (1), NSW (2) |
| W-5 | 17 | 23 (1–71) | 597 | 35.1 | W: P1.5,2: F1-1: ST-12351 (cc11) (15) NG: P1.5,2: F1-1: ST-12351 (cc11) (1) W: P1.5,2: F1-1: ST-12897 (cc11) (1) | WA (11), SA (3), QLD (2), NT (1) |
| W-6 | 2 | 44 (18–69) | 230 | 115.0 | W: P1.5,2: F1-1: ST-11 (cc11) (2) | QLD (2) |
| W-7 | 4 | 53 (18–78) | 355 | 88.8 | W: P1.5,2: F1-1: ST-11 (cc11) (4) | VIC (3), TAS (1) |
| W-8 | 2 | 20 (20–20) | 36 | 18.0 | W: P1.5,2: F1-1: ST-1287 (cc11) (2) | SA (1), NSW (1) |
| W-9 | 21 | 11 (0–45) | 341 | 16.2 | W: P1.5,2: F1-1: ST-1287 (cc11) (20) W: P1.5,2-12: F1-1: ST-1287 (cc11) (1) | NT (14), QLD (4), WA (3) |
| W-10 | 2 | 73 (70–76) | 606 | 303.0 | W: P1.5,2: F1-1: ST-11 (cc11) (2) | VIC (2) |
| W-11 | 2 | 5 (3–7) | 4 | 2.0 | W: P1.5,2: F1-1: ST-1287 (cc11) (2) | SA (2) |
| W-12 | 2 | 50 (18–81) | 73 | 36.5 | W: P1.5,2: F1-1: ST-11 (cc11) (2) | NSW (3) |
| W-13 | 2 | 36 (22–50) | 144 | 72.0 | W: P1.5,2: F1-1: ST-11 (cc11) (2) | WA (2) |
| W-14 | 2 | 55 (48–62) | 13 | 6.5 | W: P1.5,2: F1-1: ST-11 (cc11) (2) | VIC (2) |
| W-15 | 2 | 18 (0–36) | 4 | 2.0 | W: P1.5,2: F1-1: ST-11 (cc11) (2) | TAS (2) |
| Y-1 | 3 | 67 (56–76) | 497 | 165.7 | Y: P1.5-1,10-1: F4-1: ST-1655 (cc23) (3) | QLD (3) |
| Y-2 | 3 | 71 (52–92) | 40 | 13.3 | Y: P1.5-2,10-29: F4-1: ST-23 (cc23) (3) | VIC (1), NSW (1), QLD (1) |
| Y-3 | 5 | 54 (14–86) | 213 | 42.6 | Y: P1.5-1,10-1: F4-1: ST-1655 (cc23) (5) | NSW (3), VIC (1), QLD (1) |
| Y-4 | 3 | 68 (39–83) | 67 | 22.3 | Y: P1.5-1,2-2: F5-8: ST-6800 (cc23) (3) | WA (3) |
| Y-5 | 4 | 49 (24–84) | 558 | 139.5 | Y: P1.5-1,10-1: F4-1: ST-1655 (cc23) (4) | VIC (4) |
| Y-6 | 2 | 35 (3–67) | 107 | 53.5 | Y: P1.5-1,10-1: F4-1: ST-1655 (cc23) (2) | VIC (1), QLD (1) |
| Y-7 | 4 | 48 (14–86) | 253 | 63.3 | Y: P1.5-1,10-1: F4-1: ST-1655 (cc23) (4) | QLD (2), VIC (1), NSW (1) |
| Y-8 | 2 | 40 (20–59) | 211 | 105.5 | Y: P1.5-1,10-1: F4-1: ST-1655 (cc23) (2) | QLD (1), NSW (1) |
Abbreviations: ACT, Australian Capital Territory; NSW, New South Wales; NT, Northern Territory; QLD, Queensland; SA, South Australia; TAS, Tasmania; VIC, Victoria; WA, Western Australia.
Two MenW:CC11 clusters were noticeably larger (W-5, 17 isolates; W-9, 21 isolates) than other MenW:CC11 clusters (range, 2–8 isolates; Figure 2, Table 1). All W-5 and almost all W-9 isolates possessed the predominant MenW:CC11 finetype (P1.5,2:F1-1) but did not possess the predominant ST (ST-11). Instead, W-5 comprised ST-12351 (16/17) and ST-12897 (1/17) isolates. Comparatively, W-9 comprised ST-1287 (21/21) isolates. ST-12351 and ST-1287 are single-locus variants of ST-11, whereas ST-12897 is a double-locus variant. Also of note, cases belonging to W-5 and W-9 were generally younger than those belonging to other MenW:CC11 clusters (median ages: W-5, 4 years; W-9, 6 years; other MenW:CC11 clusters, 53 years). W-5 comprised cases from WA (n = 11), SA (n = 3), QLD (n = 2), and the Northern Territory (n = 1); W-9 comprised cases were from the Northern Territory (n = 14), QLD (n = 4), and WA (n = 3). By contrast, other MenW:CC11 clusters comprised cases mostly from VIC, NSW, QLD, and Tasmania.

Dot plot displaying genomic clusters identified among invasive meningococcal disease isolates submitted to the Microbiological Diagnostic Unit Public Health Laboratory, collected between 1 January 2017 and 23 May 2019. Cluster designation is displayed on the y-axis; clusters are grouped according to their predominant serogroup. The colored dots correspond to isolates, with the size of the dot relative to the number of isolates collected on a given day; the date of collection is displayed on the x-axis. Dots are colored according to jurisdiction; see legend for color scheme. ACT, Australian Capital Territory; NSW, New South Wales; NT, Northern Territory; QLD, Queensland; SA, South Australia; TAS, Tasmania; VIC, Victoria; WA, Western Australia.
Two genotypes were identified in MenC:CC11 isolates; most (12/15) were C:P1.5-1,10-8:F3-6:ST-11(CC11) (Supplementary Table 5). These isolates displayed limited phylogenetic diversity, and an 8-isolate cluster (C-1) comprising males aged 25 to 39 years from VIC and NSW was identified (Figures 1 and 2, Table 1).
ST-23 Complex
The second-most common CC was CC23 (80/440, 18%). CC23 was dominant among MenY (78/88, 89%). In turn, MenY isolates represented 98% of CC23 isolates (78/80), in addition to 2 NG isolates (2%; Supplementary Table 5).
Twelve genotypes were identified in CC23 isolates; most (61/80, 77%) were Y:P1.5-1,10-1:F4-1:ST-1655. Six of 8 CC23 clusters comprised Y:P1.5-1,10-1:F4-1:ST-1655 isolates (range, 2–5 isolates). Cases belonging to these clusters were confined to QLD, NSW, and VIC; nearly half were aged ≥65 years (Figure 2, Table 1).
ST-41/44 Complex
CC41/44 was the third-most common CC (64/440, 15%). CC41/44 was solely associated with MenB (64/64, 100%) and was the dominant CC among serogroup B (64/144, 44%; Supplementary Table 5).
Nineteen genotypes were identified in MenB:CC41/44 isolates. Of these, most genotypes (15/19, 79%) were associated with only 1 or 2 isolates. The most prevalent genotype among MenB:CC41/44 isolates was B:P1.7-2.4:F1-5:ST-154 (31/64, 48%), followed by B:P1.18-1,34:F1-5:ST-6058 (8/64, 13%).
Six clusters were identified among MenB:CC41/44 isolates; 4 of these were within B:P1.7-2,4:F1-5:ST-154. The largest cluster (B-4, 6 isolates) was confined to SA. Isolates from SA appeared in most clusters (4/6, 80%) and comprised approximately half of all cluster-associated MenB:CC41/44 cases (9/20, 45%; Figure 2, Table 1).
WGS Can Reveal the Likely Origin of Strains
The superior resolution of WGS enables assessment of diversity among isolates collected across multiple countries or years, potentially revealing clonal origin and evolution. Phylogenetic analysis of Australian MenW:CC11 sequences and a representative set of international CC11 sequences was undertaken (Figure 3).
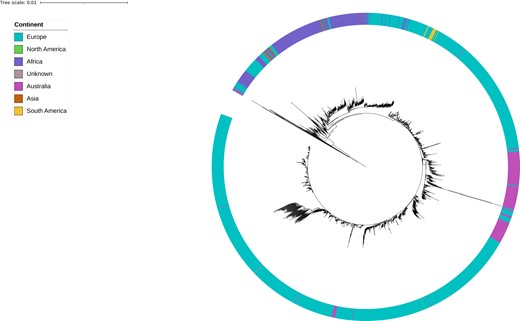
Maximum likelihood phylogenetic tree for Australian and international serogroup W clonal complex 11 isolates. Australian isolates submitted to the Microbiological Diagnostic Unit Public Health Laboratory were collected between 1 January 2017 and 23 May 2019 and represent instances of invasive disease. International isolates were identified through the PubMLST Neisseria database and represent instances of carriage and invasive disease. Isolates' continent of collection is displayed by the colored ring surrounding the tree; see legend for color scheme.
Clades consistent with the known MenW:CC11 sublineages based on sequence origin can be observed: Hajj sublineage—sequences from Africa, Asia, Europe; South American/UK sublineage—sequences from Europe and South America. Most Australian isolates fall into 1 clade within the SA/UK sublineage. This Australian clade also contains a few European sequences; however, the collection years are similar to those of the Australian sequences, making it challenging to determine whether these are importation or exportation events. This Australian clade likely represents 1 or more introductions of highly clonal strains that underwent subsequent local diversification. Throughout the tree, there are several other smaller groups of Australian sequences, indicative of separate introductions that never resulted in significant transmission in Australia.
DISCUSSION
This WGS-based study provides a detailed description of the N meningitidis population circulating in Australia during 2017 and 2018. In line with notification data reported during this period, study isolates were predominantly MenW (n = 181) and MenB (n = 144), followed by MenY (n = 88), and MenC (n = 16). Of 18 CCs, 5 accounted for the majority (389/440, 89%) of isolates (CC11, n = 199; CC23, n = 80; CC41/44, n = 64; CC32, n = 30). These CCs, bar CC11, were restricted to specific serogroups (CC23, MenY; CC41/44, MenB; CC32, MenB; CC213, MenB; CC11, MenB/C/W/Y).
In the early 21st century, hypervirulent MenW:CC11 strains emerged, and MenW rapidly transitioned to a common cause of IMD worldwide [12]. Phylogenetic analyses illustrate that Hajj-related strains drove the initial global increase but subsided by the mid 2000–2010 period, with the subsequent rise due to genetically unrelated strains (the South American/UK sublineage and its variant strains) [20]. More recently, there have been reports of emerging non-CC11 MenW lineages—for example, ST-9316 in France and ST-3342(CC865) in the Czech Republic—which may have potential to supplant CC11 strains and alter IMD epidemiology [36, 37].
Australia experienced rapidly rising MenW: notifications inclined steeply between 2014 and 2017, and a multijurisdictional outbreak occurred in 2017 [24, 27]. During 2017 and 2018, CC11 was the dominant MenW lineage (178/181, 98%); remaining isolates were CC22 (2/181, 1%) and undefined/novel ST (1/181, 1%). In some countries (eg, Canada), CC11 replaced CC22 as the dominant MenW lineage [38]. Almost all Australian MenW:CC11 isolates possessed the PorA P1.5,2 subtype (170/178, 96%), which is widespread and characteristic of all current MenW:CC11 global sublineages [20]. Based on WGS data, it appears that the increase in MenW in Australia was caused mainly by non-Hajj sublineages, in keeping with many countries where MenW emerged after the mid 2000–2010 period. The data also indicated multiple MenW introductions to Australia, most of which did not result in significant transmission, plus limited phylogenetic diversity within Australia. Additionally, we observed 2 large genomic clusters (W-5, W-9) with associated metadata similar to the epidemiology of reported multijurisdictional MenW outbreaks in remote central Australia in 2017 [27, 28]. Together, these data are consistent with recent emergence, effective establishment, and rapid transmission in a naive geographic area.
Among MenC isolates, CC11 was dominant (15/16, 94%); the 1 remaining MenC isolate was CC103. This predominance of CC11 among MenC is commonly observed internationally [20, 37, 39, 40]. We identified relatively few MenC isolates, reflective of the low incidence of MenC in Australia since routine MenC immunization began in 2003 [23]. MenC isolates displayed little genetic variation, and most MenC:CC11 isolates (8/15, 23%) formed a genomic cluster (C-1) comprising cases from men aged 25 to 37 years from VIC and NSW. All C-1 isolates were C:P1.5-1,10-8:F3-6:ST-11. Since 2001, IMD outbreaks among men who have sex with men have been reported worldwide, mostly in European and North American cities (eg, Los Angeles, New York City, Chicago, Toronto, Berlin, Paris) [41]. These were predominantly caused by MenC:CC11 meningococci of the same genotype as C-1 isolates [42]. The metadata associated with C-1 isolates is consistent with the epidemiologic profile (age, sex, geography) of a 2017 MenC outbreak reported among men who have sex with men in Melbourne, VIC [31]. C-1 may correspond to this outbreak, though matched epidemiologic data would be needed to confirm this.
MenY infections were uncommon in Australia before 2014 but increased steadily between 2014 and 2017, mainly in QLD, NSW, and VIC [24]. In this data set, MenY isolates were predominately CC23 (78/88, 89%), and almost all CC23 isolates were MenY (78/80, 98%). Clusters identified among MenY:CC23 isolates were mostly associated with older adults in QLD, NSW, and VIC. Together, this suggests a pattern of clonal expansion of CC23, likely concentrated in eastern Australia. This trend—emergence and expansion of MenY:CC23—has been observed in many countries since the early 21st century [37, 40, 43].
Our MenB population displayed high heterogeneity relative to MenC/W/Y, alone grouping into several CCs and displaying the most phylogenetic diversity. This aligns with many other developed countries that report a high degree of genetic diversity in their MenB populations [37, 40, 44]. The most prevalent CCs in our data set were CC41/44 (64/144, 44%), CC32 (30/144, 21%), and CC213 (16/144, 11%): the same CCs responsible for most endemic MenB globally between 2000 and 2015 [45]. CC41/44 and CC32 warrant monitoring due to their proven epidemic potential: C41/44 was responsible for prolonged outbreaks in the Netherlands and New Zealand, while CC32 has caused major outbreaks in Norway, Spain, Cuba, the United States, and France [44]. CC213 also warrants monitoring due to its increasing prevalence in some countries and low predicted 4CMenB vaccine coverage [46]. In Australia, MenB predominated from 2002 to 2015, although overall incidence decreased annually between 2001 and 2016, except in SA where most cases were caused by the “New Zealand epidemic strain” (PorA P1.7-2,4; CC41/44) [24, 30]. The predominance of SA isolates within B:P1.7-2,4:F1-5:ST-154(CC41/44) clusters, the largest of which was confined to SA (B-4, n = 6), suggests protracted transmission of this strain in SA during 2017 and 2018.
This study underlines the value of routine and nationalized genomic surveillance of IMD. Interpretation of epidemiologic IMD data alone is challenging due to low disease incidence and the predominant role of asymptomatic carriage in transmission, which often results in large or variable periods and/or geographic distances between observed cases in a transmission chain [47]. Additionally, the dominance of a small number of lineages that may be seeded through multiple introductions may give rise to separate transmission chains with identical genotypes. As demonstrated in this study, WGS provides the additional resolution required to disentangle these issues though cluster identification and description of the overall bacterial population, as well as identification of new, expanding, or retracting clones.
A growing number of countries use genomic surveillance of N meningitidis to inform and evaluate meningococcal vaccination programs. Traditionally, the evaluation of such programs has broadly involved predicting counterfactuals based on preimmunization incidence while considering variables such as vaccine efficacy and coverage [48]. Determining vaccine efficacy against MenB, however, has proven difficult due to its low incidence and high antigenic variability; that is, the MenB vaccines target surface antigens rather than the polysaccharide capsule and do not cover all MenB strains [49, 50]. DNA-based typing schemes, such as the genetic Meningococcal Antigen Typing Scheme and Bexsero Antigen Sequence Typing, have been developed to enable prediction of MenB vaccine coverage [50]. Insights generated through other methods of genomic surveillance, such as those outlined in this study, could further augment the evaluation of meningococcal vaccination programs. For example, if genomic surveillance identified highly related cases in the target serogroup following a change to vaccine strategy, this could indicate new or ongoing transmission regardless of any observed reduction in the number of infections. As a result, it may be possible to identify subpopulations or areas in need of targeted vaccination or other interventions.
To fully realize the benefits of genomic surveillance, reestablishing the collation of a highly representative data set, including current and historical samples, will be required. In this context, representativeness refers to the proportion of cases isolated and sequenced, noting that this requires a positive culture. Lower representativeness, decentralized analyses, and inconsistent coverage lead to the omission of intermediary isolates, which reduces the ability to identify transmission chains or their full scope, potentially delaying the recognition of, or response to, epidemic activity. For example, in this data set, 2018 cases had a lower proportion sequenced than 2017 cases, which may explain why proportionally fewer isolates clustered. However, this may also have been due to reduced epidemic activity and increased sporadic disease.
Our findings demonstrate several benefits offered by routine nationalized IMD genomic surveillance but also stress the necessity of comprehensive participation nationwide and greater integration of clinical and epidemiologic data. This study is strengthened by cross-jurisdictional representation during a year characterized by MenC and MenW outbreaks. Lower representation during 2018, captured via voluntary participation, highlights the need for sustainable funding and formalization of systems to ensure representative data sets and robust analyses going forward. Future integration of enhanced epidemiologic information, such as travel history, clinical outcome data, vaccination status, and contact information, would augment genomic insights and strengthen IMD surveillance.
Supplementary Data
Supplementary materials are available at Open Forum Infectious Diseases online. Consisting of data provided by the authors to benefit the reader, the posted materials are not copyedited and are the sole responsibility of the authors, so questions or comments should be addressed to the corresponding author.
Notes
Acknowledgments. We thank the microbiologists and bioinformaticians from the laboratories across Australia who sent invasive N meningitidis isolates and/or sequencing data to the Microbiological Diagnostic Unit Public Health Laboratory. We also thank all the staff at Microbiological Diagnostic Unit Public Health Laboratory who assisted in the characterization and sequencing of the samples used in this study.
Author contributions. E. S., K. H., P. A., B. P. H. designed the study; E. S., K. H. performed analysis; K. H., P. A., B. P. H., C. L., C. G., J. M., M. L., A. V. J., D. J. S., L. L. provided critical input and discussions; E. S., K. H., P. A., B. P. H. wrote first draft; and all authors contributed to the final manuscript.
Data availability. Sequencing data will be deposited into the NCBI Sequence Read Archive and made publicly available by the time of publication.
Ethics statement. Ethical approval was received from the University of Melbourne Human Research Ethics Committee (study 1954615).
Patient consent statement. A patient consent waiver was included in the local ethics committee approval.
Previous presentation of material. A previous version of this research was given as an oral presentation at the Communicable Disease Control Conference 2019, Canberra, Australia, under the title “Genomic Surveillance of Invasive Meningococcal Disease (IMD) in Australia, 2017–2018.”
Financial support. This work was supported by a National Health and Medical Research Council grant (APP1149991) and investigator grant to B. P. H. (APP1196103).
References
Author notes
A. V. J., B. P. H., and P. A. are joint final authors.
Potential conflicts of interest. All authors: No reported conflicts.


Comments