


Abstract
Viral SARS-CoV-2 rebound (viral RNA rebound) is challenging to characterize in large cohorts due to the logistics of collecting frequent and regular diagnostic test results. Pharmacy-based testing data provide an opportunity to study the phenomenon in a large population, also enabling subgroup analyses. The current real-world evidence approach complements approaches focused on smaller, prospective study designs.
We linked real-time reverse transcription quantitative polymerase chain reaction test data from national pharmacy-based testing to health care claims data via tokenization to calculate the cumulative incidence of viral RNA rebound within 28 days following positive test results in nirmatrelvir/ritonavir (NMV-r)–treated and untreated individuals during the Omicron era (December 2021–November 2022) and prior to the Omicron era (October 2020–November 2021).
Among 30 646 patients, the rate of viral RNA rebound was 3.5% (95% CI, 2.0%–5.7%) in NMV-r–treated infections as compared with 1.5% (95% CI, 1.3%–1.7%) in untreated infections during the Omicron era and 1.9% (95% CI, 1.7%–2.1%) prior to the Omicron era. Viral RNA rebound in patients who were vaccinated (n = 8151), high risk (n = 4411), or older (≥65 years, n = 4411) occurred at comparable rates to the overall cohort (range, 1.1%–4.8%). Viral rebounds to high RNA levels in NMV-r–treated infections occurred in 8% of viral rebounds as compared with 5% to 11% in untreated infections. Rates of hospitalization were comparable between patients with NMV-r–treated infections with viral RNA rebound (0%) and untreated patients with viral RNA rebound (0%–1.2%).
Our findings suggest viral RNA rebound is rare (< 5%), with rates that were consistent with those from the EPIC-HR trial (Evaluation of Protease Inhibition for COVID-19 in High-Risk Patients). Most occurrences of viral RNA rebound were associated with low viral RNA levels, and viral RNA rebound progression to severe disease was not observed.
Viral SARS-CoV-2 rebound (viral RNA rebound) has been described as a positive viral antigen or nucleic acid amplification test result that follows a negative test result. Although initial case reports associated viral RNA rebound with nirmatrelvir/ritonavir (NMV-r) treatment [1, 2], subsequent studies have shown that viral RNA rebound occurs in untreated patients [3] and patients treated with NMV-r or other SARS-CoV-2 antivirals [4–6].
NMV-r consists of nirmatrelvir, a SARS-CoV-2 main protease inhibitor, and ritonavir, a CYP3A inhibitor. Nirmatrelvir prevents SARS-CoV-2 replication by inhibiting the processing of polyprotein precursors, while ritonavir acts as a pharmacokinetic enhancer by inhibiting nirmatrelvir metabolism. The US Food and Drug Administration issued an emergency use authorization for NMV-r in December 2021 [1, 7] and granted full approval in May 2023 [8].
Existing investigations of SARS-CoV-2 rebound in the United States have been limited to small cohorts with varying case definitions of viral rebound [9–13] or data collected prior to the Omicron era [2, 3]. Here, we use real-time reverse transcription quantitative polymerase chain reaction (RT-qPCR [14]) test data linked to health care claims data for a large-scale observational study to quantify and compare the frequency of viral RNA rebounds in treated and untreated infections. With a cohort of 30 646 unique patients—including patients at high risk, patients who were vaccinated, as well as patients infected during the Omicron era—this presents a large and comprehensive study on viral RNA rebound.
METHODS
Study Population
The SARS-CoV-2 RT-qPCR test [15] data analyzed and presented here were obtained from Helix Genomics Inc, an accredited laboratory (CAP 9382893, CLIA 05D2117342) with a suite of capabilities to support infectious disease programs and public health surveillance. The test data in this study were obtained as part of Helix's retail pharmacy-based testing of self-collected specimens from anterior nares swabs (both nares swabbed) from individuals of all ages and across all geographic regions. Helix's SARS-CoV-2 RT-qPCR test [15] uses the Thermo Fisher TaqPath COVID-19 Flu A, Flu B Combo Kit, which targets 3 respiratory pathogens (SARS-CoV-2, influenza A, and influenza B) and has a confirmed limit of detection for SARS-CoV-2 of 500 genome copy equivalents (GCE)/mL, corresponding to a cycle quantification [14] (Cq) value of 35 [15].
Patient Consent and Compliance
The RT-qPCR diagnostic data were obtained through Helix's institutional review board protocol 0003-0001 (WCG IRB), which was granted a waiver of informed consent and HIPAA authorization (Health Insurance Portability and Accountability Act) to utilize diagnostic samples and data for research purposes (including combining such data with publicly available data sets via tokenization). All samples and data were deidentified before receipt by the study investigators and in compliance with relevant HIPAA provisions. Deidentification was completed via the expert determination method by Komodo Health.
Data
Test result data for >8 million patients who received RT-qPCR testing from October 2020 to November 2022 within Helix's retail pharmacy-based testing network were linked via Datavant's encryption and tokenization technology [16] (https://datavant.com) to a large health insurance claims database (Komodo Health; https://www.komodohealth.com/). The Helix RT-qPCR test data include a collection date, test result (SARS-CoV-2 positive or negative), and Cq value for each positive test result (prior to March 2021, Cq values were not available because the data infrastructure was not in place). The Komodo Health data set contains data obtained directly from payers (closed claims) and other health care sources, including clearinghouses, pharmacies, and software platforms, regardless of their insurance provider (open/closed claims) across all geographic regions of the United States. The data sources have been described in detail elsewhere [17]. This study used all available claims data for the analysis. There was a 91% overlap of RT-qPCR testers (68% closed, 24% open) in the Helix network with patients in the Komodo Health claims data set. We filtered for patients ≥12 years old who tested positive at least once, leading to a linked data set containing 1 123 111 RT-qPCR test results, representing 417 474 unique patients (Supplementary Figure 1).
Definitions
Viral RNA Rebound and Testing Frequency
We define viral SARS-CoV-2 rebound (viral RNA rebound) as a SARS-CoV-2 infection with the following pattern of test results within a period of 28 days: 1 or more positive test results, followed by 1 or more negative test results, followed by 1 or more positive test results. We refer to this as a positive-negative-positive test result pattern (Figure 1).
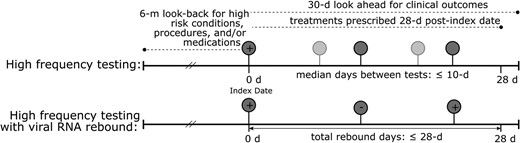
Schematic representation of study population. (Upper) High-frequency testing and (lower) high-frequency testing with viral RNA rebound, with relevant clinical information indicated by dashed lines. Each circle represents a SARS-CoV-2 real-time reverse transcription quantitative polymerase chain reaction test, with the darker shade indicating the minimum required tests to meet the definition and the lighter shade reflecting the possibility of >3 tests. The index date is the first positive test result within 28 days.
Each SARS-CoV-2 infection has an index date, defined as the sample collection date of the first confirmed positive RT-qPCR test result within a positive-negative-positive test result sequence that occurs within 28 days during the study period.
All analyses require high-frequency testing during SARS-CoV-2 infection, defined as an infection where at least 3 tests are performed within 28 days of the first positive test result and the median interval between these tests is at most 10 days. The 10-day threshold was selected to balance sample size with sufficiently granular testing (see Supplementary Figure 2 for the distribution of median testing intervals). Sensitivity analyses with median intervals ≤7 and ≤14 days are included in the Supplementary material and described in the text.
Treatment
A patient is considered treated if a prescription for NMV-r was filled between the index date and either 28 days after index date or a negative test result, whichever was earlier. The majority of prescriptions in this data set occur within 5 days of the index date (Supplementary Figure 3). A patient is considered untreated if there was no evidence that an anti-SARS-CoV-2 therapy was prescribed or filled.
Groups and Subgroups
The Omicron era is defined as starting 1 December 2021 through the end of the study period (30 November 2022). All NMV-r–treated infections occurred between January and October 2022, during which Omicron was the predominant circulating variant. The pre–Omicron era is defined as prior to 1 December 2021 and was included as a historical comparison and to control for associations due to the SARS-CoV-2 variant.
Patients at high risk for progression to severe SARS-CoV-2 were identified by criteria derived from the Centers for Disease Control and Prevention's high-risk conditions for severe SARS-CoV-2 infection [18, 19], diagnostic codes for high-risk conditions (eg, cancer, asthma, hypertension, immunosuppressive disease, pregnancy, diabetes, obesity), as well as procedures and medications associated with high-risk conditions. These high-risk criteria also included patients ≥65 years old at the index date. Patients in this high-risk analysis had to satisfy the additional inclusion criteria of having continuous 6-month medical and pharmacy enrollment prior to the index date, with a 30-day allowable gap in coverage. Since this requirement of continuous enrollment reduced the sample size, age by itself (measured as <65 vs ≥65 years) was separately used as a proxy for high-risk status.
Patients were considered vaccinated for SARS-CoV-2 if at least 1 record existed indicating that a type of SARS-CoV-2 vaccination was administered any time prior to the index date. Given the limitations in health care claims data, not all vaccination records are captured, and absence of a vaccine administration code does not necessarily indicate that an individual is unvaccinated.
Covariates
Examined covariates included baseline demographics, high-risk status for progression to severe SARS-CoV-2, NMV-r treatment status, other anti-SARS-CoV-2 treatments, SARS-CoV-2 vaccination (≥1), Cq value for viral load at positive test result date for viral RNA rebound, and clinical outcomes (inpatient visits within 30 days of index date). Among patients treated with NMV-r, time in days from the first positive test result to NMV-r treatment was also assessed.
Statistical Methods
Unadjusted Analysis
Raw values for the viral RNA rebound rate in patients who received NMV-r as compared with untreated patients were evaluated via a Fisher exact or chi-square test, whichever was appropriate, and 95% CIs were calculated per the Jeffreys interval [20]. This approach was selected due to the smaller sample sizes and the low proportions in the treatment group, which would lead to negative-valued lower bounds with the traditional normal approximation to the binomial.
Unadjusted descriptive analyses were performed among high-frequency testing infections, stratified by Omicron era and SARS-CoV-2 treatment status, to estimate the overall viral RNA rebound rate. Analyses were also conducted among patients with ≥1 confirmed vaccination as well as patients at high risk for progression to severe SARS-CoV-2 with 6 months of continuous health care claims enrollment.
Propensity Score Matching
Propensity score matching was performed for patients treated with NMV-r and those untreated during the Omicron era. We used nearest-neighbor caliper matching, whereby treated individuals were matched with up to 20 untreated individuals within a caliper of 0.25 SD of logit of the propensity score [21, 22]. Propensity scores were estimated via logistic regression, and matching was performed in 2 analyses. The first analysis, which has a larger sample size, included covariates available for the majority of the cohort: age, sex, month of index date, and geographic region. The second analysis, performed on a smaller high-risk cohort, included high-risk categories and the following covariates: age, sex, geographic region, immunocompromised status, obesity, and cancer. The additional covariates for the second analysis were selected from the 5 most common high-risk conditions (immunocompromised status, hypertension, obesity, cancer, or diabetes) and were based on a standardized mean difference >0.1. Both matching analyses were restricted to the Omicron era and based on the 10-day median interval definition for high-frequency testing.
Sensitivity Analyses
To validate the robustness of the viral RNA rebound rate calculation, we investigated alternative definitions of high-frequency testing based on 7- and 14-day median intervals. The unadjusted raw viral RNA rebound rate was calculated for these alternative high-frequency RT-qPCR testing cohorts and stratified by Omicron era and SARS-CoV-2 treatment status (Supplementary Table 2).
RESULTS
Patient Characteristics
Of the 417 474 unique patients with test and claims data, we identified a cohort of 30 646 individuals with 30 766 infection periods (120 patients had 2 infections) who satisfied high-frequency testing criteria (Supplementary Figure 1). This subset of high-frequency testers was more likely to be vaccinated than the broader population but otherwise had similar demographic characteristics (Supplementary Table 1). The temporal distribution of the high-frequency infections, including viral RNA rebound infections and NMV-r–treated infections, were consistent with the epidemic dynamics of SAR-CoV-2 over the study period (Supplementary Figure 4).
The distribution of patient characteristics of interest for this cohort is detailed in Table 1. The cohort is largely similar among the 3 comparison groups, with the NMV-r–treated group skewing more female (57%), older (median age, 58 years; Supplementary Figure 5A), more likely to be vaccinated, and more likely to be high risk based on underlying medical conditions [18].
Characteristics of Individuals in the Cohort
| Untreated | NMV-r Treated a | ||
|---|---|---|---|
| Pre–Omicron Era (n = 18 005) | Omicron Era (n = 12 281) | Omicron Era (n = 372) | |
| Male | 8882 (49) | 5584 (45) | 161 (43) |
| Age, y, mean (SD) | 40.1 (15.9) | 44.7 (16.9) | 57.6 (14.9) |
| <65 | 16 749 (93) | 10 588 (86) | 246 (66) |
| ≥65 | 1256 (7) | 1693 (14) | 126 (34) |
| Vaccinated: ≥1 SARS-CoV-2 vaccine | 1277 (7.1) | 6593 (54) | 272 (73) |
| Continuous 6-mo medical/pharmacy enrollment b | 5068 (26) | 3479 (28) | 131 (35) |
| High risk within those with 6-mo enrollment b,c | 2415 (48) | 1893 (54) | 96 (73) |
| Hospitalized within 30 d of index date | 154 (0.9) | 92 (0.8) | 1 (0.3) |
| Geographic region | |||
| Northeast | 1754 (10) | 1047 (9) | 46 (12) |
| Midwest | 1939 (11) | 1077 (9) | 13 (4) |
| South | 12 091 (67) | 7735 (63) | 235 (63) |
| West | 1387 (8) | 1897 (15) | 50 (13) |
| Not available | 834 (5) | 525 (4) | 28 (8) |
Data are presented as No. (%) unless noted otherwise.
Abbreviation: NMV-r, nirmatrelvir/ritonavir.
aExcludes patients treated with other SARS-CoV-2 therapies.
bAllowed for a 30-day gap in coverage.
cHigh-risk status for progression to severe SARS-CoV-2 infection.
Viral RNA Rebound Rates
Overall Cohort
The raw viral RNA rebound rate in patients treated with NMV-r was 3.5% (95% CI, 2.0%–5.7%) as compared with 1.9% (95% CI, 1.7%–2.1%) in untreated patients infected during the pre–Omicron era (P = .03) and 1.5% (95% CI, 1.3%–1.7%) in untreated patients in the Omicron era (P = .004; Table 2). The viral rebound rate for untreated infections was also significantly higher in the pre–Omicron era as compared with the Omicron era (P = .001). In all 13 NMV-r–treated viral RNA rebounds, the prescription date was within 3 days of the index date (Supplementary Figure 3).
Viral RNA Rebound Rates and Characteristics of the Patient Cohort, Stratified by Risk Group, Omicron Era, and NMV-r Treatment
| High-Frequency Testing Cohort | High-Frequency Testing Cohort With High-Risk Status and 6-mo Continuous Health Care Claims Enrollment a | |||||
|---|---|---|---|---|---|---|
| Pre–Omicron Era, Untreated | Omicron Era, Untreated | Omicron Era, NMV-r Treated | Pre–Omicron Era, Untreated | Omicron Era, Untreated | Omicron Era, NMV-r Treated | |
| Viral RNA rebound rate (rebound/infection) | ||||||
| Overall | 334/18 018 (1.9; 1.7–2.1) | 179/12 310 (1.5; 1.3–1.7) | 13/372 (3.5; 2.0–5.7) | 46/2417 (1.9; 1.6–2.6) | 21/1898 (1.1; .7–1.6) | 4/96 (4.2; 1.2–8.3) |
| Vaccinated | 33/1278 (2.6; 1.8–3.6) | 91/6601 (1.4; 1.1–1.7) | 10/272 (3.7; 1.9–6.4) | 5/247 (2.0; .8–4.4) | 17/1250 (1.4; .8–2.1) | 2/67 (3.0; .6–9.2) |
| ≥65-y-olds | 23/1256 (1.8; 1.2–2.7) | 25/1694 (1.5; 1.0–2.1) | 6/126 (4.8; 2.0–9.6) | …b | …b | …b |
| Clinical outcome: patients hospitalized <30 d of index date | ||||||
| Infection | 154/18 018 (0.9; .7–1.0) | 92/12 310 (0.7; .6–.9) | 1/372 (0.3; .0–1.2) | 49/2417 (2.0; 1.5–2.6) | 36/1898 (1.9; 1.4–2.6) | 0/96 (0; 0–2.6) |
| Viral RNA rebound | 4/334 (1.2; .4–2.8) | 0/179 (0; 0–1.4) | 0/13 (0; 0–17) | 1/46 (2.2; .2–9.7) | 0/21 (0; 0–11) | 0/4 (0; 0–44) |
Untreated groups exclude patients who received NMV-r within 28 days after the index date. High-frequency testing was based on RT-qPCR as decribed in the Methods. Data are presented as No. (%; 95% CI).
Abbreviations: NMV-r, nirmatrelvir/ritonavir.
aHigh-risk status for progression to severe SARS-CoV-2, with a 30-day allowable gap in coverage.
bNot calculated, as ≥65-year-old status was used as a proxy for high risk.
This overall relationship in viral RNA rebound rates holds in a sensitivity analysis based on alternative definitions of high-frequency testing (Supplementary Table 2). Whether high-frequency testing is defined as having a median interval between tests of 7, 10, or 14 days, the viral RNA rebound rates are comparable: 2.7% to 3.5% in NMV-r–treated infections, 1.4% to 1.6% in untreated patients infected during the Omicron era, and 1.7% to 2.5% in untreated patients infected in the pre–Omicron era.
In the propensity score–matched analysis, 344 treated patients were matched with 6784 untreated patients (number of matches per treated patient: median, 20; IQR, 20–20). After matching, the standardized mean difference was <0.10 for all covariates examined (Supplementary Figures 6 and 7). According to matching on demographic covariates only, the viral RNA rebound rate was 3.8% (95% CI, 2.1%–6.2%) for patients treated with NMV-r and 1.2% (95% CI, .9%–1.5%) for the control infections in the Omicron era. When matching on high-risk status, we obtained estimates of viral RNA rebound rates of 4.4% (95% CI, 1.5%–10.0%) in patients treated with NMV-r and 1.4% (95% CI, .9%–2.0%) for matched control infections. For the high-risk analysis, 96 treated patients were matched with 1822 untreated patients (number of matches per treated patient: median, 20; IQR, 20–20).
Stratification by Vaccination and High-Risk Status
Viral RNA rebound rates in vaccinated individuals were similar to the overall cohort: the rate in NMV-r–treated infections in vaccinated patients was 3.7% (95% CI, 1.9%–6.4%), 1.3% (95% CI, 1.1%–1.7%) in untreated infections during the Omicron era, and 2.6% (95% CI, 1.8%–3.6%) in untreated infections during the pre–Omicron era (Table 2). The difference in viral RNA rebound rate between NMV-r–treated infections and untreated infections in the Omicron era was statistically significant (P = .006), while that between NMV-r–treated infections and untreated infections in the pre–Omicron era is not (P = .3).
For patients who satisfied the high-risk criteria, the results were similar to those in the overall cohort. The viral RNA rebound rate in NMV-r–treated infections in high-risk cases was 4.2% (95% CI, 1.2%–8.3% CI), 1.9% (95% CI, 1.6%–2.6%) in untreated infections in the pre–Omicron era, and 1.1% (95% CI, .7%–1.6%) in untreated infections in the Omicron era. As observed in the vaccinated cohort, the difference in viral RNA rebound rate between NMV-r–treated infections and untreated infections in the Omicron era was statistically significant (P = .029), while that between NMV-r–treated infections and untreated infections in the pre–Omicron era was not (P = .12). We also used age ≥65 years as a proxy for high-risk status with similar results (Table 2).
Viral RNA Rebound Levels
Viral RNA rebounds in NMV-r–treated infections did not have higher RNA levels than viral RNA rebounds in untreated infections (Figure 2). Median Cq values by group were 33 (IQR, 30–34) for NMV-r treatment, 35 (IQR, 33–36) for the pre–Omicron era, and 35 (IQR, 32–37) for the Omicron era, which were within the limit of detection (Cq, 35) of the RT-qPCR test and substantially higher than the median Cq value of 26 for a positive test result in this study (Supplementary Figure 8). The time to viral RNA rebound, defined as the number of days between the index date and the first positive test result after the negative test result, was also comparable among the 3 groups (Supplementary Figure 5B).
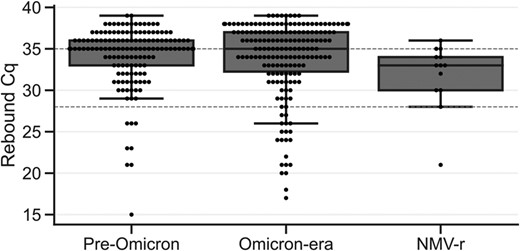
Viral RNA rebound Cq value. The Cq value of the first positive test result after a viral RNA rebound negative result by treatment group. The dashed line at the Cq value of 35 indicates the limit of detection of the real-time reverse transcription quantitative polymerase chain reaction test; the dashed line at the Cq value of 28 indicates the threshold for a high viral RNA level (Cq ≤28 corresponds to ≥64 000 genome copy equivalents/mL). In both plots, treated infections are excluded in the groups of the pre–Omicron era and Omicron era (see Treatment subsection in the Definitions section). Data are presented as median (line), IQR (box), and farthest datapoint within 1.5 times the IQR (whiskers). Cq, cycle quantification; NMV-r, nirmatrelvir/ritonavir.
To quantify the rate of high viral RNA rebounds, we set a threshold Cq value ≤28 as a proxy for transmissibility [3]. With this RT-qPCR assay, Cq ≤28 corresponds to ≥64 000 GCE/mL, which is within the range of transmissibility (105 GCE/mL) [3]. With this threshold, rebounds to high viral RNA levels represented only 8% (n = 13) of rebounds in NMV-r–treated infections, 5% (n = 134) in untreated infections in the pre–Omicron era, and 11% (n = 175) in untreated infections in the Omicron era (Figure 3). This indicates that rebounds associated with viral RNA levels approximating those associated with transmissibility occur at a rate of approximately 0.3% in NMV-r–treated infections (NMV-r–treated viral RNA rebound rate of 3.5% × high viral RNA level rebound rate of 8%).
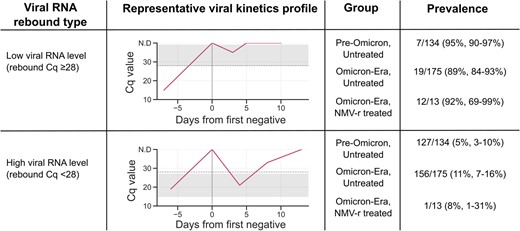
Viral RNA rebounds stratified by viral RNA levels (rebound Cq) and treatment groups. Gray bands indicate the range of rebound Cq values within each category. Viral RNA Cq ≤28 corresponds to ≥64 000 genome copy equivalents/mL. Cq, cycle quantification; NMV-r, nirmatrelvir/ritonavir.
Clinical Outcomes
Rates of hospitalization within 30 days were comparable between the high-frequency testing cohort and all NMV-r–treated infections (both <1%); however, the hospitalization rate was higher in infections occurring in the untreated high-risk groups (1.9%–2.0%) as compared with the NMV-r–treated infections (0%; Table 2). Rates of hospitalization were similar for infections in the pre–Omicron era with and without viral RNA rebound. No hospitalizations were observed in infections during the Omicron era in the untreated and NMV-r–treated groups.
DISCUSSION
Prior studies have estimated viral RNA rebound rates ranging from 1% to 31%, depending on the definition [2–4, 11–13, 23, 24]. The rate of viral RNA rebound estimated here falls on the lower end of this range and is on the same order of magnitude of the rates calculated from the EPIC-HR clinical trial (Evaluation of Protease Inhibition for COVID-19 in High-Risk Patients): 6.3% in NMV-r treatment and 4.2% in placebo [2]. A follow-up study of the clinical trial data further indicated that viral RNA rebound after treatment could not definitively be attributed to loss of NMV-r activity [5]. Whether we compare unadjusted viral RNA rebound rates in the overall sample, in the propensity score–matched sample, within subgroups (stratified by age, vaccination status, or high-risk category), or by alternative definitions of high-frequency testing, the estimates remain in the range of 1.1% to 4.8%.
Within the viral RNA rebounds detected in this study, the majority (89%–95%) were rebounds with low viral load (Cq >28), suggesting that many instances of viral RNA rebound are the result of tests taken at viral loads near the limit of detection of the RT-qPCR test. Viral RNA rebounds to high viral RNA levels occurred in <0.5% of infections in this study. In addition, viral RNA rebound was not associated with adverse clinical outcomes as assessed by hospitalization within 30 days of the index date. This is consistent with previous studies that did not find an association between SARS-CoV-2 rebound and increased risk of severe outcomes [3, 9, 25–27].
One limitation of this study is that it is restricted to viral RNA rebound, independent of symptomatology. To assess for symptomatic viral RNA rebound, information is needed about the time course and severity of SARS-CoV-2 symptoms. This is not possible to extract from claims data, and symptoms have not been correlated with RT-qPCR test results. We note that even in studies that collected symptom data, these were used in conjunction with test results [3, 11], as symptom rebound alone is not a reliable predictor of viral RNA rebound [12].
Another limitation is the limited frequency of testing during an infection, which decreases the sensitivity to detect viral RNA rebound. Our inclusion criteria required a minimum of 3 tests within 28 days of an infection, consistent with the number of time points used to define viral RNA rebound in the EPIC-HR data. In recent studies where patients were sampled daily, estimates of virologic rebound rates were higher than those estimated here (20%–27%) [12, 13], although the rebound rate in one of these studies dropped to 2.4% when analysis was restricted to viral load measurements at 3 time points [12]. Because of the daily sampling approach used in these studies, higher rebound viral loads were observed in treated vs untreated infections that were not observed here. The limited sampling frequency also constrained our analysis of viral rebound Cq values to the first positive test result after the negative test result, in contrast to studies that compared sequential Cq values within the same infection [3, 5, 11, 12].
Given the observational design of our study, differences between NMV-r–treated and untreated patients were expected, based on treatment guidelines for NMV-r restricted to those with high risk for severe SARS-CoV-2 and the impact of virologic response on antiviral therapy [18]. While restriction to patients at high risk and propensity score–matching attempts were made to reduce confounding and although the high-frequency cohort was demographically similar to the broader pharmacy-based testing population (Supplementary Table 1), it is likely that some degree of residual confounding remained between the NMV-r–treated and untreated groups. Our estimates of viral RNA rebound are therefore best interpreted as viral rebound rates experienced by individuals who elect to undergo serial testing via pharmacy-based tests.
This retrospective cohort of 30 646 diverse patients provides a comprehensive quantification of viral RNA rebound rates from both pre-Omicron and Omicron eras. In our study population that included both vaccinated and unvaccinated individuals with varying levels of COVID-19 risk, we found that viral RNA rebound was rare (< 5%), with rates that were consistent with those from the EPIC-HR trial. Most occurrences of viral RNA rebound were associated with low viral RNA levels, and viral RNA rebound was not associated with progression to severe disease.
Supplementary Data
Supplementary materials are available at Open Forum Infectious Diseases online. Consisting of data provided by the authors to benefit the reader, the posted materials are not copyedited and are the sole responsibility of the authors, so questions or comments should be addressed to the corresponding author.
Notes
Acknowledgments. We acknowledge the Komodo Health team, especially Ivy Weng and Stacy Levy for their support in using the Sentinel platform for accessing and analyzing the joined data set used for this study. We thank Tom Dougherty (Pfizer) and Daniel Lee (formerly Helix) for helpful discussions. We thank the health care workers, frontline workers, and patients who made the collection of Helix's SARS-CoV-2 data set possible.
Author contributions. S. L., S. P. K., S. M., and J. H. conceived the analysis. S. W. prepared test result data. G. L. and S. S. performed tokenization. M. I. performed preliminary analysis. L. M. M. linked, aggregated, and analyzed the test result data and healthcare claims data. S. L. performed statistical analyses. J. T. M. checked statistical analyses. S. L., S. P. K., and L. M. M. prepared the manuscript with feedback from M. I., M. E. L., J. T. M., M. L. B., C. B., H. R., V. H., H. S., J. H.
Data availability. Data are not publicly available.
Disclaimer. The design and conduct of the study were led and developed by Helix but approved by Pfizer. Helix led the collection, management, analysis, and interpretation of the data. Helix and Pfizer participated in the preparation, review, or approval of the manuscript. Helix and Pfizer participated in the decision to submit the manuscript for publication.
Financial support. This work was supported by Pfizer.
References
US Food and Drug Administration. Pfizer: meeting of the Antimicrobial Drugs Advisory Committee—Pfizer briefing document. 16 March 2023. Available at: https://www.fda.gov/media/166199/download. Accessed 16 April 2023.
Author notes
Potential conflicts of interest. S. P. K., M. L. B., C. B., H. R., V. H., H. S., and J. H. are employees of and may hold stock/options in Pfizer. S. L., L. M. M., M. I., M. E. L., S. W., and S. S. are employees of Helix. J. T. M., S. M., and G. L. are former employees of Helix. S. L. and M. E. L. report contracted research from the Centers for Disease Control and Prevention. All other authors report no potential conflicts.


Comments