


Abstract
Sexually transmitted infections (STIs) are increasing in the United States, and certain populations are more at risk than others. One explanation for this is inequities in underlying social determinants of health (SDOH).
We analyzed chlamydia, gonorrhea, and syphilis cases in Durham County, North Carolina, from 01/01/2020 to 12/31/2020 by select SDOH at the census tract level. We included 48 variables of interest, including variables related to income, education, transportation, and health insurance. For each variable, we modeled STI incidence at the census tract level using Poisson regression. Wald's chi-square was used to determine which variables were significantly associated with STI incidence.
Of 24 variables that were statistically associated with STI incidence at the census tract level, 9 were negatively associated and 15 positively associated with STI incidence. Having employer health insurance was most strongly associated with lower-than-expected STI incidence, and having Medicaid insurance, no health insurance, using public transportation, and income below the poverty level were most strongly associated with higher-than-expected STI incidence. Lastly, STI incidence was not associated with race or ethnicity overall across Durham County, except in historically marginalized areas, where we found higher-than-expected STI incidence.
We found that lacking health insurance, having Medicaid insurance, using public transportation, and income below the poverty level were most strongly associated with higher-than-expected STI incidence. Strategies to combat increasing STIs may include improving access to health insurance, reducing barriers to cost-effective and timely transportation to medical appointments, and raising wages to bring individuals out of poverty.
Cases of chlamydia, gonorrhea, and syphilis continue to increase in the United States, with >2.5 million infections reported to the Centers for Disease Control and Prevention in 2021 [1]. As in prior years, there were significant disparities in rates of these 3 sexually transmitted infections (STIs), with 31% of cases reported among non-Hispanic Black or African American persons, despite this population only making up ∼12% of the US population [2]. In 2021, in Durham County, North Carolina, 54% of chlamydia cases, 70% of gonorrhea cases, and 49% of syphilis cases occurred in Black or African American individuals (unpublished, J.D.J.), despite Black or African Americans making up only 35.9% of the population in Durham County [3].
Why do these sexual health disparities exist? Data show that Black, indigenous, and people of color (BIPOC) throughout the United States experience higher rates of morbidity and mortality from a diverse spectrum of chronic health conditions, compared with White Americans, due to a number of structural and systemic factors [4]. Differences in the prevalence of STIs in certain groups are unlikely to be explained by differences in sexual behavior [5] and more likely to reflect unequal access to sexual health care and differences in sexual network characteristics [2, 6, 7]. More broadly, social determinants of health (SDOH), which include factors such as work conditions, income, housing, access to affordable health services, early childhood development, education, job security, social inclusion, and structural conflict [8], also contribute to disparate sexual health outcomes, primarily due to structural racism. Individuals living in poverty are more likely to be diagnosed with HIV infection [9, 10], and lack of stable housing [11], unemployment [12], and lack of health insurance [13], differences in educational attainment [13], residential racial segregation [14], and poverty [13] are all barriers to achieving good HIV infection outcomes. In addition, while high-risk behaviors such as exchanging sex for money, substance use, and having multiple sex partners increase the risk for HIV and STI acquisition in non-Hispanic Whites, the same is not true for Black or African American individuals as they have a high STI risk even without engaging in high-risk behaviors [15].
Data on SDOH and risk of STIs other than HIV infection are less robust. Here we analyze incident chlamydia, gonorrhea, and syphilis infection in Durham County by select SDOH and determine which factors are positively associated with diagnosis of chlamydia, gonorrhea, and syphilis infection at the census tract level.
METHODS
Data on cases of chlamydia, gonorrhea, and syphilis infection in Durham County from 01/01/2020 to 12/31/2020 were obtained from the North Carolina Electronic Disease Surveillance System (NCEDSS). Basic demographic data including age, gender (male or female), race (American Indian and Alaska Native, Asian, Black or African American, Native Hawaiian or Pacific Islander, White, other, unknown), ethnicity (Hispanic, non-Hispanic, unknown), and address were obtained. Address was obtained so cases could be geolocated into census tracts.
Data on SDOH variables were obtained from the American Community Survey (ACS) through the US Census Bureau, which is an ongoing survey that provides vital information annually about the US population. Data from 44 variables from the 2020 survey were used, in addition to 4 variables from the 2021 ACS. In total, 48 SDOH variables were analyzed (Table 1).
List of Social Determinants of Health Variables, American Community Survey, United States Census Bureau, 2020
| Variable | Category (No.) |
|---|---|
| Age 25+: Bachelor's degree | Education (3) |
| Age 25+: Graduate/professional degree | |
| Enrolled grade 9–12 | |
| Unemployed population 16+ | Employment (2) |
| Unemployed | |
| Income below poverty level | Income (3) |
| Public assistance income | |
| Food stamps/SNAP | |
| Workers in-state/out-of-county of residence | Transportation (3) |
| Workers 16+: Public transportation | |
| Workers 16+: Worked at home | |
| Age <19: 1 type of health insurance | Insurance (37) |
| Age <19: Employer health insurance | |
| Age <19: Direct-purchase health insurance | |
| Age <19: Medicare only | |
| Age <19: TRICAREa only | |
| Age <19: 2+ types of health insurance | |
| Age <19: No health insurance | |
| Age 19–34: 1 type of health insurance | |
| Age 19–34: Employer health insurance | |
| Age 19–34: Direct-purchase health insuranceb | |
| Age 19–34: Medicare only | |
| Age 19–34: Medicaid only | |
| Age 19–34: TRICAREa only | |
| Age 19–34: VA health care only | |
| Age 19–34: 2+ types of health insurance | |
| Age 19–34: No health insurance | |
| Age 35–64: 1 type of health insurance | |
| Age 35–64: Employer health insurance | |
| Age 35–64: Direct-purchase health insuranceb | |
| Age 35–64: Medicare only | |
| Age 35–64: Medicaid only | |
| Age 35–64: TRICAREa only | |
| Age 35–64: VA health care only | |
| Age 35–64: 2+ types of health insurance | |
| Age 65+: 1 type of health insurance | |
| Age 65+: Employer health insurance | |
| Age 65+: Direct-purchase health insuranceb | |
| Age 65+: Medicare only | |
| Age 65+: TRICAREa/military only | |
| Age 65+: 2+ types of health insurance | |
| Age 65+: No health insurance | |
| Age 65+: Employer & direct-purchase health insuranceb | |
| Age 65+: Employer & Medicare | |
| Age 65+: Direct-purchaseb & Medicare health insurance | |
| Age 65+: Medicare & Medicaid | |
| Age 65+: Other private health insurance combination | |
| Age 65+: Other public health insurance combination |
Abbreviations: SNAP, Supplemental Nutrition Assistance Program; VA, Veteran's Affairs.
Health care program for uniformed service members, retirees, and their families around the world.
Coverage through a plan purchased by an individual from a private company or through an exchange.
The data points within each variable represented the percentage of the population that had or identified with a particular variable. The key output variable was a composite STI variable (hereafter referred to as “composite STI incidence”) including reported chlamydia, gonorrhea, and syphilis cases for each census tract. Census tracts were chosen as the geographic region as they are small and relatively permanent statistical subdivisions of a county and typically include populations between 1000 and 8000 people [16]. Although Durham County has 68 census tracts, we analyzed data from 67 census tracts as 1 census tract had a population of 0 in 2020.
For each variable, we modeled composite STI incidence at the census tract level using Poisson regression. Wald's chi-square was used to determine which variables were significantly associated with STI incidence (P < .05) at the census tract level. In addition, we verified that we had statistically significant composite STI incidence and plotted composite STI incidence using an Optimized Hot Spot analysis. Next, we wanted to maintain model usage of Poisson as it is best suited for count variables and used the geographically weighted regression (GWR) package in ArcGIS Pro 3.3 using the Poisson model type. Although we were unable to garner statistically significant results using race and ethnicity variables in our analysis using a flat table approach with a Poisson regression model, we assumed that the relationship may be geographically significant as the complexities and relationship shared between composite STI incidence and race and ethnicity could not be explained by flat tables. A flat table is a variable table without any dimension beyond rows or columns. To further evaluate this relationship, we calculated our deviance residual.
This project was internally reviewed and exempted as nonresearch by the Durham County Department of Public Health Review Board. Therefore, institutional review board approval was not required.
RESULTS
In 2020, 2468 cases of chlamydia, 1276 cases of gonorrhea, and 274 cases of syphilis were diagnosed in residents of Durham County and were reported to the North Carolina Division of Public Health.
Of the 48 SDOH variables assessed, 24 variables were statistically associated with composite STI incidence at the census tract level. Of these, 9 variables were negatively associated with composite STI incidence (Table 2). Of these, 8 of 9 variables were associated with health insurance status, with having employer health insurance most strongly associated with lower-than-expected composite STI incidence. Working from home and other types of health insurance such as direct-purchase and Medicare insurance were also associated with lower-than-expected composite STI incidence at the census tract level.
Variables Negatively Associated With STI Incidence, Durham County, North Carolina, in 2020
| Variable | Expected STI Cases per 100 000 Population | Actual STI Cases per 100 000 Population | Range (Expected – Actual) | P Value |
|---|---|---|---|---|
| Age <19, has employer health insurance | 169 | 63 | −106 | <.0001 |
| Age 35–64, has employer health insurance | 155 | 77 | −78 | <.0001 |
| Age ≥16, works at home | 157 | 80 | −77 | <.0001 |
| Age <19, has direct-purchase health insurance | 166 | 97 | −69 | <.0001 |
| Age 19–34, has employer health insurance | 151 | 83 | −68 | <.0001 |
| Age 35–64, has 1 type of health insurance | 145 | 77 | −68 | <.0001 |
| Age ≥65, has both employer and Medicare insurance | 143 | 96 | −47 | .0016 |
| Age 19–34, has direct-purchase health insurance | 140 | 97 | −43 | .0033 |
| Age 19–34, has 1 type of health insurance | 137 | 105 | −32 | <.0001 |
Abbreviation: STI, sexually transmitted infection.
Of the 15 variables that were positively associated with STI incidence at the census tract level, having Medicaid insurance and having no health insurance were most strongly associated with higher-than-expected composite STI incidence (Table 3). Income below the poverty line and using public transportation also had a strong association with higher-than-expected composite STI incidence.
Variables Positively Associated With STI Incidence, Durham County, North Carolina, in 2020
| Variable | Expected STI Cases per 100 000 Population | Actual STI Cases per 100 000 Population | Range (Expected – Actual) | P Value |
|---|---|---|---|---|
| Age 35–64, has Medicaid only insurance | 84 | 154 | 70 | <.0001 |
| Age 19–34, has no health insurance | 80 | 139 | 59 | <.0001 |
| Age 35–64, has 2+ types of health insurance | 89 | 141 | 52 | .0013 |
| Age 19–34, only has Medicaid insurance | 80 | 130 | 50 | <.0001 |
| Income below the poverty level | 90 | 137 | 47 | <.0001 |
| Age ≥16, uses public transportation | 92 | 128 | 36 | <.0001 |
| Age ≥25, graduate/professional degree | 11.6 | 38.3 | 26.7 | <.0001 |
| Age ≥65, has Medicare and Medicaid insurance | 98 | 123 | 25 | <.001 |
| Age <19, has no health insurance | 100 | 122 | 22 | <.005 |
| Age 35–64, has VA health care insurance | 108 | 123 | 15 | .0352 |
| Uses public assistance income | 105 | 120 | 15 | .0474 |
| Age ≥25, has a Bachelor's degree | 20.3 | 32.73 | 12.43 | <.0001 |
| Uses food stamps or SNAP | 2.97 | 15.23 | 12.26 | <.001 |
| Unemployed | 2 | 4.16 | 2.16 | .0002 |
| Age ≥16, unemployed | 2 | 4.15 | 2.15 | .0002 |
Abbreviations: SNAP, Supplemental Nutrition Assistance Program; STI, sexually transmitted infections; VA, Veteran's Affairs.
We found that composite STI incidence was statistically significant in the eastern section of Durham and around Duke University and North Carolina Central University, which are historically marginalized areas of Durham. Overall, the model performed reasonably well, with an R2 of 0.77. We found statistically significant results by calculating our deviance residual and saw a strong relationship between composite STI incidence and the Black or African American population, with an R2 of 0.57 and strong relationships within our statistically significant STI incidence, and a higher propensity for Black or African American persons who live in these locations, with a local percent deviance ranging from 0.50 to 0.59, indicating that race explains between 50% and 59% of this relationship. Figure 1 shows this spatial relationship, with darker green reflecting areas with higher percent deviation and higher levels of African American or Black population.
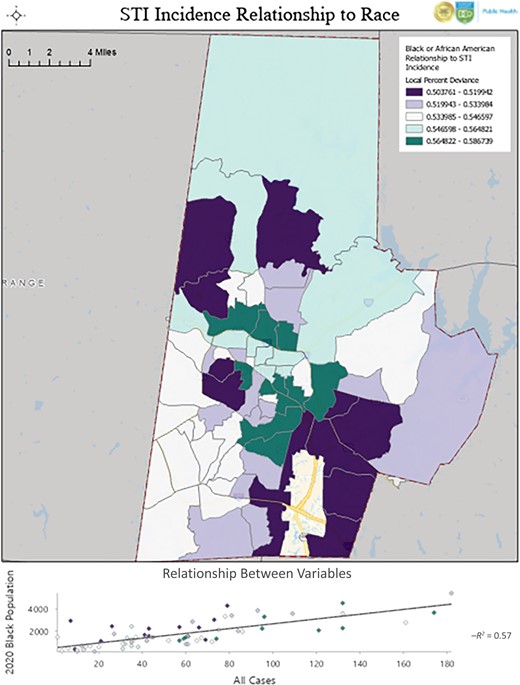
Black or African American race and STI incidence, Durham County, NC, USA, 2020. Abbreviation: STI, sexually transmitted infection.
DISCUSSION
It is estimated that social and economic factors, such as education, employment, and income, have as significant an impact on our health as our health behaviors and access to quality health care [17]. Disparities in these factors, which collectively contribute to structural racism, have been identified as contributors to adverse health outcomes in BIPOC populations from a number of health conditions including cerebrovascular disease and stroke, cardiovascular disease, depression, and coronavirus disease 2019 (COVID-19) infection, to name just a few [18–20]. Thus, it should be unsurprising that sexual health disparities and higher rates of STIs exist, including among some racial and ethnic groups. In our analysis, we did not find that composite STI incidence differed by race or ethnicity overall across Durham County, except in historically marginalized areas, where we found higher-than-expected composite STI incidence among Black or African American populations. Our findings support previous findings that residential racial segregation is associated with disparities in STIs [21], including risk of gonorrhea infection, in racially segregated areas in the United States [22, 23].
Unequal access to sexual health care, differences in sexual network characteristics, and social segregation at the community level are likely other causes of sexual health disparities [2, 6, 24], which may explain the higher-than-expected composite STI incidence among Black or African Americans in historically marginalized areas of Durham County where other SDOH disparities exist. For example, relying on public transportation, particularly in settings where public transportation is inefficient, may lead to decreased access to sexual health care as it may be too burdensome to access this care. Sexual networks and social segregation have been shown to be efficient means to spread STIs, as sexually segregated networks may allow for more efficient spread of STIs as these networks may be small and relatively self-contained [6, 25, 26]. Other proposed causes of sexual health disparities include lower socioeconomic status, high incarceration rates among some groups, stigma surrounding STI testing, transportation difficulties, and differences in medical literacy [27, 28]. Here we provide further evidence that lack of health insurance, low income, and relying on public transportation may be associated with increased STI risk.
There are several imitations to this study. First, we used a composite STI variable rather than analyzing individual STI cases, so we were unable to determine whether any SDOH variables were more strongly associated with higher-than-expected STIs. Second, as we used variables at the census tract level and not the individual level, we were unable to infer causality between the variables of interest and composite STI incidence. Still, analyzing variables at the census tract level rather than zip code level greatly strengthened the model and our confidence in the strength of these associations. Third, we analyzed data during the year 2020, when we saw a modest decrease in the diagnosis of both chlamydia and gonorrhea in Durham County, likely due to the COVID-19 pandemic. The decrease in diagnosis of these STIs may reflect decreased STI transmission, diagnosis, or both due to pandemic-related changes. Although we suspect that our findings are not unique to the year 2020, we would need to confirm this with further research. Lastly, as this analysis involved only Durham County, our findings may not be generalizable to other settings in other geographic locations. Further analysis exploring the relationship between social determinants of health and STI incidence, particularly at the individual level and in more diverse geographic settings, is warranted.
We found that at the census tract level, having Medicaid insurance, having no health insurance, using public transportation, and income below the poverty level were most strongly associated with higher-than-expected composite STI incidence. Having health insurance, particularly employer health insurance, was most strongly associated with lower-than-expected composite STI incidence. Lastly, although composite STI incidence did not significantly differ among racial and ethnic groups overall, we did find higher-than-expected STI incidence among Black or African American populations in historically marginalized neighborhoods in Durham County. This finding suggests that underlying disparities in SDOH and structural racism account for these disparities in STI risk, not race or ethnicity. Efforts to improve health insurance access and transportation to health care appointments may decrease the burden of STIs, particularly for those most vulnerable to them. Combatting structural racism and alleviating poverty would likely decrease STI burden as well as other health disparities and improve health outcomes.
Acknowledgments
We thank the Howard W. Odum Institute for Research in Social Science, Davis Library, University of North Carolina Chapel Hill, Chapel Hill, North Carolina, USA, for assistance with the statistical analysis.
Author contributions. J.D.J. and J.P.Z. conceived and designed the study. J.D.J. wrote the initial draft. J.P.Z. performed the data analysis with input from E.N., A.T., N.K., K.M.L., and the Howard W. Odum Institute. J.D.J., E.N., A.T., N.K., K.M.L., S.C., M.M., and J.P.Z. provided critical comments. All authors read and approved the final manuscript.
Patient consent. The design of this work was approved by the Durham County Department of Public Health Review Board.
Financial support. J.D.J. received research funding from Astellas, F2G, and Pfizer.
References
Author notes
Potential conflicts of interest. JDJ received research funding from Astellas, F2G, and Pfizer – all outside of the submitted work. All other authors declare no potential conflicts of interest.


Comments