


Abstract
The reasons why bacterial sexually transmitted infections (BSTIs) are increasing in US men who have sex with men (MSM) have not been fully characterized.
An open cohort of MSM accessing medical care at a Boston community health center was used to assess secular trends in BSTI diagnoses. Frequency of infection and the estimated population size were used to calculate diagnosis rates. Poisson models were fit for multivariable analyses.
Between 2005 and 2015, 19 232 men had at least 1 clinic visit. Most (72.4%) were white; 6.0% were black, and 6.1% were Latino. Almost half had documented self-report of identifying as gay (42.6%) or bisexual (3.2%). Most had private health insurance (61.7%); 5.4% had Medicare, 4.6% had Medicaid, and 8.4% reported no insurance. Between 2005 and 2015, BSTI diagnoses increased more than 8-fold. In 2015, of 1319 men who were diagnosed with at least 1 BSTI; 291 were diagnosed with syphilis, 554 with gonorrhea (51.4% rectal, 31.0% urogenital), and 679 with chlamydia (69.1% rectal, 34.3% urogenital). In 2015, 22.7% of BSTIs were diagnosed among HIV-infected patients (15.4% of the clinic population), and 32.8% of BSTIs were diagnosed among HIV-uninfected patients using pre-exposure prophylaxis (PrEP; 10.1% of all men in care). In multivariable analyses, age 18 to 24 years, being HIV-infected, using PrEP, being nonwhite, or reporting Medicaid or not reporting having private insurance or Medicare were independently associated with being diagnosed with a new BSTI.
Over the past decade, BSTI diagnosis rates increased in HIV-infected and uninfected MSM, with disproportionate increases in PrEP users, racial and ethnic minority MSM, those aged 25 to 34 years, and those without stable health insurance, warranting focused education, screening, and accessible services for these key subpopulations.
Between 2005 and 2015, bacterial sexually transmitted infections (BSTIs) have markedly increased among men who have sex with men (MSM) [1–4]. Previously, BSTI were associated with increased likelihood of HIV spread in MSM, with BSTI trends considered surrogates for HIV transmission risk [5]. However, this association has been altered, given data supporting earlier initiation of treatment for HIV-infected people [6, 7], with associated virologic suppression decreasing HIV transmission risk [8, 9]. Additionally, the evidence that antiretroviral pre-exposure prophylaxis (PrEP) can decrease HIV incidence [10–15] has uncoupled the relationship between condomless sex and HIV acquisition. Concerns have been raised that HIV-infected individuals who are virologically suppressed and high-risk uninfected people adherent to PrEP are likely to decrease condom use, resulting in increasing BSTI rates [16–19].
To better understand secular trends in BSTI and the contribution of HIV-infected individuals and high risk HIV-uninfected MSM using HIV PrEP to increasing rates of BSTI, we analyzed data from an open cohort of MSM accessing primary care at a Boston community health center with expertise in the care of sexual and gender minority populations [20]. Since 1997, the community health center has used a standardized electronic health record using consistent data variables. The health center has been the largest HIV primary care practice in Massachusetts and has diagnosed the greatest number of BSTIs among MSM at a single site in New England. The center has conducted PrEP research for more than a decade [10, 21] and has the largest PrEP program in New England, and is thus well suited to evaluate associations of HIV treatment and prevention advances on BSTI trends.
METHODS
Study Population
We followed an open cohort of MSM receiving primary care in order to look at the absolute numbers and rates of new infections and the sociodemographic and behavioral correlates of those who were becoming infected with BSTI. This study included male patients accessing medical services at an urban federally qualified community health center serving more than 30 000 patients. Patients included in the sample were cisgender MSM (ie, male at birth and no indication of transgender or gender nonconforming identity), with at least 1 medical visit during the study period (January 1, 2005, through December 31, 2015). Since 2011, sexual orientation has been systematically recorded in the electronic health record (EHR) as a standardized variable, based on patient self-report during registration. Efforts have been made to update this information for patients registered prior to 2011, but this information is incomplete, especially for patients with infrequent or discontinued care. Therefore, to create the cohort, we assumed patients were MSM if (1) sexual orientation was recorded as gay or bisexual or (2) sexual orientation characterization was not recorded as heterosexual and laboratory records indicated prior examination for rectal or pharyngeal BSTI.
Data Collection
Data were abstracted from the health center’s electronic health record (GE Healthcare Centricity Practice Solution), which was implemented in 1997. The EHR includes all registration, encounter, clinical, sociodemographic, and billing information. Patient data were electronically extracted using Structured Query Language (SQL). Data extracted from the EHR included date of birth, sex at birth, gender identity, legal sex, sexual orientation, race/ethnicity, insurance status (on the date of data collection), HIV diagnoses (onset date), PrEP prescription records (dates prescribed and terminated), BSTI laboratory data (date and results of screening), and date of medical visits. SAS version 9.4 was used for all analyses.
BSTI Diagnoses
BSTI laboratory data were automatically imported, and SQL was used to extract test results, test types, and dates from discrete observation fields. Because several different diagnostic tests were used to detect gonorrhea and chlamydia over the course of the observation period (ie, polymerase chain reaction, transcription-mediated amplification, branched DNA, and gonococcal cultures), results were abstracted and recoded to uniformly indicate positive, negative, or indeterminate by anatomical site. Based on clinic protocols, we assumed that gonorrhea and chlamydia infections were adequately treated and considered subsequent infections in the same anatomical site as new, independent events. New syphilis infections were defined as the first reactive serological response of an rapid plasma reagin or Venereal Disease Research Laboratory, confirmed by an fluorescent treponemal antibody absorption test test, following at least 1 nonreactive result, or any change in titer response that was at least 4-fold greater than the previous screening, after appropriate antibiotic treatment, based on the Centers for Disease Control and Prevention Sexually Transmitted Disease Treatment Guidelines, 2015 [22]. The detection of syphilis and/or gonorrhea or chlamydia in multiple anatomical sites in 1 person on the same date was considered 1 infection for respective measurements of disease-specific occurrence.
HIV Serostatus and PrEP Use
We used the International Classification of Diseases (ICD) condition codes (ICD-9 and ICD-10: 042, V08, B20 and Z21) maintained by the World Health Organization to determine HIV status and clinician assigned date of seroconversion if HIV was diagnosed during the study period. Patients were assumed to be HIV-uninfected if no ICD code for HIV appeared in their EHR. To identify use of PrEP among HIV-uninfected patients, we searched prescription records for tenofovir-emtricitabine (and no third antiretroviral medication) that was prescribed for periods greater than 28 days (to exclude use as postexposure prophylaxis). For the purpose of this analysis, we assumed patients initiated PrEP if prescribed, and these patients were classified as PrEP users for the remainder of the study period.
Statistical Analyses
In crude analyses, chi-square tests [23] were used to compare characteristics of the subsample of patients with any BSTI during the study period with those with none; similarly, we stratified and compared patients by HIV serostatus and PrEP use at the end of the study period. Incidence rates of BSTI were calculated at 4-month intervals and were calculated seperately for HIV status, PrEP use, age category, race, and insurance status. To determine the size of the health center’s MSM population and the distribution of demographics during each interval, patients contributed 4 months of person-time to any interval of which either a medical visit or laboratory screening for BSTI occurred. If the clinical encounter was the patient’s first visit to the health center, person-time began on the date of the visit and accrued for the remainder of the interval. Person-time and BSTI frequency were aggregated for each combination of time interval and the demographic variables.
Insurance status and race/ethnicity were fixed for the entire study period, while age, HIV status, and PrEP use were time-varying. Age category was calculated on the midpoint of each time interval and held fixed for the entire interval. HIV status and PrEP use varied according to the date of seroconversion or PrEP initiation, respectively, such that patients contributed person-time according to their HIV status and PrEP use, proportional to the periods before and after the date of change. Any BSTIs diagnosed on the date of seroconversion or PrEP initiation were attributed to the period before the status change. Poisson regression [24] was used for multivariable analysis of BSTI diagnosis incidence, with time included as 2 continuous linear variables (2005–2009 and 2010–2015, inclusive), and HIV status, PrEP use, age category, race, and insurance status included categorically. Based on visual inspection of Figure 1, we used piecewise linear regression to model the longitudinal trend in diagnosis rate [25]. A spline knot between 2009 and 2010 allowed us to estimate separate slopes for 2005–2009 and 2010–2015. Crude and adjusted analyses were restricted to patients (n = 15 617) with available race/ethnicity and insurance information. Interaction was explored for age group and insurance status as well as age group and race. The observed effects were small in magnitude, so final regression models are restricted to main effects only.
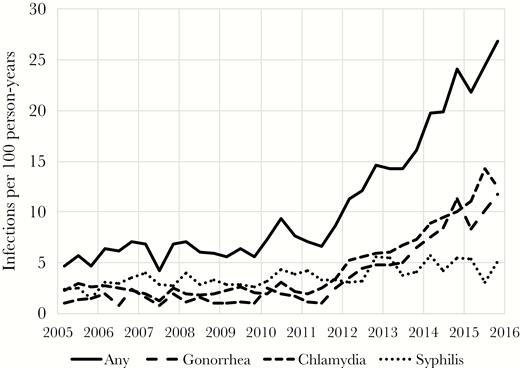
Diagnosis rate (unadjusted) of bacterial sexually transmitted infection (2005–2015). Abbreviation: PrEP, pre-exposure prophylaxis.
RESULTS
Between 2005 and 2015, 19 232 cis-gender men had at least 1 clinic visit (Table 1), of whom 3355 were only seen once. Most male patients (72.4%) seen during this time interval were white, 6.0% were black, and 6.1% were Latino. Although 42.6% of the male patients described themselves as gay and 3.2% as bisexual, 52.5% did not report their sexual orientation. The majority (61.7%) had private health insurance, 5.4% had Medicare, 4.6% had Medicaid, 8.4% reported no insurance, and for 16% insurance status was unknown (Table 1). The overall diagnosed HIV prevalence in the MSM population of the health center over the course of the study was 15.4%. Between 2005 and 2015, the clinic census of HIV-infected primary care patients doubled to 2085, with virologic suppression rates reaching 86% by 2015 (data not shown). In 2011, 5 patients initiated PrEP as part of medical care (outside of the context of a clinical trial), compared with 960 in 2015. By 2015, 10.1% of HIV-uninfected MSM in primary care at the community health center had been prescribed PrEP.
Sociodemographic Characteristics of Men Accessing Primary Care at a Boston Community Health Center
| Characteristic, n (%) | All patients | BSTI Diagnosisa | Final HIV and PrEP Use Statusb | |||||||||||
|---|---|---|---|---|---|---|---|---|---|---|---|---|---|---|
| Never | Ever | P Value | HIV+ | HIV- No PrEP | HIV- PrEP | P Value | ||||||||
| No. of patients | 19 232 | 16 114 | 3118 | 2968 | 14 633 | 1631 | ||||||||
| Age at entry to cohort, y | <.0001 | <.0001 | ||||||||||||
| 12–17 | 47 | 0.2 | 39 | 0.24 | 8 | 0.26 | 0 | 0.0 | 24 | 0.16 | 0 | 0.0 | ||
| 18–24 | 4195 | 21.8 | 3431 | 21.3 | 764 | 24.5 | 113 | 3.8 | 2503 | 17.1 | 190 | 11.7 | ||
| 25–34 | 6355 | 33.0 | 5173 | 32.1 | 1182 | 37.9 | 535 | 18.0 | 4879 | 33.3 | 718 | 44.0 | ||
| 35–44 | 4601 | 23.9 | 3828 | 23.76 | 773 | 24.79 | 726 | 24.5 | 2836 | 19.4 | 368 | 22.6 | ||
| 45+ | 4034 | 21.0 | 3643 | 22.6 | 391 | 12.5 | 1594 | 53.7 | 4391 | 30.0 | 355 | 21.8 | ||
| Race | <.0001 | <.0001 | ||||||||||||
| White | 13 917 | 72.4 | 11749 | 72.9 | 2168 | 69.5 | 2090 | 70.4 | 10 628 | 72.6 | 1199 | 73.5 | ||
| Black | 1153 | 6.0 | 896 | 5.6 | 257 | 8.2 | 292 | 9.8 | 771 | 5.3 | 90 | 5.5 | ||
| Latino | 1179 | 6.1 | 945 | 5.9 | 234 | 7.5 | 249 | 8.4 | 848 | 5.8 | 82 | 5.0 | ||
| Asian | 897 | 4.7 | 772 | 4.8 | 125 | 4.0 | 87 | 2.9 | 735 | 5.0 | 75 | 4.6 | ||
| Multiracial/other | 1112 | 5.8 | 845 | 5.2 | 267 | 8.6 | 225 | 7.6 | 725 | 5.0 | 162 | 9.9 | ||
| Not reported | 974 | 5.1 | 907 | 5.6 | 67 | 2.2 | 25 | 0.8 | 926 | 6.3 | 23 | 1.4 | ||
| Sexual orientation | <.0001 | <.0001 | ||||||||||||
| Gay | 8201 | 42.6 | 6407 | 39.8 | 1794 | 57.5 | 1464 | 49.3 | 5546 | 37.9 | 1191 | 73.0 | ||
| Bisexual | 615 | 3.2 | 523 | 3.3 | 92 | 3.0 | 70 | 2.4 | 497 | 3.4 | 48 | 2.9 | ||
| Don’t know/other | 323 | 1.7 | 255 | 1.6 | 68 | 2.2 | 60 | 2.0 | 226 | 1.5 | 37 | 2.3 | ||
| Not reported | 10 093 | 52.5 | 8929 | 55.4 | 1164 | 37.3 | 1374 | 46.3 | 8364 | 57.2 | 355 | 21.8 | ||
| Insurance | <.0001 | <.0001 | ||||||||||||
| Private | 11 861 | 61.7 | 9571 | 59.4 | 2290 | 73.4 | 1533 | 51.7 | 8842 | 60.4 | 1486 | 91.1 | ||
| Medicare | 1044 | 5.4 | 908 | 5.6 | 136 | 4.4 | 487 | 16.4 | 530 | 3.6 | 27 | 1.7 | ||
| Medicaid | 886 | 4.6 | 680 | 4.2 | 206 | 6.6 | 342 | 11.5 | 497 | 3.4 | 47 | 2.9 | ||
| None | 1615 | 8.4 | 1479 | 9.2 | 136 | 4.4 | 286 | 9.6 | 1307 | 8.9 | 22 | 1.4 | ||
| Other | 751 | 3.9 | 594 | 3.7 | 157 | 5.0 | 201 | 6.8 | 502 | 3.4 | 48 | 2.9 | ||
| Unknown | 3075 | 16.0 | 2882 | 17.9 | 193 | 6.2 | 119 | 4.0 | 2955 | 20.2 | 1 | 0.1 | ||
Abbreviations: BSTI, bacterial sexually transmitted infection; PrEP, pre-exposure prophylaxis.
a2005–2015.
bHIV status and PrEP use defined on the date of last patient contact during the study period.
Between 2005 and 2015, the annual number of BSTIs diagnosed at Fenway Health increased from 157 to 1319 (Table 2), with syphilis diagnoses increasing from 58 to 241 cases, gonorrhea from 40 to 554 cases, and chlamydia from 91 to 679 cases. In 2015, 13.9% of the HIV-infected male patients and 24.8% of male HIV-uninfected patients prescribed PrEP were diagnosed with at least 1 BSTI. The diagnosis rate of an MSM patient being diagnosed with a BSTI increased from 4.6 to 26.8 per 100 person-years between 2005 and 2015 (Figure 1). During the same time period, the overall volume of BSTI screening (unique tests per 100 patient-years) also increased (Figure 2). The magnitude of increased screening among HIV-infected patients and HIV-uninfected patients not accessing PrEP was modest, with the rate of BSTI screening (frequency of clinical visits in which at least 1 BSTI test was ordered) increasing from 140 to 211 BSTI visits per 100 person-years between 2005 and 2015 for HIV-infected MSM and 107 to 170 for HIV-uninfected MSM who were not using PrEP. Patients accessing PrEP had a much higher total volume of screening (increasing from 247 to 322 BSTI visits per 100 person-years over 4 years). The relative contribution of PrEP patients to the number of BSTI visits and diagnoses increased at the same time as the total number of patients accessing PrEP also increased in recent years (Figures 3 and 4).
Frequency of Bacterial STIs and Proportion Identified Among Patients HIV-Infected, HIV-Uninfected, or HIV-Uninfected and Using PrEP in the Years 2005 and 2015
| 2005 | 2015 | ||||||
|---|---|---|---|---|---|---|---|
| Total Na | HIV+ | HIV - | Total N | HIV+ | HIV- No PrEP | HIV- PrEP | |
| Any BSTIb | 157 | 38.2 | 61.8 | 1319 | 22.7 | 44.5 | 32.8 |
| Syphilis | 58 | 67.2 | 32.8 | 241 | 44.8 | 29.5 | 25.7 |
| Gonorrhea | 40 | 32.5 | 67.5 | 554 | 20.0 | 46.6 | 33.4 |
| Urogenital | 39 | 33.3 | 66.7 | 172 | 19.2 | 46.5 | 34.3 |
| Rectal | 0 | --- | --- | 285 | 21.4 | 45.3 | 33.3 |
| Chlamydia | 91 | 20.9 | 79.1 | 679 | 18.7 | 45.8 | 35.5 |
| Urogenital | 91 | 20.9 | 79.1 | 233 | 13.3 | 54.1 | 32.6 |
| Rectal | 0 | --- | --- | 469 | 21.5 | 40.7 | 37.7 |
Abbreviations: BSTI, bacterial sexually transmitted infection; PrEP, pre-exposure prophylaxis.
aFrequency of infections diagnosed in male patients accessing care during the calendar year.
bDiagnoses of more than 1 infection or the same infection in more than 1 anatomical site in a single patient on the same day were considered 1 infection for any BSTI.
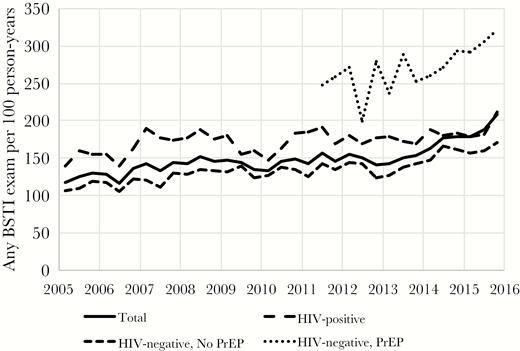
Screening rate (unique patient visits) of bacterial sexually transmitted infection stratified by HIV serostatus and pre-exposure prophylaxis use (2005–2015). Abbreviations: BSTI, bacterial sexually transmitted infection; PrEP, pre-exposure prophylaxis.
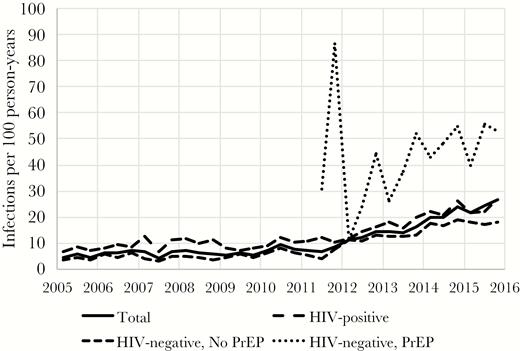
Diagnosis rate (unadjusted) of bacterial sexually transmitted infection stratified by HIV serostatus and pre-exposure prophylaxis use (2005–2015). Abbreviation: PrEP, pre-exposure prophylaxis.
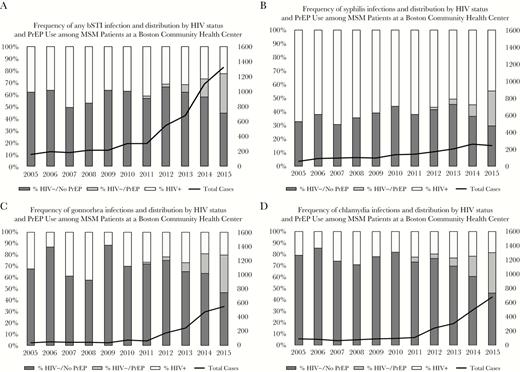
(A) Frequency of any bacterial sexually transmitted infection (BSTI) and distribution by HIV status and pre-exposure prophylaxis (PrEP) use among men who have sex with men (MSM) patients at a Boston community health center. (B) Frequency of syphilis infections and distribution by HIV status and PrEP use among MSM patients at a Boston community health center. (C) Frequency of gonnorhea infections and distribution by HIV status and PrEP use among MSM patients at a Boston community health center. (D) Frequency of chlamydia infections and distribution by HIV status and PrEP use among MSM patients at a Boston community health center. Abbreviation: PrEP, pre-exposure prophylaxis.
In 2015, 44% of syphilis diagnoses were among HIV-infected patients, while HIV prevalence among patients diagnosed with gonorrhea was 20%, and 19% for chlamydia (Table 2). The majority of patients who were diagnosed with BSTI were white (Table 1), although the BSTI prevalence among black and Latino male patients was significantly greater than their representation among patients engaged in medical care at the health center. In 2015, the mean age of BSTI patients was 41.3 years (SD = 13 years). Patients older than age 45 years contributed the most person-time to the study, reflecting the distribution of age in the sample (Table 3). Although many male patients diagnosed with a BSTI did not disclose their sexual orientation, 57.3% identified as gay. The majority of BSTI patients (72.1%) had private health insurance (Table 1). After exclusion of patients missing race/ethnicity or insurance information, there were no meaningful differences between the analysis sample and the original sample (Table 3).
Frequency of Bacterial STI Diagnosis and Person-time Contribution
| Total Sample | Analysis Samplea | |||||
|---|---|---|---|---|---|---|
| No. of Infections | Person-years | Diagnosis Rate | No. of Infections | Person-years | Diagnosis Rate | |
| Total | 5207 | 42 412 | 12.28 | 4931 | 40 183 | 12.27 |
| HIV status | ||||||
| HIV-infected | 1629 | 11 596 | 14.05 | 1616 | 11 483 | 14.07 |
| HIV-uninfected, no PrEP | 2918 | 29 486 | 9.90 | 2668 | 27 382 | 9.74 |
| HIV-uninfected, PrEP | 660 | 1331 | 49.59 | 647 | 1318 | 49.09 |
| Age group, y | ||||||
| 12–17 | 2 | 17 | 11.76 | 2 | 11 | 18.18 |
| 18–24 | 725 | 2830 | 25.62 | 642 | 2280 | 28.16 |
| 25–34 | 1950 | 9776 | 19.95 | 1844 | 8993 | 20.50 |
| 35–44 | 1333 | 11 470 | 11.62 | 1283 | 11 043 | 11.62 |
| 45+ | 1197 | 18 319 | 6.53 | 1160 | 17 857 | 6.50 |
| Race/ethnicity | ||||||
| Asian | 178 | 1283 | 13.87 | 166 | 1194 | 13.90 |
| Black | 461 | 2220 | 20.77 | 435 | 2119 | 20.53 |
| Multiracial/other | 427 | 1956 | 21.83 | 417 | 1933 | 21.57 |
| Latino | 387 | 2465 | 15.70 | 371 | 2342 | 15.84 |
| White | 3664 | 33 649 | 10.89 | 3542 | 32 594 | 10.87 |
| Not reported | 90 | 840 | 10.71 | 0 | 0 | -- |
| Insurance | ||||||
| Private | 3862 | 30 254 | 12.77 | 3811 | 29 831 | 12.78 |
| Medicare | 274 | 5048 | 5.43 | 274 | 5011 | 5.47 |
| Medicaid | 387 | 2087 | 18.54 | 386 | 2053 | 18.80 |
| None | 191 | 2246 | 8.50 | 183 | 2134 | 8.58 |
| Other | 281 | 1203 | 23.36 | 277 | 1154 | 24.00 |
| Unknown | 212 | 1576 | 13.45 | 0 | 0 | -- |
Abbreviations: BSTI, bacterial sexually transmitted infection; PrEP, pre-exposure prophylaxis.
aExcludes patients missing information on race/ethnicity and/or insurance.
A multivariable analysis was performed to assess independent predictors of BSTI diagnosis (Table 4). Relative to HIV-uninfected MSM not using PrEP, HIV-infected men had an adjusted diagnosis rate ratio (aDRR) of 1.83 (95% CI, 1.72–1.96) and HIV-uninfected PrEP users had an aDRR of 2.36 (95% CI, 2.15–2.59) for BSTI acquisition. Other variables associated with an increased rate of BSTI diagnoses were black race (aDRR, 1.34; 95% CI, 1.21–1.49) or multiracial background (aDRR, 1.19; 95% CI, 1.08–1.32). Insurance status also was associated with a diagnosis of BSTI, with Medicaid recipients having an aDRR of 1.22 (95% CI, 1.09–1.35) and those with Medicare having an aDRR of 0.60 (95% CI, 0.53–0.68) compared with those with private insurance. There also was a time trend in the diagnoses of BSTI, with the rate of BSTI diagnoses increasing by 5% each year from 2005–2009 (95% CI, 2%–9%) and 22% each year from 2010–2015 (95% CI, 13%–33%). Among HIV-infected MSM, the adjusted diagnosis rate of BSTI was 16.28 per 100 person-years in 2011, compared with 33.71 per 100 person-years in 2015, an increase of 17.43. For HIV-uninfected MSM, the diagnosis rate increased 19.22 from 6.65 to 25.87 per 100 person-years over the same time period.
Diagnosis Rate Ratio for Men Being Diagnosed with a Bacterial STI at a Boston Community Health Center, 2005–2015
| HIV Status | Crude Models | Multivariablea Model | ||||||||||
|---|---|---|---|---|---|---|---|---|---|---|---|---|
| DRb | 95% CI | DRR | 95% CI | DRb | 95% CI | DRR | 95% CI | |||||
| HIV+ | 14.07 | 13.40 | 14.78 | 1.44 | 1.36 | 1.54 | 19.04 | 14.31 | 25.33 | 1.83 | 1.72 | 1.96 |
| HIV-, no PrEP | 9.74 | 9.38 | 10.12 | Ref | 10.39 | 7.82 | 13.80 | Ref | ||||
| HIV-, PrEP | 49.11 | 45.47 | 53.04 | 5.04 | 4.63 | 5.49 | 24.55 | 18.27 | 32.99 | 2.36 | 2.15 | 2.59 |
| Age group, y | ||||||||||||
| 12–17 | 18.95 | 4.74 | 75.77 | 0.67 | 0.17 | 2.70 | 19.66 | 4.91 | 78.78 | 0.66 | 0.16 | 2.65 |
| 18–24 | 20.51 | 19.59 | 21.46 | Ref | 29.78 | 27.03 | 32.80 | Ref | ||||
| 25–34 | 11.62 | 11.00 | 12.27 | 0.73 | 0.67 | 0.80 | 22.04 | 20.43 | 23.78 | 0.74 | 0.68 | 0.81 |
| 35–44 | 6.50 | 6.13 | 6.88 | 0.41 | 0.38 | 0.45 | 14.41 | 13.25 | 15.66 | 0.48 | 0.44 | 0.53 |
| 45+ | 28.16 | 26.06 | 30.42 | 0.23 | 0.21 | 0.25 | 7.49 | 6.84 | 8.20 | 0.25 | 0.23 | 0.28 |
| Race | ||||||||||||
| Asian | 13.90 | 11.94 | 16.18 | 1.28 | 1.09 | 1.49 | 13.57 | 9.85 | 18.69 | 0.87 | 0.74 | 1.02 |
| Black | 20.53 | 18.69 | 22.55 | 1.89 | 1.71 | 2.09 | 20.93 | 15.58 | 28.12 | 1.34 | 1.21 | 1.49 |
| Multiracial/other | 21.57 | 19.59 | 23.74 | 1.98 | 1.79 | 2.20 | 18.58 | 13.84 | 24.94 | 1.19 | 1.08 | 1.32 |
| Latino | 15.84 | 14.31 | 17.54 | 1.46 | 1.31 | 1.62 | 16.94 | 12.57 | 22.82 | 1.09 | 0.98 | 1.21 |
| White | 10.87 | 10.51 | 11.23 | Ref | 15.58 | 11.73 | 20.69 | Ref | ||||
| Insurance | ||||||||||||
| Medicaid | 18.80 | 17.02 | 20.78 | 1.47 | 1.33 | 1.63 | 20.68 | 15.40 | 27.76 | 1.22 | 1.09 | 1.35 |
| Medicare | 5.47 | 4.86 | 6.16 | 0.43 | 0.38 | 0.48 | 10.19 | 7.51 | 13.85 | 0.60 | 0.53 | 0.68 |
| None | 8.58 | 7.42 | 9.91 | 0.67 | 0.58 | 0.78 | 17.06 | 12.43 | 23.41 | 1.00 | 0.86 | 1.17 |
| Other | 24.00 | 21.33 | 27.00 | 1.88 | 1.66 | 2.12 | 22.78 | 16.81 | 30.87 | 1.34 | 1.18 | 1.52 |
| Private | 12.78 | 12.38 | 13.19 | Ref | 17.00 | 12.80 | 22.57 | Ref | ||||
| Time trendc | ||||||||||||
| 2005–2009 | --- | 1.01 | 0.98 | 1.05 | --- | 1.05 | 1.02 | 1.09 | ||||
| 2010–2015 | --- | 1.28 | 1.18 | 1.39 | --- | 1.22 | 1.13 | 1.33 | ||||
Abbreviations: BSTI, bacterial sexually transmitted infection; DR, diagnosis rate; DRR, diagnosis rate ratio; PrEP, pre-exposure prophylaxis.
aAdjusted for all other covariates in the model.
bDiagnosis rate per 100 person-years.
cOne-year increments.
We considered 2 scenarios where bias in the data could be generating our results. First, to assess whether missing sexual orientation information prior to 2011 could bias diagnosis rates of BSTIs, we performed a sensitivity analysis of the multivariable model (data not shown) by stratifying the sample to compare subjects with recorded sexual orientation with those without. The time trend in diagnosis rate was the same for both groups of MSM. Second, we considered whether infections diagnosed on a patient’s first medical visit could bias the results if episodic BSTI screening changed over time. We excluded such cases for a sensitivity analysis (data not shown) and found the results, including the time trend, to be unchanged.
DISCUSSION
This study found an increasing rate of BSTI diagnoses among MSM accessing care in a Boston community health center between 2005 and 2015, reflecting national trends [2]. Some have attributed the recent increase in BSTI primarily to PrEP use [16], but the current data derived from a regional center specializing in care of MSM [20] suggest that the factors associated with increasing BSTI among MSM are more complex and multifaceted, as increases in BSTI were also seen in HIV-infected MSM and HIV-uninfected MSM not using PrEP. Part of the explanation for the increased detection of BSTIs in MSM is that screening rates increased significantly over the decade (Figure 2). However, this does not fully explain the findings in this study for several reasons: the secular trends in diagnosis rates were seen independently in HIV-infected and HIV-uninfected MSM who were not using PrEP, as well as PrEP patients, even though overall screening rates did not increase greatly among MSM in the first 2 categories, and the secular trend toward increasing BSTI rates began before 2010, even though screening rates did not significantly increase until 2013. Another factor that may explain the increased BSTI screening rates is that the care setting was a federally qualified community health center in a state that embraced health insurance reforms more than a decade ago. Ryan-White funds supported BSTI screening for HIV-infected patients, and almost all of the HIV-uninfected individuals had access to health insurance.
However, there were subgroup differences in screening and diagnosis rates among the MSM. Individuals who accessed PrEP were most likely to be diagnosed with a new BSTI, with a diagnosis rate ratio of 2.36 compared with those who were not PrEP users, similar to several recent reports in other care centers [17, 18]. The detection of increasing BSTI diagnoses among PrEP-using MSM underscores the importance of routine BSTI screening of MSM PrEP users [26]. The higher BSTI prevalence in PrEP users may reflect ascertainment biases because of their increased frequency of asymptomatic routine screening compared with MSM not engaged in PrEP care.
HIV-infected MSM also had an increased incidence rate ratio for BSTI diagnoses compared with HIV-uninfected MSM who were not using PrEP, suggesting that PrEP has not been the sole driver of increasing BSTIs among MSM. PrEP was only introduced into clinical care in 2011, but the increasing rates of BSTIs among HIV-infected MSM began earlier in the decade. Even after adjusting for HIV status and PrEP use, the longitudinal trend of increasing BSTI diagnoses remained significant in the analysis. Overall BSTI rates were lowest for HIV-uninfected MSM who were not using PrEP, but as they were the majority of MSM clinic patients, their BSTI burden represents a major contribution to the number of infections. The absolute associations of PrEP and HIV serostatus with community BSTI burden can best be determined in prospective cohort studies using uniform screening protocols.
The trend toward increased BSTI rates among HIV-infected MSM might reflect serosorting, ie, selecting only other HIV-infected partners, in order to engage in condomless intercourse without concern about transmitting HIV to new partners [26], though it may also reflect an increased willingness to engage in condomless sex with partners of any serostatus. Almost all of this clinic’s HIV-infected patients were virologically suppressed, and they may have felt that they were unlikely to transmit HIV [27, 28], which is supported by multiple studies [6, 7, 29]. The data in the current study support the importance of routine BSTI screening as part of HIV primary care, in conjunction with support for antiretroviral medication adherence.
This study also found that BSTIs were also rising among HIV-uninfected MSM who were not using PrEP. This last group of individuals deserves particular attention because, in addition to having acquired a BSTI, by not accessing PrEP they are particularly vulnerable to HIV seroconversion [30, 31]. It will be important to better understand why these individuals did not avail themselves of PrEP, given their increased risk for HIV. Although black and multiracial MSM constituted a minority of the male clinic patients, they were much more likely to acquire a new BSTI than other MSM, even when controlling for other variables. About one-fourth of all new HIV infections in the United States are diagnosed in black MSM, although they constitute less than 1% of the US population and are often economically disenfranchised [32, 33], impeding access to preventive care services. Because of their disproportionate HIV and BSTI incidence, strategies to engage black and other racial and ethnic minority MSM to increase STI screening, HIV status awareness, and access to prompt treatment or PrEP are needed to stem the spread of HIV in these communities. Individuals who were insured by Medicaid were more likely to acquire BSTIs than those with private insurance in the current study (Table 4). It is conceivable that not having private health insurance may reflect social and structural adversities, such as being unemployed, and/or being a recent migrant to the state or the United States. It is feasible that programs focused on addressing these issues could ensure prompt and timely access to sexual health services, leading to earlier diagnoses and treatment, decreasing further transmission.
In summary, these data document a marked increase in the rate of new BSTIs between 2005 and 2015 in a Boston community health center. However, the data also suggest that the reasons for increasing BSTI rates in this population are complex and multifactorial. The data should be carefully interpreted, as the analyses were based on an open cohort; ie, individuals had variable lengths of follow-up and were not part of a uniform screening protocol, compared with a prospective cohort study, in which the frequency of screening would be prespecified. Hence, provider and patient behavior could introduce unmeasured confounding. Changes in screening practices over the decade could have led to ascertainment biases. HIV-infected patients and those using PrEP were screened more regularly as part of the clinical monitoring, while HIV-uninfected MSM who were not using PrEP had fewer reasons to seek ongoing care and were screened less often for BSTIs. Estimates of BSTI incidence may also be imprecise if some individuals were managed syndromically and did not have corroborative lab assays performed, although this practice was not common in this clinic.
The increased BSTI diagnoses among PrEP users may be due to risk compensation, but it may also reflect increased routine screening. At the same time, the majority of people who developed a BSTI were not on PrEP. These data suggest that individuals who are HIV-infected and virologically suppressed should be reminded of their vulnerability to acquiring and transmitting BSTIs. This study also documented a substantial number of HIV-uninfected MSM who had BSTIs and who were not on PrEP, and who remain at high risk for HIV seroconversion. The findings from the current study suggest that ongoing PrEP education and integration with BSTI diagnostic and treatment services remain an important priority, with particular attention needed in developing programs that are culturally tailored to engage black and other racial and ethnic minority MSM that address social and structural challenges to accessing this preventive intervention. Routine sexual health counseling as part of the care for MSM is exceedingly important, as evinced by the study data, given high rates of diagnosed BSTIs in HIV-infected and -uninfected MSM.
Acknowledgements
The assistance of Mary Childs in the preparation of this manuscript is greatly appreciated.
Financial support. This work was supported by the National Institutes of Health through the Harvard Center for AIDS Research (P30 AI060354), K23 MH098795, the Emory Center for AIDS Research (P30AI050409).
Potential conflicts of interest. KHM has received unrestricted research grants from Gilead Sciences and ViiV Healthcare. DSK has conducted research supported by unrestricted research grants from Gilead Sciences. KMM has no conflicts to report. None of the other authors have conflicts of interest to declare.
All authors: no reported conflicts of interest. All authors have submitted the ICMJE Form for Disclosure of Potential Conflicts of Interest. Conflicts that the editors consider relevant to the content of the manuscript have been disclosed.
References


Comments