


Abstract
Individuals who are immunocompromised (IC) are at high risk for severe coronavirus disease 2019 (COVID-19).
Post hoc analyses of a double-blind trial conducted prior to Omicron (June 2020–April 2021), in hospitalized patients with COVID-19 assessed viral load, clinical outcomes, and safety of casirivimab plus imdevimab (CAS + IMD) versus placebo in IC versus overall study patients.
Ninety-nine of 1940 (5.1%) patients were IC. IC versus overall patients were more frequently seronegative for severe acute respiratory syndrome coronavirus 2 (SARS-CoV-2) antibodies (68.7% vs 41.2%) and had higher median baseline viral loads (7.21 vs 6.32 log10 copies/mL). On placebo, IC versus overall patients had slower viral load declines. CAS + IMD reduced viral load in IC and overall patients; least-squares mean difference versus placebo in time-weighted average change from baseline viral load at day 7 was −0.69 (95% confidence interval [CI], −1.25 to −.14) log10 copies/mL for IC patients and −0.31 (95% CI, −.42 to −.20) log10 copies/mL for overall patients. For IC patients, the cumulative incidence of death or mechanical ventilation at day 29 was lower with CAS + IMD (11.0%) versus placebo (17.2%), consistent with overall patients (15.7% CAS + IMD vs 18.3% placebo). IC and overall patients receiving CAS + IMD exhibited similar rates of treatment-emergent adverse events (30.4% and 26.6%, respectively), grade ≥2 hypersensitivity or infusion-related reactions (1.4% and 2.5%), and deaths (8.7% and 12.2%).
IC patients were more likely to exhibit high viral loads and be seronegative at baseline. For susceptible SARS-CoV-2 variants, CAS + IMD reduced viral load and resulted in fewer death or mechanical ventilation events in IC and overall study patients. There were no new safety findings among IC patients.
Clinical Trials Registration. NCT04426695.
Estimates of the number of individuals who are immunocompromised (IC) are as high as 3% of the United States (US) population, including those with immunocompromising conditions and those taking immunosuppressive medications [1, 2]. These IC individuals represent a disproportionate percentage of patients hospitalized with coronavirus disease 2019 (COVID-19): approximately 7% of hospitalized patients with COVID-19 have previously been on immunosuppressive medications [3]. Furthermore, in a recent analysis of intensive care unit admissions, IC patients accounted for 12.2% of COVID-19 hospitalizations in the US [4]. Despite widespread vaccination, many IC individuals do not mount an adequate immune response to COVID-19 vaccines, leaving them unprotected and at increased risk for severe acute respiratory disease coronavirus 2 (SARS-CoV-2) infection and progression to severe COVID-19, associated with high morbidity and mortality [5–7]. Persistent active infection has also been observed in IC individuals, where it may lead to accumulated viral mutations [8]. Antiviral treatments for COVID-19, including monoclonal antibodies (mAbs) and small molecules that are effective against susceptible variants [9, 10], have previously been recommended for use in IC patients in the outpatient and hospitalized setting [11, 12]. However, clinical trials that tested these COVID-19 treatments enrolled few participants who were IC. While at this time, no mAbs are approved to treat currently circulating SARS-CoV-2 variants, the efficacy and safety of using mAbs in this population requires further investigation that can inform treatment with newer mAbs for susceptible variants.
Casirivimab plus imdevimab (CAS + IMD) is a combination of neutralizing mAbs that simultaneously bind nonoverlapping epitopes of the receptor-binding domain of susceptible variants of the SARS-CoV-2 spike protein, intended to prevent susceptible viral variants from infecting host cells [13–15]. Prior to the emergence of Omicron-lineage subvariants, CAS + IMD was authorized for emergency use for the treatment of outpatients with mild-to-moderate COVID-19 and for postexposure prophylaxis in the US and other jurisdictions [16–18]. While CAS + IMD retains neutralization potency against historical SARS-CoV-2 variants, including the Delta variant, it has substantially diminished neutralization potency against Omicron-lineage variants and is not currently authorized in any US region.
Clinical trials with CAS + IMD demonstrated reduced mortality in patients hospitalized with susceptible variants of COVID-19 [19, 20]. To assess the efficacy and safety of CAS + IMD in IC patients, we performed a post hoc analysis of the COV-2066 placebo-controlled clinical trial of hospitalized patients with COVID-19, which was conducted from June 2020 to April 2021 when variants susceptible to CAS + IMD (predominantly Alpha) were circulating.
METHODS
Study Design
This adaptive, phase 1/2/3, double-blind, placebo-controlled trial evaluated the efficacy, safety, and tolerability of CAS + IMD in hospitalized adult patients with COVID-19, as previously described [20]. The study was conducted at 103 sites in the US, Brazil, Chile, Mexico, Moldova, and Romania between 10 June 2020 and 9 April 2021 (NCT04426695).
Patients were enrolled in 1 of 4 study cohorts based on disease severity: no supplemental oxygen (cohort 1A) or requiring low-flow oxygen (cohort 1), high-intensity oxygen (cohort 2), or mechanical ventilation (cohort 3) (Supplementary Figure 1). The phase 1 portion of the study enrolled patients receiving low-flow oxygen only (cohort 1). Progression to phase 2 was contingent upon independent data monitoring committee (IDMC) review of phase 1 data from the sentinel safety group, after which patients were enrolled into all cohorts. Patients were randomized 1:1:1 to a single intravenous dose of 2.4 g CAS + IMD (1.2 g casirivimab plus 1.2 g imdevimab), 8.0 g CAS + IMD (4.0 g casirivimab plus 4.0 g imdevimab), or placebo.
On 30 October 2020, the IDMC recommended pausing enrollment of patients receiving high-intensity oxygen (cohort 2) and mechanical ventilation (cohort 3) based on an imbalance in mortality observed in interim data early during the conduct of the study. While enrollment into cohorts 2 and 3 was paused, the study continued to enroll cohorts 1 and 1A [20]. In addition to cohort 1 and 1A patients, all patients in cohorts 2 and 3 who were ongoing at the time of the enrollment pause were followed up through the end of the study. Data presented in this manuscript are from phase 1/2/3 for cohort 1, and from phase 2 for cohorts 1A, 2, and 3.
Patients
Patients were ≥18 years of age and hospitalized with positive SARS-CoV-2 testing within 72 hours and had symptom onset ≤10 days from randomization. Standard-of-care treatments for COVID-19, per the investigator, were permitted. While COVID-19 vaccination was not prohibited, the study was conducted prior to widespread use of COVID-19 vaccines. Through the entire study, a total of 10 of 1410 (0.7%) patients in cohort 1 (phase 1/2/3) and 7 of 597 (1.2%) patients in cohort 1A reported COVID-19 vaccination during the study. Cohorts 2 and 3 were paused prior to vaccine availability. Full inclusion and exclusion criteria are presented in the Supplementary Appendix. For this post hoc analysis, the overall study patient population consisted of all study patients with a SARS-CoV-2 quantitative reverse-transcription polymerase chain reaction (qRT-PCR) test at baseline, including those who were IC. The IC patient population was defined by strict adjudication criteria that included those with primary B-cell, secondary B-cell, or drug-induced immunodeficiencies (Supplementary Table 1).
Patient Consent
All patients provided written informed consent before participating in the trial. The trial was conducted in accordance with the principles of the Declaration of Helsinki, the International Council for Harmonisation Good Clinical Practice guidelines, and applicable regulatory requirements. The local institutional review board or ethics committee at each study center oversaw trial conduct and documentation. A list of ethics review boards are presented in the Supplementary Appendix.
Outcome Measures
Patients were assessed at baseline for SARS-CoV-2 antibody serostatus, neutralizing antibody status, and viral load. Serostatus was evaluated using a composite of 3 individual assays, and neutralizing antibodies were assessed using modifications of the IMMUNO-COV assay [21].
The endpoints in this post hoc analysis were selected from the primary virology and clinical endpoints of the parent COV-2066 study [20]. Virologic efficacy analyses assessed change in viral load via time-weighted average (TWA) daily change from baseline in viral load in nasopharyngeal swab samples, and clinical analyses included the composite clinical endpoint of the proportion of patients who died or went on mechanical ventilation.
Safety analyses assessed the proportion of patients with treatment-emergent adverse events (TEAEs), adverse events of special interest (AESIs; infusion-related reactions through day 4 and grade ≥2 hypersensitivity reactions through day 29), and deaths in IC patients versus the overall study patient population.
Statistical Analysis
In this study, of the total 2203 hospitalized patients with COVID-19 who were randomized and received at least 1 dose of the study drug, only 106 (<5%) patients (across all disease severity and phases of trial) were IC. Due to the small sample size of IC patients enrolled in the study, for this post hoc analysis data were pooled from phase 1/2/3 patients on low-flow supplemental oxygen (cohort 1), phase 2 patients on no supplemental oxygen (cohort 1A), phase 2 patients on high-intensity supplemental oxygen (cohort 2), and phase 2 patients on mechanical ventilation (cohort 3), as described in the Study Design section. Comparisons with placebo are made for each separate treatment group of CAS + IMD 2.4 g, or CAS + IMD 8.0 g, as well as for CAS + IMD dose groups (2.4 g and 8.0 g) combined.
Efficacy analyses in the overall study population and the IC population utilized the modified full analysis set (mFAS), which excluded patients who had a negative SARS-CoV-2 qRT-PCR test result at baseline. The overall study patient population consisted of all patients in the mFAS, including those who were IC. Therefore, the overall population and the IC population are not independent. The IC patient population was defined by strict adjudication criteria that included those with primary B-cell, secondary B-cell, or drug-induced immunodeficiencies (Supplementary Table 1). Medical history terms and concomitant medication terms matching the criteria in Supplementary Table 1, as determined by literature review, were programmed by blinded biostatistical team members. A clinical team composed of 3 blinded reviewers adjudicated the IC patients to verify whether the criteria were met.
Virologic results were plotted using raw data, and modeled data were provided for the summary table. Viral load over time was analyzed using the virologic endpoint of TWA change from baseline in viral load (log10 copies/mL) from day 1 to each postbaseline visit timepoint, which is calculated for each patient using the trapezoidal rule as the area under the curve for change from baseline at each timepoint divided by the time interval for the observation period (eg, time interval is 6 days for day 1 through day 7). TWA daily change in viral load from baseline was analyzed using an analysis of covariance model with treatment group, the type of background standard of care (antiviral therapies and nonantiviral therapies) and baseline serostatus as fixed effects, and baseline viral load and treatment by baseline viral load interaction as covariates. The least-squares means estimates for TWA change from baseline in viral load for each treatment group, and the difference between each CAS + IMD treatment group and placebo as well as between CAS + IMD combined doses and placebo, are provided along with the corresponding 2-sided P value and associated 95% confidence intervals (CIs). The cumulative incidence for the composite clinical endpoint (death or mechanical ventilation) was estimated using Kaplan-Meier method and corresponding 95% CIs are reported.
Safety analyses were assessed in IC patients versus the overall study population. Safety was assessed in all randomized patients who received any amount of study drug (safety analysis set); analyses in the IC population utilized the subset of patients from the safety analysis set as defined in Supplementary Table 1.
Study Oversight
Regeneron Pharmaceuticals, Inc, designed the trial and, with the trial investigators, gathered the data. Regeneron Pharmaceuticals analyzed the data. The summary of protocol amendments is available in the protocol, and a complete list of trial investigators is presented in the Supplementary Appendix. The investigators, site personnel, and Regeneron Pharmaceuticals were unaware of the treatment group assignments. An IDMC monitored unblinded data to make recommendations about safety, efficacy, and potential trial modifications.
RESULTS
Demographics and Baseline Characteristics
Of the 2203 participants from all cohorts, 1940 (88.1%) were included in the overall mFAS. Of those, 99 (5.1%) treated patients were identified as IC using strict adjudication criteria (outlined in Supplementary Table 1). Of these, 4 of 99 (4%) were patients with primary immunodeficiency, 38 of 99 (38%) were patients with secondary immunodeficiency, and 66 of 99 (66.7%) were patients with drug-induced immunodeficiency. The demographics for IC patients compared with the overall study patients were as follows: mean age (62.4 vs 61.7 years), sex (62.6% vs 54.6% male), and race/ethnicity (15.2% vs 12.9% Black or African American and 20.2% vs 29.1% Hispanic or Latino) (Supplementary Table 2).
IC patients had a higher median viral load at baseline compared with overall study patients (7.21 [interquartile range {IQR}, 6.11–7.85] log10 copies/mL vs 6.32 [IQR, 5.05–7.55] log10 copies/mL; Figure 1, Supplementary Table 2), higher SARS-CoV-2 seronegative rates at baseline (68.7% vs 41.2%), and lesser presence of neutralizing antibodies within patients who were seropositive (56.0% vs 75.9%; Supplementary Table 2). A higher proportion of IC patients than overall study patients were hospitalized without the need for supplemental oxygen (cohort 1A; 55.6% vs 27.3%).

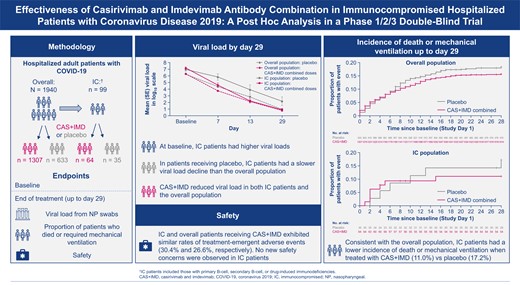
Severe acute respiratory syndrome coronavirus 2 viral load over time from baseline through day 29. Graph shows least-squares mean viral load following administration of CAS + IMD (2.4 g, 8.0 g, or combined analysis of 2.4 g and 8.0 g) or placebo for immunocompromised and all study patients. The lower limit of quantification is 2.85 log10 copies/mL. Abbreviations: CAS + IMD, casirivimab plus imdevimab; IC, immunocompromised; SE, standard error.
Virologic Efficacy
Viral load was analyzed at days 7, 13, and 29. Of patients receiving placebo, those who were IC had slower declines in viral load than the overall placebo patient population (Figure 1). For the placebo group, the slope of the line from baseline to day 7 was −0.16 in the IC population and −0.32 in the overall population; these differences in the slopes were not apparent by day 29. For IC patients compared with overall study patients on placebo, the least-squares mean TWA daily change in viral load from days 1 to 7 was −0.49 (95% CI, −1.06 to .08) versus −0.93 (95% CI, −1.03 to −.83), from days 1 to 13 was −1.17 (95% CI, −1.92 to −.41) versus −1.51 (95% CI, −1.63 to −1.39), and from days 1 to 29 was −2.08 (95% CI, −2.95 to −1.21) versus −2.46 (95% CI, −2.61 to −2.31), respectively (Table 1).
Time-Weighted Average Change in Viral Load From Baseline in Immunocompromised Patients Compared With the Overall Population
| TWA Change | Overall Study Population | Immunocompromised Population | ||||||
|---|---|---|---|---|---|---|---|---|
| Placebo (n = 633) | CAS + IMD 2.4 g IV (n = 664) | CAS + IMD 8.0 g IV (n = 643) | CAS + IMD Combined Doses (n = 1307) | Placebo (n = 35) | CAS + IMD 2.4 g IV (n = 32) | CAS + IMD 8.0 g IV (n = 32) | CAS + IMD Combined Doses (n = 64) | |
| Median baseline VL, log10 copies/mL | 6.28 | 6.35 | 6.36 | 6.36 | 6.89 | 7.51 | 6.87 | 7.36 |
| TWA change from day 1 to day 7 | ||||||||
| No. | 567 | 584 | 572 | 1156 | 30 | 30 | 29 | 59 |
| LS mean (SE) | −.93 (0.05) | −1.27 (.05) | −1.21 (.05) | −1.24 (.04) | −.49 (.29) | −1.43 (.28) | −.92 (.26) | −1.16 (.22) |
| 95% CI | −1.03 to −.83 | −1.37 to −1.17 | −1.31 to −1.11 | −1.32 to −1.16 | −1.06 to .08 | −1.99 to −.88 | −1.44 to −.40 | −1.59 to −.73 |
| Difference vs placebo | … | −.34 (.06) | −.28 (.06) | −.31 (.06) | … | −.94 (.32) | −.43 (.32) | −.69 (.28) |
| 95% CI | … | −.47 to −.22 | −.41 to −.15 | −.42 to −.20 | … | −1.58 to −.31 | −1.07 to .20 | −1.25 to −.14 |
| P Value | … | <.0001 | <.0001 | <.0001 | … | .0041 | .1801 | .0146 |
| TWA change from day 1 to day 13 | ||||||||
| LS mean (SE) | −1.51 (.06) | −1.95 (.06) | −1.94 (.06) | −1.95 (.05) | −1.17 (.38) | −2.52 (.38) | −1.75 (.35) | −2.09 (.29) |
| 95% CI | −1.63 to −1.39 | −2.07 to −1.84 | −2.06 to −1.82 | −2.04 to −1.86 | −1.92 to −.41 | −3.27 to −1.77 | −2.45 to −1.06 | −2.67 to −1.50 |
| Difference vs placebo | … | −.45 (.08) | −.44 (.08) | −.44 (.07) | … | −1.35 (.42) | −.59 (.42) | −.96 (.37) |
| 95% CI | … | −.60 to −.30 | −.59 to −.29 | −.57 to −.31 | … | −2.19 to −.51 | −1.43 to .26 | −1.69 to −.23 |
| P Value | … | <.0001 | <.0001 | <.0001 | … | .0021 | .1699 | .0107 |
| TWA change from day 1 to day 29 | ||||||||
| LS mean (SE) | −2.46 (.08) | −2.90 (.07) | −2.96 (.08) | −2.93 (.06) | −2.08 (.44) | −3.70 (.46) | −3.50 (.43) | −3.60 (.35) |
| 95% CI | −2.61 to −2.31 | −3.05 to −2.75 | −3.11 to −2.82 | −3.05 to −2.82 | −2.95 to −1.21 | −4.62 to −2.79 | −4.36 to −2.64 | −4.30 to −2.91 |
| Difference vs placebo | … | −.44 (.09) | −.50 (.09) | −.47 (.08) | … | −1.62 (.52) | −1.42 (.52) | −1.53 (.44) |
| 95% CI | … | −.62 to −.25 | −.69 to −.32 | −.63 to −.31 | … | −2.66 to −.59 | −2.45 to −.39 | −2.40 to −.66 |
| P Value | … | <.0001 | <.0001 | <.0001 | … | .0024 | .0073 | .0008 |
Abbreviations: CAS + IMD, casirivimab plus imdevimab; CI, confidence interval; IV, intravenous; LS, least-squares; SE, standard error; TWA, time-weighted average; VL, viral load.
Treatment with CAS + IMD led to a reduction in the viral load of overall study patients; the least-squares mean difference versus placebo in TWA daily change in baseline viral load was −0.31 (95% CI, −.42 to −.20) at day 7 and −0.47 (95% CI, −.63 to −.31) at day 29. For the IC patient subset, the response to CAS + IMD was more robust; the lease squares mean difference versus placebo in TWA daily change in baseline viral load was −0.69 (95% CI, −1.25 to −.14, P = .0146) at day 7 and −1.53 (95% CI, −2.40 to −.66, P = .0008) at day 29 (Table 1).
Clinical Efficacy
Although the sample size of the IC population was small, with few events of death or mechanical ventilation (7 total events were observed among IC patients through day 29), there were trends for treatment-related decrease in the cumulative incidence of death or the need for mechanical ventilation through day 29 in IC patients (7/64 [11%] CAS + IMD vs 6/35 [17.2%] placebo). This is consistent with the rates observed among overall study patients (200/1307 [15.7%] CAS + IMD vs 113/633 [18.3%] placebo; Table 2 and Figure 2). This benefit became apparent after day 10 because of higher event rates reported in the active treatment group prior to day 10. There were fewer deaths in the group of IC patients treated with CAS + IMD at day 29 (4/64 [6.3%]) compared with those who received placebo (5/35 [14.4%]) (Supplementary Figure 2).
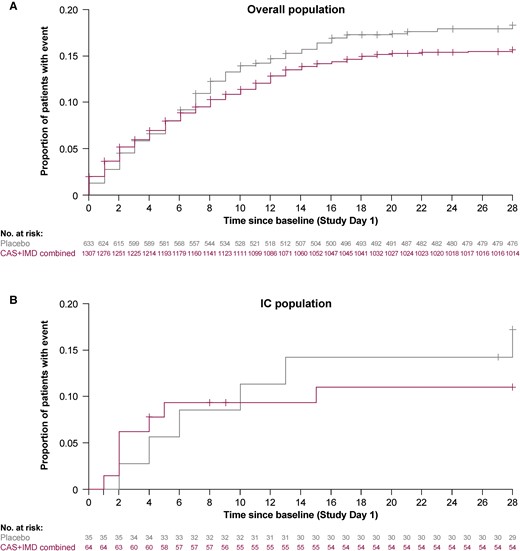
Cumulative incidence of death or mechanical ventilation through day 29. Kaplan-Meier curve for the proportion of overall study patients (A) and immunocompromised study patients (B) who died through study day 29, after administration of CAS + IMD (combined analysis of 2.4 g or 8.0 g) or placebo. + indicates censoring. Abbreviations: CAS + IMD, casirivimab plus imdevimab; IC, immunocompromised.
Incidence of Death or Mechanical Ventilation Events Through Day 29
| (Sub)group | Overall Study Population | Immunocompromised Population | ||||||
|---|---|---|---|---|---|---|---|---|
| Placebo | CAS + IMD 2.4 g IV | CAS + IMD 8.0 g IV | Combined Doses | Placebo | CAS + IMD 2.4 g IV | CAS + IMD 8.0 g IV | Combined Doses | |
| Overall | n = 633 | n = 664 | n = 643 | n = 1307 | n = 35 | n = 32 | n = 32 | n = 64 |
| Events, No. | 113 | 98 | 102 | 200 | 6 | 4 | 3 | 7 |
| Cumulative incidence, % (95% CI) | 18.3 (15.5–21.6) | 15.1 (12.6–18.1) | 16.3 (13.7–19.5) | 15.7 (13.8–17.9) | 17.2 (8.1–34.4) | 12.6 (4.9–30.2) | 9.5 (3.2–26.6) | 11.0 (5.4–21.8) |
| Seronegative | n = 246 | n = 276 | n = 277 | n = 553 | n = 19 | n = 26 | n = 23 | n = 49 |
| Events, No. | 58 | 40 | 46 | 86 | 3 | 4 | 2 | 6 |
| Cumulative incidence, % (95% CI) | 24.4 (19.4–30.4) | 14.9 (11.2–19.8) | 17.2 (13.2–22.3) | 16.1 (13.2–19.5) | 16.1 (5.5–42.1) | 15.6 (6.1–36.3) | 8.9 (2.3–31.2) | 12.4 (5.8–25.6) |
| Seropositive | n = 342 | n = 331 | n = 321 | n = 652 | n = 15 | n = 4 | n = 6 | n = 10 |
| Events, No. | 49 | 52 | 46 | 98 | 3 | 0 | 0 | 0 |
| Cumulative incidence, % (95% CI) | 14.6 (11.3–18.9) | 16.0 (12.5–20.5) | 14.7 (11.2–19.2) | 15.4 (12.8–18.4) | 20.0 (6.9–50.0) | 0 | 0 | 0 |
| Sero-undetermined | n = 45 | n = 57 | n = 45 | n = 102 | n = 1 | n = 2 | n = 3 | n = 5 |
| Events, No. | 6 | 6 | 10 | 16 | 0 | 0 | 1 | 1 |
| Cumulative incidence, % (95% CI) | 13.5 (6.3–27.5) | 10.9 (5.0–22.7) | 22.6 (12.9–37.9) | 16.2 (10.2–25.0) | 0 | 0 | 33.3 (5.5–94.6) | 20.0 (3.1–79.6) |
Abbreviations: CAS + IMD, casirivimab plus imdevimab; CI, confidence interval; IV, intravenous.
Safety
No new safety concerns were observed in IC patients compared with the overall study patient population. For patients treated with CAS + IMD, those who were IC and overall study patients exhibited similar rates of TEAEs (21/69 [30.4%] vs 392/1473 [26.6%], respectively) and AESIs of grade ≥2 hypersensitivity or infusion-related reactions (1/69 [1.4%] vs 37/1473 [2.5%]) (Table 3). IC patients treated with placebo had higher rates of TEAEs than overall study patients treated with placebo (17/37 [45.9%] vs 209/730 [28.6%], respectively). Both IC and overall study patients exhibited fewer TEAEs with CAS + IMD (21/69 [30.4%] IC and 392/1473 [26.6%] overall) compared with placebo (7/37 [45.9%] IC and 209/730 [28.6%] overall). No grade ≥2 hypersensitivity reactions were reported in IC patients through day 29 (Table 3).
Overview of Treatment-Emergent Adverse Events
| Adverse Event | Overall Study Population | Immunocompromised Population | ||||||
|---|---|---|---|---|---|---|---|---|
| Placebo (n = 730) | CAS + IMD 2.4 g IV (n = 740) | CAS + IMD 8.0 g IV (n = 733) | CAS + IMD Combined Doses (n = 1473) | Placebo (n = 37) | CAS + IMD 2.4 g IV (n = 34) | CAS + IMD 8.0 g IV (n = 35) | CAS + IMD Combined Doses (n = 69) | |
| Any TEAE | 209 (28.6) | 191 (25.8) | 201 (27.4) | 392 (26.6) | 17 (45.9) | 14 (41.2) | 7 (20.0) | 21 (30.4) |
| Any treatment-emergent SAE | 203 (27.8) | 177 (23.9) | 181 (24.7) | 358 (24.3) | 17 (45.9) | 14 (41.2) | 6 (17.1) | 20 (29.0) |
| Any treatment-emergent AESIa | 8 (1.1) | 16 (2.2) | 21 (2.9) | 37 (2.5) | 0 | 1 (2.9) | 0 | 1 (1.4) |
| Any treatment-emergent AESI of infusion-related reactions (grade ≥2) through day 4 | 6 (0.8) | 11 (1.5) | 15 (2.0) | 26 (1.8) | 0 | 1 (2.9) | 0 | 1 (1.4) |
| Any treatment-emergent AESI of hypersensitivity reactions (grade ≥2) through day 4 | 0 | 2 (0.3) | 6 (0.8) | 8 (0.5) | 0 | 0 | 0 | 0 |
| Any treatment-emergent AESI of hypersensitivity reactions (grade ≥2) through day 29 | 2 (0.3) | 5 (0.7) | 7 (1.0) | 12 (0.8) | 0 | 0 | 0 | 0 |
| Any TEAE leading to death | 107 (14.7) | 90 (12.2) | 89 (12.1) | 179 (12.2) | 5 (13.5) | 3 (8.8) | 3 (8.6) | 6 (8.7) |
Data are presented as No. of patients (%).
Abbreviations: AESI, adverse event of special interest; CAS + IMD, casirivimab plus imdevimab; IV, intravenous; SAE, serious adverse event; TEAE, treatment-emergent adverse event.
Defined as grade ≥2 hypersensitivity or infusion-related reactions.
Both IC and overall study patients also exhibited fewer deaths with CAS + IMD (6/69 [8.7%] IC and 179/1437 [12.2%] overall) compared with placebo (5/37 [13.5%] IC and 107/730 [14.7%] overall). IC patients in the placebo group experienced a greater incidence of serious adverse events (17/37 [45.9%]) than IC patients in the CAS + IMD group (20/69 [29.0%]) or overall study patients in either the placebo (203/730 [27.8%]) or CAS + IMD groups (358/1473 [24.3%]) (Table 3).
DISCUSSION
Antiviral mAbs are recommended for use in IC patients to treat susceptible variants of SARS-CoV-2; however, data on the efficacy of mAbs in IC patients are limited. Because these individuals experience high morbidity and high mortality associated with COVID-19 and are often unable to mount an adequate immune response to vaccination [5–7], a better understanding of the efficacy of treatments in this population is critical. Antiviral mAbs bind to the spike protein of SARS-CoV-2 to prevent the virus from infecting host cells, thus providing immediate protection [13–15]. While no mAbs are currently approved against circulating variants, several antiviral mAbs, including CAS + IMD, were authorized for use in the management of COVID-19 at various times throughout the pandemic. CAS + IMD, as well as other anti–SARS-CoV-2 mAbs used in clinical settings, exhibit reduced neutralization with certain viral mutations known to be present in circulating viral variants, emphasizing the need for continued development of novel therapeutics as SARS-CoV-2 continues to evolve [9, 22–25].
To assess the efficacy of antiviral mAbs in IC patients, we performed a post hoc analysis of IC patients from the COV-2066 placebo-controlled clinical trial (NCT04426695) involving patients with COVID-19 who had been hospitalized and treated during a time when circulating variants of SARS-CoV-2 were susceptible to CAS + IMD [20]. In this study, CAS + IMD reduced viral load and resulted in fewer events of death or mechanical ventilation compared with placebo in IC patients, as well as in the overall study patient population, suggesting that mAbs are similarly efficacious in the IC population. Notably, for both IC patients and the overall study population, those receiving CAS + IMD compared with placebo had a lower incidence of deaths at day 29 with benefit apparent after day 10. A greater proportion of clinical events in the first few days after treatment with CAS + IMD was reported, but this was not reproducible in other analyses of hospitalized patients including the phase 2/3 COV-2066 study analysis [20] and the RECOVERY trial [19]. This lack of reproducibility of other datasets suggests that the observation of more such events in the first couple of days is likely related to random disease variability or heterogeneity of other baseline characteristics between treatment groups, especially given the small sample size in this analysis. Furthermore, the US Food and Drug Administration's guidance for industry [26] recommends that the appropriate time point for evaluation of all-cause mortality should be at least 28 days for hospitalized non–critically ill patients, which was the focus of these analyses. There were no new safety findings for CAS + IMD among IC patients compared with the overall study population.
Baseline data in this study are consistent with prior reports and demonstrated that IC patients, compared with overall study patients, were more likely to exhibit high viral loads, be seronegative for SARS-CoV antibodies, and have slower declines in nasopharyngeal swab viral load when receiving placebo. Prior studies reported that IC patients have extended lengths of viral shedding, with SARS-CoV-2 detected by qRT-PCR testing of nasopharyngeal swabs for 60 days [27] or as long as 100 days after initial symptom onset, at which time some IC patients were found to still have live replicating virus [28]. Because IC patients have prolonged shedding of replication-competent SARS-CoV-2, there has been a concern that these patients may contribute to disease transmission, and also to viral evolution as the virus continues to replicate in the absence of immune pressure [29]. Depending on the availability of mAbs that are effective against dominant circulating strains, a combination of 2 mAbs may be advantageous to further limit viral evolution and escape, which could lead to drug resistance.
A limitation of this post hoc analysis was the timing of the clinical trial from June 2020 to April 2021, which was prior to widespread use of SARS-CoV-2 vaccination and included predominantly the Alpha variant, but not the Delta variant (against which CAS + IMD retains efficacy) or Omicron-lineage variants (against which CAS + IMD exhibits reduced activity). Furthermore, this analysis included very few patients in cohorts 2 and 3, as enrollment into these cohorts was paused during the conduct of the study. Accordingly, it is not possible to draw meaningful comparisons between IC patients requiring low-flow or no supplemental oxygen (cohorts 1A and 1) versus those requiring high-intensity oxygen or mechanical ventilation (cohorts 2 and 3). At the time of this study, the overall study population exhibited a 51.2% rate of being seropositive for SARS-CoV-2 antibodies, which is lower than the current rates of seropositivity, estimated to be 91.5% for US adults due to infection and/or vaccination [30]. However, the IC population exhibited both lower rates of seropositivity at 25.3% and a lesser presence of neutralizing antibodies within patients who were seropositive, which is a persistent issue faced by these patients to date [31]. Additional limitations include the small sample size for the IC subset, and the IC patient population being limited to those who were hospitalized. A higher proportion of IC patients than overall study patients was enrolled into cohort 1A (hospitalized without the need for supplemental oxygen), potentially because physicians opted to hospitalize these patients earlier in the course of the disease to monitor them more closely for progression to severe COVID-19. Given that CAS + IMD was previously authorized for use in outpatients but not hospitalized patients, we recognize that these real-world differences in hospitalization patterns of IC patients could have impacted their access to treatment and that data presented here support treating these patients regardless of their hospital admission status.
Overall, this study confirms prior reports of slower viral load declines in IC patients and provides evidence for the safety and efficacy of mAbs in IC patients infected with susceptible variants of SARS-CoV-2. Further studies are needed to examine the efficacy and safety of CAS + IMD and other mAbs in IC patients on a larger scale.
Supplementary Data
Supplementary materials are available at Open Forum Infectious Diseases online. Consisting of data provided by the authors to benefit the reader, the posted materials are not copyedited and are the sole responsibility of the authors, so questions or comments should be addressed to the corresponding author.
Notes
Author contributions. S. S.-K., J. M., E. O.-O., M. P. O., V. M. C., R. B., and G. A. H. curated and interpreted the data. J. M. and R. B. conducted the statistical analysis and validation of the data. E. M. and F. M. M. served as investigators. J. M., A. T. H., R. B., and J. D. H. were involved in the study methodology. S. S.-K., J. M., E. O.-O., M. P. O., V. M. C., F. M. M., E. F.-N., R. B., G. A. H., B. H., and D. M. W. contributed to study conceptualization. A. M., E. F.-N., R. B., J. D. H., G. A. H., B. H., and D. M. W. provided supervision. S. S.-K., E. M., J. M., E. O.-O., M. P. O., and V. M. C. worked collaboratively on the original draft of the manuscript. All authors provided critical revision of the manuscript and approval to submit the manuscript for publication.
Acknowledgments. We thank the patients who participated in this study, as well as their families; the study investigators and staff; the members of the independent data monitoring committee; Kaitlyn Scacalossi, PhD, and Brian Head, PhD, from Regeneron Pharmaceuticals for assistance with development of the manuscript; and Prime, Knutsford, UK, for formatting and copyediting suggestions.
Data availability. Qualified researchers may request access to study documents (including the clinical study report, study protocol with any amendments, blank case report form, and statistical analysis plan) that support the methods and findings reported in this manuscript. Individual anonymized participant data will be considered for sharing once the product and indication has been approved by major health authorities (eg, US Food and Drug Administration, European Medicines Agency, Pharmaceuticals and Medical Devices Agency), if there is legal authority to share the data and there is not a reasonable likelihood of participant re-identification. Requests should be submitted to https://vivli.org/.
Financial support. This work was supported by Regeneron Pharmaceuticals, Inc. Certain aspects of this project were supported by federal funds from the Department of Health and Human Services, Office of the Assistant Secretary for Preparedness and Response, and the Biomedical Advanced Research and Development Authority (BARDA), under Other Transaction number HHSO100201700020C.
References
Author notes
Included posthumously.
Potential conflicts of interest. S. S.-K., J. M., V. M. C., A. M., M. H., S. A., R. B., and B. H. are employees/stockholders of Regeneron Pharmaceuticals, and report grants from BARDA. E. M. reports payments to his institution received from the National Institute of Allergy and Infectious Diseases/National Institutes of Health (NIH), National Institute of General Medical Sciences/NIH, SciClone Pharmaceuticals, Regeneron Pharmaceuticals, Pfizer, Chemic Labs/KODA Therapeutics, Cidara, and Leidos Biomedical Research Inc/National Cancer Institute. E. O.-O. was an employee of and holds stocks and shares in Regeneron Pharmaceuticals, and reports grants from BARDA. M. P. O. and G. A. H. are employees/stockholders of Regeneron Pharmaceuticals and report having a patent pending, which has been licensed and receiving royalties, with Regeneron Pharmaceuticals, as well as a pending patent application; and report grants from BARDA. A. T. H. is an employee/stockholder of Regeneron Pharmaceuticals, a former Pfizer employee and current stockholder, has a patent pending with Regeneron Pharmaceuticals, and reports grants from BARDA. F. M. M. reports payments to his institution received from Regeneron Pharmaceuticals, F2G, Gilead, Merck, Shire, Syneos, and the Bill & Melinda Gates Foundation; reports grants or contracts from Ansun, Chimerix, Cidara, Scynexis, Shire (a Takeda company), WHISCON, AlloVir, Amplyx, F2G, Gilead, and Merck; reports consulting fees from AlloVir, Amplyx, Avir, Emcure, F2G, Gilead, Janssen, Kyorin, Merck, Regeneron, ReViral, Symbio, United Medical, ADMA Biologics, Astellas, Behring, Cidara, Octapharma, Partner Therapeutics, Shionogi, Shire (a Takeda company), and Siemens Healthineers; reports payment for honoraria from Basilea, Merck, and Merck Sharp & Dohme Europe; and reports grants from BARDA. E. F.-N. was an employee of and holds stocks and shares in Regeneron Pharmaceuticals and reports having a patent pending, which has been licensed and receiving royalties from Regeneron Pharmaceuticals, as well as a pending patent application; and reports grants from BARDA. J. D. H. is an employee/stockholder of Regeneron Pharmaceuticals and has a patent pending, which has been licensed and receiving royalties, with Regeneron Pharmaceuticals. D. M. W. was an employee of and holds stocks and shares in Regeneron Pharmaceuticals and reports having a pending patent application; and reports grants from BARDA.


Comments