


Abstract
Invasive Escherichia coli disease (IED), including bloodstream infection, sepsis, and septic shock, can lead to high hospitalization and mortality rates. This multinational study describes the clinical profile of patients with IED in tertiary care hospitals.
We applied clinical criteria of systemic inflammatory response syndrome (SIRS), sepsis, or septic shock to patients hospitalized with culture-confirmed E coli from urine or a presumed sterile site. We assessed a proposed clinical case definition against physician diagnoses.
Most patients with IED (N = 902) were adults aged ≥60 years (76.5%); 51.9%, 25.1%, and 23.0% of cases were community-acquired (CA), hospital-acquired (HA), and healthcare-associated (HCA), respectively. The urinary tract was the most common source of infection (52.3%). Systemic inflammatory response syndrome, sepsis, and septic shock were identified in 77.4%, 65.3%, and 14.1% of patients, respectively. Patients >60 years were more likely to exhibit organ dysfunction than those ≤60 years; this trend was not observed for SIRS. The case-fatality rate (CFR) was 20.0% (60–75 years, 21.5%; ≥75 years, 22.2%), with an increase across IED acquisition settings (HA, 28.3%; HCA, 21.7%; CA, 15.2%). Noticeably, 77.8% of patients initiated antibiotic use on the day of culture sample collection. A total of 65.6% and 40.8% of E coli isolates were resistant to ≥1 agent in ≥1 or ≥2 drug class(es). A 96.1% agreement was seen between the proposed clinical case definition and physician's diagnoses of IED.
This study contributes valuable, real-world data about IED severity. An accepted case definition could promote timely and accurate diagnosis of IED and inform the development of novel preventative strategies.
Extraintestinal pathogenic Escherichia coli (ExPEC) comprises a pathogenic group of strains possessing the ability to colonize and infect extraintestinal sites. Extraintestinal pathogenic E coli can cause cholecystitis, pyelonephritis, and urinary tract infections (UTIs) [1]. When ExPEC causes systemic infections [2,3], it is termed invasive E coli disease (IED), also known as invasive ExPEC disease [4]. Invasive E coli disease encompasses infections of the bloodstream and other normally sterile body sites (eg, cerebrospinal fluid, pleural cavity, peritoneal space, bone, and joints) [3] as well as infections with E coli isolated from urine in patients with urosepsis with no other identifiable source of infection [5]. Invasive E coli disease may result in sepsis, septic shock, or death [6,7].
Extraintestinal pathogenic E coli surpasses pathogens such as Staphylococcus aureus, Streptococcus pneumoniae, and Klebsiella species as the leading cause of invasive bacterial disease worldwide [8]. A recent study conducted in Spanish hospitals identified E coli as the most frequent pathogen accounting for more than 40% of bloodstream infection episodes [9]. A global analysis of adult E coli bacteremia incidence in high-income countries estimated an incidence rate of 48 per 100 000 person-years and a case-fatality rate (CFR) of 12.4% [10]. An increasing incidence after the age of 60 was reported, reaching 319 per 100 000 person-years after the age 85 [10]. In 2017, 11 million people died of sepsis from an estimated 48.9 million cases worldwide [11]. Sepsis, listed as the most expensive condition to treat in US hospitals in 2013, results in aggregate hospital costs exceeding $20 billion [12]. Antimicrobial resistance in ExPEC, exemplified by cephalosporin resistance mediated by extended-spectrum β-lactamase-producing E coli, is a major threat to successful treatment [13].
Early identification of sepsis and appropriate antimicrobial therapy is essential to prevent progression to septic shock, multiorgan failure, and death. However, effective treatment may be delayed by incorrect diagnosis or insufficient knowledge of the causative pathogen. In an attempt to develop protocol-driven models for sepsis care, sepsis has been defined according to a set of clinical criteria [7]. However, multiple iterations of clinical criteria compounded the development of standardized care protocols and accurate disease tracking [7]. Similarly, there are no widely accepted criteria to define IED. Thorough clinical characterization and estimation of the disease burden are needed.
This study aimed to assess the clinical features of IED, the antimicrobial resistance of E coli isolates causing IED, and the associated medical resource utilization in patients with IED admitted to tertiary care hospitals. In addition, the clinical criteria for IED diagnosis used by physicians at each study site was compared with a proposed clinical case definition (Box 1).
| Any patient with microbiological confirmation of Escherichia coli in any sterile site, including blood as measured by culture, and/or in urine (≥105 colony-forming units/mL) with no other identifiable site of infection, |
| AND |
| the presence of 1 or more SIRS criteria (ie, fever, tachycardia, white cell count abnormalities, and tachypnea), sepsis (organ failure/dysfunction with an acute change in total SOFA score ≥2 points), or septic shock (sepsis and refractory hypotension) consequent to the infection, |
| OR fever >38°C |
| OR hypothermia: < 36°C |
| OR at least 2 of the following clinical criteria: |
| • Tachycardia: > 90 beats/minute. |
| • Tachypnea: > 20 breaths/minute or PaCO2 <32 mmHg. |
| • Nausea and/or vomiting. |
| • General symptoms (malaise, fatigue, muscle pain, chills). |
| • Altered mentation (Glasgow Coma Scale score <15). |
| • Systolic blood pressure ≤100 mmHg. |
| • Any laboratory values indicating an important bacterial infection and/or sepsis, including, but not limited to, white blood cell count or immature bands, eg, platelets, prothrombin time, activated partial thromboplastin time, bilirubin, creatinine. |
| • Signs and/or symptoms of UTI, eg, dysuria, flank pain, suprapubic pain, urgency, frequency, hematuria, pyuria. |
Better understanding of IED in terms of high-risk patient groups and associated clinical profiles could assist physicians in making timely and accurate diagnoses. The current data may have utility (1) to inform further development of IED treatment and management protocols and (2) to evaluate the suitability of new treatment and vaccine candidates in the clinical trial setting.
METHODS
Study Design and Participants
This study was a retrospective, multicenter, noninterventional cohort study. Medical records from 17 tertiary care hospitals were evaluated covering geographical sites in Canada (2 sites), United States (2 sites), Japan (2 sites), France (2 sites), Germany (2 sites), Italy (2 sites), United Kingdom (2 sites), and Spain (3 sites). Sites were selected based on availability to retrospectively access demographic and clinical data. Eligible patients were identified from microbiological and medical records or administrative databases by local physicians using International Classification of Diseases (ICD) codes (Supplementary Table 1). Patient records were examined for relevant ICD codes for 12 months before the study commencement date. Data collection started on September 28, 2018 and included data from January 9, 2018 to November 8, 2019. Patients were included if they had been hospitalized for IED or had had hospital-acquired IED, where E coli had been identified as the single causative pathogen or had been one of multiple pathogens present; and if they had culture confirmation of E coli and had presented signs and symptoms of an invasive infection based on the development of systemic inflammatory response syndrome (SIRS), sepsis, or septic shock consequent to the infection. Sites were required to have an E coli isolate available for analysis for all patients included. Participants with E coli isolates lost or not confirmed in the central laboratory were discontinued from the study.
Patient Consent Statement
This study was approved by the Independent Ethics Committee and/or Institutional Review Boards. Physicians sought waivers and/or consent from eligible patients for inclusion of their data into the study according to local regulations. A waiver for informed consent was obtained for Canada, United Kingdom, and United States. In Germany, all patients signed a participation agreement/informed consent form (ICF)/informed assent form (IAF); and for deceased patients, a participation agreement/ICF/IAF was signed by the patient's next of kin. In Spain and Italy, attempts to contact the patients were made, but waivers were obtained if it was too difficult to contact the patient. In France, letters of nonobjection were sent to the patients, which explained that the patients were included without consent if no objection was made. In Spain, France, and Italy, no consent was required for deceased patients. In Japan, no consent was required but patients were given an opportunity to refuse study participation.
Data Collection
The primary data source was medical records. Available information on patient demographic characteristics, IED risk-related medical history (Supplementary Table 2), treatment, antimicrobial resistance of causative E coli isolates, clinical outcome, and medical resource utilization was collected. Data on prior immunosuppressive therapy were collected within 90 days before IED diagnosis. Bacteremic (positive E coli culture in blood) and nonbacteremic cases were identified. The source of infection (presence of an infection focus within 30 days before IED), the diagnosis of sepsis, and septic shock were determined by the study site physician. The IED episodes were also categorized as community-acquired (CA), hospital-acquired (HA), or healthcare-associated (HCA) by the study site physician [14,15].
Resistance to a drug class was defined as resistance to ≥1 agent(s) within that class. Antimicrobial resistance testing was performed according to the broth microdilution assay as per Clinical and Laboratory Standards Institute (CLSI) Guidelines with interpretations regarding susceptibility or resistance reported according to CLSI and European Committee on Antimicrobial Susceptibility Testing (EUCAST)-established breakpoints, as appropriate.
Medical resource utilization assessed the number of medical care encounters (any interaction between the patient and healthcare provider(s) at the time of IED diagnosis and 28 days after diagnosis) to gauge the health status and the IED-related provision of healthcare services.
Clinical Case Definition of Invasive Escherichia coli Disease
The proposed protocol-defined clinical definition of IED refers to an acute illness consistent with a systemic bacterial infection, microbiologically confirmed (1) by the isolation and identification of E coli either from blood or any other normally sterile body site or (2) by the isolation and identification of E coli from urine upon presentation of acute signs and symptoms of systemic infection (SIRS, sepsis, or septic shock) (Box 1) with no other identifiable site of infection. This definition is based on the case definition of invasive bacterial disease from the Active Bacterial Core Surveillance, a collaboration between the Centers for Disease Control and Prevention, and several state health departments and universities participating in the Emerging Infections Program network in the United States [2].
The occurrence of SIRS was assessed retrospectively using an algorithm that identified SIRS in patients fulfilling at least 2 of the following clinical criteria: fever, tachycardia, tachypnea, or white cell count abnormalities. Sepsis was assessed retrospectively by the study statistician using a Sequential Organ Failure Assessment (SOFA) score of ≥2. Septic shock was defined as sepsis with refractory hypotension. The concordance between physician-diagnosed IED and IED based on the proposed clinical case definition (Box 1) was assessed.
Statistical Analyses
All analyses were based on the full analysis set (FAS) of eligible patients who met all selection criteria and had data available. Continuous variables and categorical variables were summarized by descriptive statistics. Analyses were retrospective. No formal statistical hypothesis testing was used, and no P values were calculated.
RESULTS
Patient Population
Of 924 patients with IED identified, 902 were included in the FAS; 22 were excluded based on the absence of IED culture confirmation (n = 10), the lack of IED diagnosis in the last 12 months (n = 5), the lack of hospitalization for IED/diagnosis for nosocomial IED (n = 4), failure to meet multiple inclusion criteria (n = 2), and inability to acquire an informed consent (n = 1). Males and females were approximately equally distributed (Table 1). The median age at IED diagnosis was 71.0 years (range, 0–100 years), 76.5% were aged ≥60 years, and 90.1% lived at home. Invasive E coli disease episodes were CA in 51.9% of patients (468 of 901), HA in 25.1% (226 of 901), and HCA in 23.0% (207 of 901). The most commonly reported medical history terms were malignancy (34.1%), diabetes mellitus (19.1%), chronic kidney disease (14.4%), and UTI (12.3%). Among patients with UTI with known causal agent, 74.5% were due to E coli. Patients with community-acquired IED had higher rates of diabetes mellitus (CA, 23.0%; HA, 15.6%; HCA, 14.9%), whereas those with hospital-acquired or healthcare-associated IED had higher rates of cancer (CA, 25.0%; HA, 50.0%; HCA, 36.0%). A history of UTI was frequent among patients with CA (17.8%) and HCA IED (11.8), but it was rare among those with hospital-acquired IED (1.9%). Overall, 54.3% of patients underwent a diagnostic or interventional medical procedure in the previous 12 months; 41.8% (205 of 490) were related to the gastrointestinal tract, 39.6% (194 of 490) were related to the genitourinary tract, and 22.2% (109 of 490) were related to the cardiovascular system (Supplementary Table 3). In the 3 months before the IED episode, 228 patients (25.3%) had received immunosuppressive therapy (Table 1), with immunosuppressive therapy use more common among those with hospital-acquired or healthcare-associated IED (community-acquired, 18.4%; hospital-acquired, 32.3%; healthcare-associated, 33.3%). Before IED culture sample collection, 31.8% of patients used antibiotics.
Patient Demographic and Baseline Characteristics of 902 Patients With Invasive Escherichia coli Disease at the Time of Diagnosis
| Characteristic | Patients With IED | Community-Acquired | Hospital-Acquired | Healthcare-Associated | |
|---|---|---|---|---|---|
| N = 902 | N = 468 | N = 226 | N = 207 | ||
| Sex | Male | 465 (51.6) | 216 (46.2) | 136 (60.2) | 113 (54.6) |
| … | Female | 437 (48.4) | 252 (53.8) | 90 (39.8) | 94 (45.4) |
| Age | Median (range) | 71.0 (0–100) | 73.0 (2–100) | 70.0 (7–99) | 71.0 (3–99) |
| … | Mean (SD) | 69.1 (17.2) | 70.6 (17.31) | 67.2 (16.21) | 68.3 (17.25) |
| Age category | <18 yearsa | 12 (1.3) | 4 (0.4) | 3 (1.3) | 4 (1.9) |
| … | 18–60 years | 211 (23.5) | 105 (22.4) | 63 (27.9) | 43 (20.8) |
| … | 61–75 years | 325 (36.0) | 147 (31.4) | 93 (41.2) | 85 (41.1) |
| … | >75 years | 354 (39.2) | 212 (45.3) | 67 (29.6) | 75 (36.2) |
| … | ≥60 years | 690 (76.5) | 363 (77.6) | 165 (73.0) | 162 (78.3) |
| Race (N = 288) | American Indian or Alaskan Native | 16 (5.6) | 9 (5.4) | 6 (10.3) | 1 (1.6) |
| … | Asian | 100 (34.7) | 55 (32.7) | 31 (53.4) | 14 (22.6) |
| … | Black or African American | 41 (14.2) | 26 (15.5) | 7 (12.1) | 8 (12.9) |
| … | White | 131 (45.5) | 78 (46.4) | 14 (24.1) | 39 (62.9) |
| Body mass index (kg/m2) | Mean (SD) | 26.0 (7.36) | 26.82 (8.09) | 24.70 (5.65) | 25.74 (7.32) |
| Residential status (N = 848) | Lives at home | 764 (90.1) | 412 (94.3) | 197 (94.3) | 155 (76.7) |
| … | Sheltered housing | 6 (0.7) | 3 (0.7) | 1 (0.5) | 2 (1.0) |
| … | Nursing home/assisted living facilities | 78 (9.2) | 22 (5.0) | 11 (5.3) | 45 (22.3) |
| Medical historyb (N = 619) | Malignancy | 211 (34.1) | 76 (25.0) | 77 (50.0) | 58 (36.0) |
| … | Diabetes mellitus | 118 (19.1) | 70 (23.0) | 24 (15.6) | 24 (14.9) |
| … | Chronic kidney disease | 89 (14.4) | 51 (16.8) | 17 (11.0) | 21 (13.0) |
| … | Any UTIc | 76 (12.3) | 54 (17.8) | 3 (1.9) | 19 (11.8) |
| … | Urological intervention including catheterization | 73 (11.8) | 32 (10.5) | 19 (12.3) | 22 (13.7) |
| … | Immunosuppression | 57 (9.2) | 21 (6.9) | 25 (16.2) | 11 (6.8) |
| … | Cardiovascular disease | 48 (7.8) | 23 (7.6) | 11 (7.1) | 14 (8.7) |
| … | Urolithiasis | 38 (6.1) | 23 (7.6) | 3 (1.9) | 12 (7.5) |
| … | Obstructive uropathy | 36 (5.8) | 23 (7.6) | 3 (1.9) | 10 (6.2) |
| … | Organ transplantation | 34 (5.5) | 16 (5.3) | 6 (3.9) | 12 (7.5) |
| … | Cerebrovascular accident | 33 (5.3) | 17 (5.6) | 12 (7.8) | 4 (2.5) |
| … | Dementia | 31 (5.0) | 17 (5.6) | 4 (2.6) | 10 (6.2) |
| Prior medical encounterd | All | 453 (50.2) | … | … | … |
| … | Emergency room | 115 (25.4) | … | … | … |
| … | Intensive care unit | 15 (3.3) | … | … | … |
| … | Other high dependency/critical care unit | 4 (0.9) | … | … | … |
| … | Home care | 8 (1.8) | … | … | … |
| … | Hospice/palliative care unit | 4 (0.9) | … | … | … |
| … | Hospital inpatient | 189 (41.7) | … | … | … |
| Immunosuppressive drugs in the previous 3 months | Any immunosuppressive therapy | 228 (25.3) | 86 (18.4) | 73 (32.3) | 69 (33.3) |
| … | Steroids | 138 (60.5) | 50 (58.1) | 50 (68.5) | 38 (55.1) |
| Anti-neoplastic treatments | 110 (48.2) | 26 (30.2) | 46 (63.0) | 38 (55.1) | |
| Radiation therapy | 6 (2.6) | 2 (2.3) | 2 (2.7) | 2 (2.9) | |
| Cytotoxic drugs | 27 (11.8) | 11 (12.8) | 12 (16.4) | 4 (5.8) | |
| Other | 55 (24.1) | 26 (30.2) | 13 (17.8) | 16 (23.2) |
Abbreviations: IED, invasive E coli disease; n (%), number (percentage) of patients with the defined characteristic; N, number of patients for which information was available, used as the denominator for incidence calculations; SD, standard deviation; UTI, urinary tract infection.
Data are n (%). Denominator is the number of patients with no missing value for each category, which does not include “unknown”, “not reported”, or “not applicable”.
Infection acquisition setting for 1 patient <18 years of age was unavailable.
Reported by at least 5% of patients in the full analysis set.
38 of 51 (74.5%) with causative bacteria isolated were due to E coli.
Data unavailable for infection acquisition setting groups.
Characterization, Clinical Profile, and Outcomes of Invasive Escherichia coli Disease Episodes
The most common source of infection was the urinary tract (52.3%, 469 of 897; community-acquired, 55.8%; hospital-acquired, 38.1%; healthcare-associated, 58.9%). The gastrointestinal tract was also a common source of infection for those with hospital-acquired IED (32.7%). Escherichia coli was identified as the only causal pathogen in 89.5% (804 of 898) of cases and was one of multiple causes in the remainder. Escherichia coli was isolated from blood and/or urine in the majority of IED episodes across infection acquisition setting (94.3%; 850 of 901) (Table 2). The proportion of cases with bacteremic IED was 93.6% (CA, 93.8%; HA, 92.0%; HCA, 94.7%) (Table 2). At the time of the diagnosis of IED, 96.8% of patients (873 of 902) reported at least 1 symptom or suspected sign of IED, including fever (70.3%, 634 of 902), nausea/vomiting (30.8%, 269 of 902), chills (24.4%, 213 of 902), and malaise (20.2%, 176 of 902) (Table 2). At least 1 symptom or sign of UTI was reported by 40.1% of patients (dysuria, 32.3% [117 of 362]; flank pain/tenderness, 22.7% [82 of 362]; hematuria, 17.4% [63 of 362]; urgency/frequency, 15.5% [56 of 362]). According to physician assessment, 65.3% of patients with IED had sepsis, and 14.1% had septic shock (Table 2). A total of 77.4% of patients were diagnosed with SIRS. Of patients with bacteremic versus nonbacteremic IED, 78.8% and 56.9% had SIRS, respectively. The presence of SIRS remained high irrespective of infection acquisition setting and age (range, 73.0%–83.3%). A SOFA score ≥2 (indicative of sepsis) was observed in 62.1% (396 of 638) of patients. A SOFA score ≥2 AND ≥2 SIRS criteria were observed in 35.1% (317 of 902) of patients (Supplementary Table 4), whereas SOFA scores ≥2 OR ≥2 SIRS criteria were observed in 86.1% (777 of 902) of patients.
Clinical Characteristics of 902 Patients Hospitalized for Invasive Escherichia coli Disease
| Characteristic | Subcharacteristic | Patients With IED | Community-Acquired | Hospital-Acquired | Healthcare-Associated |
|---|---|---|---|---|---|
| N = 902 | N = 468 | N = 226 | N = 207 | ||
| Classification of IED (N = 902) | Bacteremic | 844 (93.6) | 439 (93.8) | 208 (92.0) | 196 (94.7) |
| … | Nonbacteremic | 58 (6.4) | 29 (6.2) | 18 (8.0) | 11 (5.3) |
| Source of infection identified (N = 897) | Urinary tract | 469 (52.3) | 261 (55.8) | 86 (38.1) | 122 (58.9) |
| … | Respiratory tract | 73 (8.1) | 34 (7.3) | 29 (12.8) | 10 (4.8) |
| … | Gastrointestinal tract | 237 (26.4) | 112 (23.9) | 74 (32.7) | 51 (24.6) |
| … | Other organ system | 118 (13.2) | 59 (12.6) | 36 (15.9) | 23 (11.1) |
| Source of isolate (N = 901) | Blood | 702 (77.9) | 355 (75.9) | 181 (80.1) | 166 (80.2) |
| … | Urine | 36 (4.0) | 16 (3.4) | 12 (5.3) | 8 (3.9) |
| … | Blood and urine | 148 (16.4) | 90 (19.2) | 27 (11.9) | 31 (15.0) |
| … | Other normally sterile body site | 15 (1.7) | 7 (1.5) | 6 (2.7) | 2 (1.0) |
| Pathogen isolateda (N = 898b) | E coli only | 804 (89.5) | … | … | … |
| … | Multiple pathogens including E coli | 94 (10.5) | … | … | … |
| Concomitant therapy required | … | 725 (80.5) | 372 (79.5) | 179 (79.2) | 174 (84.1) |
| Signs and symptoms at IED diagnosis | Fever (>38°C) | 634 (70.3) | 323 (69.0) | 166 (73.5) | 145 (70.0) |
| Nausea/vomiting | 245 (27.2) | 153 (32.7) | 38 (16.9) | 54 (26.1) | |
| … | General symptoms (chills, malaise, fatigue, muscle pain) | 412 (45.8) | 223 (47.6) | 91 (40.4) | 98 (47.8) |
| … | Signs or symptoms of UTI | 326 (36.1) | 188 (40.2) | 54 (23.9) | 84 (40.6) |
| … | Altered mental state | 154 (17.2) | 83 (17.8) | 28 (12.6) | 43 (21.2) |
| … | Hypotension | 290 (32.2) | 147 (31.4) | 72 (32.0) | 71 (34.3) |
| … | Hypothermia | 48 (5.3) | … | … | … |
| … | SIRS | 698 (77.4) | 362 (77.4) | 172 (76.1) | 164 (79.2) |
| … | Sepsis (physician assessment) | 588 (65.3) | 294 (63.0) | 146 (64.6) | 148 (71.5) |
| … | Septic shock (physician assessment) | 127 (14.1) | 65 (13.9) | 30 (13.3) | 32 (15.5) |
| Complicationsa | Any | 344 (38.1) | … | … | … |
| … | Kidney dysfunction | 139 (40.4) | … | … | … |
| … | Hypotension | 124 (36.0) | … | … | … |
| … | Brain dysfunction | 27 (7.8) | … | … | … |
| … | Heart dysfunction | 27 (7.8) | … | … | … |
| … | Lung dysfunction | 26 (7.6) | … | … | … |
| … | Pneumonia | 13 (3.8) | … | … | … |
| … | Other | 114 (33.1) | … | … | … |
| Duration of IED hospitalization (days), mean (SD) | N | 900 | 467 | 226 | 207 |
| … | All | 21.0 (26.9) | 13.96 (15.16) | 42.32 (39.10) | 13.80 (17.34) |
| … | <18 yearsa | 24.0 (33.2) | … | … | … |
| … | 18–59 yearsa | 19.6 (23.6) | … | … | … |
| … | 60–74 yearsa | 22.3 (28.4) | … | … | … |
| … | ≥60 yearsa | 21.4 (27.7) | … | … | … |
| … | ≥75 yearsa | 20.6 (27.1) | … | … | … |
| Duration of hospitalization (days), median (Q1, Q3) | … | 11.0 (6.0, 24.0) | 9.0 (5.0, 16.0) | 29.0 (17.0, 54.0) | 8.0 (6.0, 16.0) |
| Required hospital readmission within 30 days after IED | … | 105 (11.9) | 54 (11.5) | 25 (11.1) | 26 (12.6) |
| Duration of IED hospital readmission (days), mean (SD) | … | 12.9 (12.6) | 10.54 (11.83) | 14.76 (14.21) | 15.31 (12.49) |
| SIRS criteria | Temperature <36°C (96.8°F) or >38°C (100.4°F) | 676 (74.9) | 344 (73.5) | 173 (76.5) | 159 (76.8) |
| … | Heart rate >90 beats/minute | 602 (66.8) | 316 (67.7) | 142 (62.8) | 144 (69.6) |
| … | Respiratory rate >20 breaths/minute or PaCO2 <32 mmHg | 335 (37.5) | 197 (42.2) | 64 (28.4) | 73 (36.3) |
| … | White blood cell count <4 × 10⁹/L (<4000/mm³), >12 × 109/L (>12 000/mm³) | 460 (57.6) | 219 (53.2) | 131 (66.8) | 110 (58.2) |
| … | … | … | … | … | … |
| SOFA | No. of patients with SOFA | 638 | 352 | 169 | 117 |
| … | SOFA, mean (SD) | 2.9 (2.86) | 2.83 (2.85) | 3.03 (2.94) | 3.03 (2.78) |
| Respiration (PaO2/FiO2 in mmHg [or kPa]) | N | 467 | 292 | 112 | 63 |
| … | 0: ≥ 400 (53.3) | 367 (78.6) | 236 (80.8) | 88 (78.6) | 43 (68.3) |
| … | 1: < 400 (53.3) | 53 (11.3) | 30 (10.3) | 12 (10.7) | 11 (17.5) |
| … | 2: < 300 (40) | 30 (6.4) | 18 (6.2) | 7 (6.3) | 5 (7.9) |
| … | 3: < 200 (26.7) with respiratory support | 14 (3.0) | 6 (2.1) | 5 (4.5) | 3 (4.8) |
| … | 4: < 100 (13.3) with respiratory support | 3 (0.6) | 2 (0.7) | 0 | 1 (1.6) |
| Coagulation (platelets count, 103/µL) | … | 632 | 351 | 166 | 115 |
| … | 0: ≥ 150 | 422 (66.8) | 253 (72.1) | 92 (55.4) | 77 (67.0) |
| … | 1: < 150 | 77 (12.2) | 40 (11.4) | 24 (14.5) | 13 (11.3) |
| … | 2: < 100 | 57 (9.0) | 33 (9.4) | 12 (7.2) | 12 (10.4) |
| … | 3: < 50 | 35 (5.5) | 16 (4.6) | 12 (7.2) | 7 (6.1) |
| … | 4: < 20 | 41 (6.5) | 9 (2.6) | 26 (15.7) | 6 (5.2) |
| Liver (bilirubin in mg/dL [or µmol/L]) | … | 604 | 344 | 155 | 105 |
| … | 0: < 1.2 (20) | 420 (69.5) | 217 (63.1) | 115 (74.2) | 88 (83.8) |
| … | 1: 1.2–1.9 (20–32) | 86 (14.2) | 60 (17.4) | 17 (11.0) | 9 (8.6) |
| … | 2: 2.0–5.9 (33–101) | 71 (11.8) | 47 (13.7) | 17 (11.0) | 7 (6.7) |
| … | 3: 6.0–11.9 (102–204) | 17 (2.8) | 14 (4.1) | 3 (1.9) | 0 |
| … | 4: > 12.0 (204) | 10 (1.7) | 6 (1.7) | 3 (1.9) | 1 (1.0) |
| Cardiovascular (MAP in mmHg) | … | 560 | 327 | 146 | 87 |
| … | 0: MAP ≥70 mmHg | 405 (72.3) | 257 (78.6) | 98 (67.1) | 50 (57.5) |
| … | 1: MAP <70 mmHg | 104 (72.3) | 43 (13.1) | 36 (24.7) | 25 (28.7) |
| … | 2: Dopamine <5 or dobutamine (any dose) | 14 (2.5) | 8 (2.4) | 4 (2.7) | 2 (2.3) |
| … | 3: Dopamine 5.1–15 or epinephrine ≤ 0.1 or norepinephrine ≤ 0.1 | 18 (3.2) | 9 (2.8) | 6 (4.1) | 3 (3.4) |
| … | 4: Dopamine > 15 or epinephrine > 0.1 or norepinephrine > 0.1 | 19 (3.4) | 10 (3.1) | 2 (1.4) | 7 (8.0) |
| Central nervous system (Glasgow Coma Scale) | … | 510 | 312 | 126 | 72 |
| … | 0: 15 | 408 (80.0) | 258 (82.7) | 104 (82.5) | 46 (63.9) |
| … | 1: 13–14 | 61 (12.0) | 37 (11.9) | 8 (6.3) | 16 (22.2) |
| … | 2: 10–12 | 20 (3.9) | 9 (2.9) | 3 (2.4) | 8 (11.1) |
| … | 3: 6–9 | 10 (2.0) | 4 (1.3) | 5 (4.0) | 1 (1.4) |
| … | 4: < 6 | 11 (2.2) | 4 (1.3) | 6 (4.8) | 1 (1.4) |
| Renal (creatinine in mg/dL [nmol/L]) | … | 628 | 349 | 164 | 115 |
| … | 0: < 1.2 (110) | 334 (53.2) | 169 (48.4) | 112 (68.3) | 53 (46.1) |
| … | 1: 1.2–1.9 (110–170) | 178 (28.3) | 114 (32.7) | 30 (18.3) | 34 (29.6) |
| … | 2: 2.0–3.4 (171–299) | 70 (11.1) | 42 (12.0) | 12 (7.3) | 16 (13.9) |
| … | 3: 3.5–4.9 (300–440) | 22 (3.5) | 9 (2.6) | 6 (3.7) | 7 (6.1) |
| … | 4: > 5.0 (440) | 24 (3.8) | 15 (4.3) | 4 (2.4) | 5 (4.3) |
Abbreviations: IED, invasive E coli disease; MAP, mean arterial pressure; n (%), number (percentage) of patients with the defined characteristic; N, number of patients for which information was available, used as the denominator for incidence calculations; SD, standard deviation; SIRS, systemic inflammatory response syndrome; SOFA, Sequential Organ Failure Assessment; UTI, urinary tract infection.
NOTE: Data are n (%). Denominator is the number of patients with no missing value for each category, which does not include “unknown”, “not reported”, or “not applicable”.
Data unavailable for infection acquisition setting groups
Isolates from 898 of 902 participants available for central laboratory analysis
Data unavailable for infection acquisition setting groups.
Patients >60 years old were more likely to exhibit altered mentation (>60 years, 20.8% [140 of 674]; ≤60 years, 6.4% [14 of 220]), organ dysfunction (SOFA score ≥2: >60 years, 65.2% [317 of 486]; ≤60 years, 52.0% [79 of 152]), and septic shock (>60 years, 15.7% [105 of 679]; ≤60 years, 9.9% [22 of 223]). In contrast, 76.0% (516 of 679) of patients >60 years and 81.6% (182 of 223) of patients ≤60 years had SIRS.
The IED-related complications were reported for 38.1% of patients (344 of 902) and included renal, brain, heart or lung dysfunction, hypotension, hypoperfusion, and pneumonia. There were 180 patients (20.0%) who died during the 28-day follow-up period. The CFR was 22.6% in men and 17.2% in women. The CFR increased with age and plateaued after the age of 60. The CFR was 0% in patients aged <18 years, 14.5% in those 18–59 years, 21.5% in those 60–75, and 22.2% in those ≥75 years. Invasive E coli disease accounted for 52 of 171 (30.4%) deaths with known cause. The percentage of all deaths attributed to IED was 3.9% in patients aged 18–59 years, 9.4% in those 60–75 years, and 15.6% in those ≥75 years (Figure 1). There was an increasing IED-associated CFR associated with care acuity where the infection was acquired; CFR for community-acquired IED was 15.2% (71 of 468), healthcare-associated IED was 21.7% (45 of 207), and hospital-acquired IED was 28.3% (64 of 226). No trend was observed between bacteremic (19.9%, 168 of 844) and nonbacteremic patients (20.7%, 12 of 58).
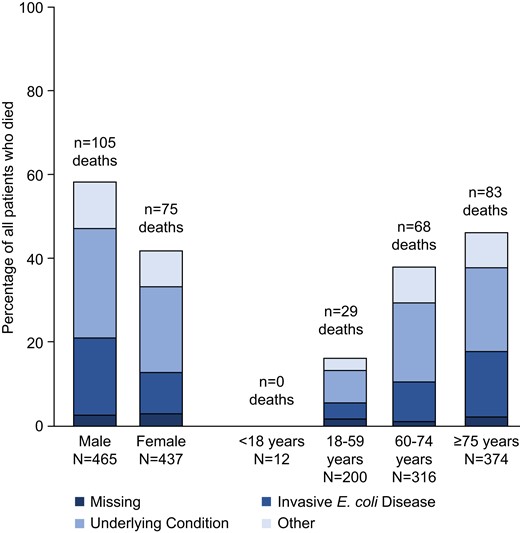
Case-fatality rate and causes of death in 902 patients with invasive Escherichia coli disease. Other = unknown reason (11 patients), peritonitis (4 patients), septicemia (4 patients), pneumonia (4 patients), cardiovascular reasons (3 patients), renal insufficiency (2 patients), multiple organ failure (2 patients), and low digestive bleeding, liver cirrhosis, cerebral hemorrhage, hemorrhagic shock, and adenocarcinoma (all in 1 patient each). N, number of patients in the specified category.
Concurrence of Clinical Case Definitions
All 902 cases of IED identified by the physicians were reclassified against the proposed clinical case definition for IED. According to the clinical case definition, 96.1% of patients (867 of 902) diagnosed by the physicians had IED. The agreement remained high (95.9%, 662 of 690) in the aged ≥60 years group where IED incidence was the highest.
Medical Resource Utilization
The mean duration of hospitalization for an IED episode was 21.0 (standard deviation [SD], 26.98; median, 11.0) days and was similar across age categories (Table 2). Mean duration of hospitalization for those with hospital-acquired IED was 42.3 (SD, 39.1; median, 29.0), whereas duration of hospitalization was lower for community-acquired (14.0 [SD, 15.2; median, 9.0]) and healthcare-associated (13.8 [SD, 1.73; median, 8.0]) IED. The hospital readmission rate within 30 days of discharge was 11.9% (105 of 885) with a mean duration of hospitalization of 12.8 (SD, 12.68) days.
Antibiotic therapy on the day of or after culture sample collection was reported in 96.5% of patients. Non-antibiotic therapy, in addition to antibiotics, was reported in 47.5% of patients. Of 44.8% of patients who received supportive therapy, 18.3% (74 of 404) received respiratory support, 16.3% (66 of 404) received transfusions, and 3.0% (12 of 404) received hemodialysis. The most frequent sites of IED-related medical encounters were the general ward (59.1%, 211 of 357), the emergency room (21.0%, 75 of 357), a hospital outpatient consultation (17.6%, 63 of 357), and intensive care (10.4%, 37 of 357) (Supplementary Table 5).
Most patients, 77.8% (452 of 581), initiated antibiotic therapy on the day of culture sample collection; 19.1% (111 of 581) initiated antibiotic therapy on the day after culture sample selection. Of the 180 patients who died, 76.5% and 20.6% had initiated an antibiotic on the day of or the day after culture sample collection, respectively, relative to 78.1% (374 of 479) and 18.8% (90 of 479) of those who survived. Mean (SD) length of time between the date of culture sample collection and the date of death was 52.9 (75.65) days (median, 21.5; interquartile range, 51.0 days).
Antimicrobial Resistance
A total of 587 (65.6%) E coli isolates were resistant to ≥1 antibiotic in ≥1 drug class(es) and 365 (40.8%) were resistant to ≥1 agent in each of ≥2 drug classes (Table 3). More than 25% of isolates were resistant to amoxicillin (57.8%), piperacillin (54.7%), amoxicillin/clavulanate (33.6%), trimethoprim/sulfamethoxazole (29.2%), ciprofloxacin (26.8%), and levofloxacin (25.4%). Ten isolates were resistant to carbapenems (1.1%). Resistance to ≥1 antibiotic in ≥2 drug classes was higher in those with healthcare-associated (47.8%) or hospital-acquired (47.3%) IED relative to those with community-acquired IED (34.6%) and in those who died (51.7%) relative to those who survived (38.1%).
Antimicrobial Resistance Test Stratified by Mortality and Infection Acquisition Setting
| Antimicrobial resistance | Total | Mortality: Yes | Mortality: No | Community-Acquired | Hospital-Acquired | Healthcare-Associated |
|---|---|---|---|---|---|---|
| N = 902 | N = 180 | N = 722 | N = 468 | N = 226 | N = 207 | |
| Total number of Escherichia coli isolates with antimicrobial resistance testing performed | 895 (100.0) | 178 (100.0) | 717 (100.0) | 465 (100.0) | 224 (100.0) | 205 (100.0) |
| Percentages and number of E coli isolates resistant to a given antibiotic | … | … | … | … | … | … |
| Amikacin | 3 (0.3) | 2 (1.1) | 1 (0.1) | 1 (0.2) | 2 (0.9) | 0 |
| Amoxicillin | 517 (57.8) | 109 (61.2) | 408 (56.9) | 243 (52.3) | 142 (63.4) | 132 (64.4) |
| Amoxicillin/clavulanate | 301 (33.6) | 66 (37.1) | 235 (32.8) | 141 (30.3) | 85 (37.9) | 75 (36.6) |
| Aztreonam | 72 (8.0) | 24 (13.5) | 48 (6.7) | 24 (5.2) | 17 (7.6) | 31 (15.1) |
| Cefepime | 97 (10.8) | 23 (12.9) | 74 (10.3) | 42 (9.0) | 26 (11.6) | 29 (14.1) |
| Cefoxitin | 46 (5.1) | 11 (6.2) | 35 (4.9) | 23 (4.9) | 14 (6.3) | 9 (4.4) |
| Ceftazidime | 96 (10.7) | 27 (15.2) | 69 (9.6) | 44 (9.5) | 19 (8.5) | 33 (16.1) |
| Ceftriaxone | 140 (15.6) | 34 (19.1) | 106 (14.8) | 65 (14.0) | 37 (16.5) | 38 (18.5) |
| Cefuroxime | 185 (20.7) | 50 (28.1) | 135 (18.8) | 87 (18.7) | 51 (22.8) | 47 (22.9) |
| Ciprofloxacin | 240 (26.8) | 64 (36.0) | 176 (24.5) | 110 (23.7) | 64 (28.6) | 66 (32.2) |
| Ertapenem | 6 (0.7) | 2 (1.1) | 4 (0.6) | 1 (0.2) | 4 (1.8) | 1 (0.5) |
| Gentamicin | 95 (10.6) | 24 (13.5) | 71 (9.9) | 42 (9.0) | 31 (13.8) | 22 (10.7) |
| Imipenem | 2 (0.2) | 1 (0.6) | 1 (0.1) | 1 (0.2) | 1 (0.4) | 0 |
| Levofloxacin | 227 (25.4) | 62 (34.8) | 165 (23.0) | 103 (22.2) | 62 (27.7) | 62 (30.2) |
| Meropenem | 2 (0.2) | 1 (0.6) | 1 (0.1) | 1 (0.2) | 1 (0.4) | 0 |
| Nitrofurantoin | 3 (0.3) | 2 (1.1) | 1 (0.1) | 2 (0.4) | 1 (0.4) | 0 |
| Piperacillin | 490 (54.7) | 104 (58.4) | 386 (53.8) | 225 (48.4) | 134 (59.8) | 131 (63.9) |
| Piperacillin/tazobactam | 38 (4.2) | 14 (7.9) | 24 (3.3) | 14 (3.0) | 16 (7.1) | 8 (3.9) |
| Temocillin | 71 (7.9) | 19 (10.7) | 52 (7.3) | 30 (6.5) | 28 (12.5) | 13 (6.3) |
| Tobramycin | 105 (11.7) | 27 (15.2) | 78 (10.9) | 52 (11.2) | 26 (11.6) | 27 (13.2) |
| Trimethoprim | 179 (20.0) | 42 (23.6) | 137 (19.1) | 80 (17.2) | 45 (20.1) | 54 (26.3) |
| Trimethoprim/sulfamethoxazole | 261 (29.2) | 65 (36.5) | 196 (27.3) | 114 (24.5) | 76 (33.9) | 71 (34.6) |
| Percentages and number of E coli isolates resistant to at least 1 antibiotic in each of 1 or more drug classesa | 587 (65.6) | 121 (68.0) | 466 (65.0) | 279 (60.0) | 158 (70.5) | 150 (73.2) |
| Percentages and number of E coli isolates resistant to at least 1 antibiotic in each of 2 or more drug classesa | 365 (40.8) | 92 (51.7) | 273 (38.1) | 161 (34.6) | 106 (47.3) | 98 (47.8) |
Data are n (%). Denominator is total number of E coli isolates with antimicrobial resistance testing performed.
Five antibiotic drug classes (fluoroquinolone, β-lactam, folate pathway inhibitors, aminoglycoside, and nitrofurantoin) were tested.
DISCUSSION
Invasive E coli disease is a clinically poorly described disease that is nevertheless a leading cause of morbidity and mortality globally. In this retrospective study, IED was diagnosed across different ethnic groups, equally affected both males and females, and occurred most frequently in older adults aged ≥60 years. More than one fifth of patients had a delay in initiation of therapy (ie, started antibiotic therapy after the culture sample collection day), and one third of E coli isolates were resistant to an agent in ≥2 drug classes. The older age of patients, the later initiation of antibiotics, and the antimicrobial resistance observed altogether may explain the CFR reported here, 20.0%, which is towards the higher end of the range of values reported for mortality rates in IED patients previously (12.4% to 22.0%) [9,10,16].
Previous studies of IED have reported similar underlying medical conditions to those observed here, such as malignancy, diabetes mellitus, and chronic kidney disease [17–19]. Consistent with numerous reports, the urinary tract was the most commonly identified source of infection observed in 41.1% to 61.5% of patients [20–22]. The gastrointestinal tract was the second most common source, and it was most common in those with hospital-acquired IED.
Differences in the clinical profile and outcomes of IED and in antimicrobial resistance of E coli isolates were observed across infection acquisition setting and age groups. It is notable that although patients aged >60 years were more likely to exhibit organ dysfunction than those ≤60 years, this trend was not observed with SIRS. Consistent with previous studies, the CFR increased with age [23], and there was a trend for a higher CFR in patients with hospital-acquired or healthcare-associated IED [22] than in those with community-acquired IED. Higher rates of resistance to ≥2 drug classes were also observed for isolates from patients with hospital-acquired and healthcare-associated IED and in patients who died. Antimicrobial-resistant E coli is one of the most frequent pathogens implicated in deaths attributable to antibiotic resistance [24,25]. Escherichia coli infections resistant to third-generation cephalosporins, quinolones, or multidrug resistant have recently been shown to be associated with significantly increased 30-day, all-cause mortality relative to susceptible infections [26]. Furthermore, rates of antimicrobial resistance of E coli isolates causing bloodstream infections are increasing [27,28]. Antimicrobial resistance to trimethoprim/sulfamethoxazole (29.2%), ciprofloxacin (26.8%), and levofloxacin (25.4%) in this study were comparable or higher to those previously published for E coli isolates causing bloodstream infections (trimethoprim/sulfamethoxazole, 28%; ciprofloxacin, 12%; levofloxacin, 11%) [27].
Our results are consistent with other studies reporting a substantial burden due to E coli bacteremia in patients who are ≥60 years, have had recent medical interventions or admissions, and have undergone prolonged hospital stays [16,29]. Notably, there is evidence to support phylogenetic variability by age group [30,31]. Predominance of distinct strains of E coli exhibiting unique levels of antimicrobial resistance in specific age groups could lead to distinct clinical outcomes. Both the introduction of a reliable clinical case definition and further characterization of clinical and antimicrobial resistance features of IED across age groups could help to improve patient outcomes.
This study was limited by the retrospective, observational design. The retrospective design of the study may explain the very low number of urine isolates (n = 184 isolates) because urine samples are not regularly stored at the hospital sites. Although criteria were used to ensure selection of adequate sites, the inability to randomly choose sites could have introduced systematic error from multiple sources, including variability in perception of illness, approaches to diagnostic testing, and care. Seventeen sites in well developed countries were included. Data cannot be generalized to a global picture of clinical presentation of IED or the antimicrobial resistance of E coli isolates. During the analysis period, the ICD code set was changed from version 9 to 10. Use of ICD codes for initial patient selection, rather than microbiology data, would likely miss some cases of IED entirely, create a selection bias, or introduce error in that ICD codes can be incorrectly recorded and are rarely revised. Finally, the retrospective analysis of SIRS occurrence was conducted before the publication of updated Sepsis-3 guidelines and did not include changes in immature bands of white blood cells [6]. As such, the occurrence of SIRS in our study is likely to be underestimated.
The global burden of IED, as well as the enormous challenges posed by multidrug-resistant ExPEC, warrant the development of a case definition for clinical and research settings. The development of prophylactic vaccines targeting ExPEC infections would benefit from the use of a standardized and generally accepted case definition to allow evaluation and comparisons of different vaccines [32]. In this study, more than 95% of cases of physician-diagnosed IED were also identified by the case definition, suggesting its use could facilitate diagnosis and treatment. Data suggest that up to 50% of sepsis cases lack culture confirmation [33–35]. Data that exclude urine culture from the primary endpoint case definition could miss a substantial percentage of all sepsis cases, a majority of which are likely to be caused by ExPEC. Thus, the proposed case definition is grounded in the presence of a constellation of signs and symptoms of systemic infection using well accepted clinical tools (ie, Sepsis-3, SOFA), but it incorporates culture of E coli from a normally sterile site or urine in patients where no other source of infection is identifiable. To increase specificity, colony-forming unit (CFU) content of urine of at least 105 CFU/mL is required [36]; however, our retrospective database analysis did not allow the analysis of urine CFU/mL parameter. The case definition is also consistent with Sepsis-3 guidelines that define sepsis as a host response to a bacterial antigen (lipopolysaccharide), which does not mandatorily require the continuous presence of bacteria in the blood [6]. More importantly, data presented here demonstrate the value of the proposed case definition, which incorporates both SOFA and SIRS criteria, in that although only 62% of IED patients would be identified based on SOFA criteria alone (ie, SOFA ≥2), 86% of patients would be identified using both SOFA scores and SIRS criteria (ie, SOFA ≥2 OR ≥2 SIRS criteria).
CONCLUSIONS
Increasing awareness of and screening for IED in patients over the age of 60 years could improve patient management. Data reported here describing clinical characteristics stratified by infection acquisition setting, age, and infection outcome could facilitate timely and accurate diagnosis of IED. Furthermore, antimicrobial resistance data provide valuable information for those working to optimize therapeutic treatment and patient management. Extraintestinal pathogenic E coli is a leading cause of invasive bacterial disease, warranting the introduction of a specific term and a clinical case definition to reprioritize the entity of IED in clinical practice, and to promote standardization in clinical trial design as new treatments or prophylactic vaccines targeting IED are developed. This study provides valuable real-world data on the risk factors, clinical profile, and socioeconomic burden of IED, a disease that has seldom been described as a sum of all its manifestations.
Supplementary Data
Supplementary materials are available at Open Forum Infectious Diseases online. Consisting of data provided by the authors to benefit the reader, the posted materials are not copyedited and are the sole responsibility of the authors, so questions or comments should be addressed to the corresponding author.
Acknowledgments
We acknowledge Amy Maxson, Kathryn Shute, Todd A Davies, Ron de Winter, James Peterson, Delores Etheredge, Darren Abbanat, Sonal Munshi, Bart Spiessens, Amy Lwin, Atsushi Momose, Trish Childers, Thijs van den Hoven, Brian Morrow, Alvaro Agustin Rodriguez, Frank Struyf, Moussa Aitabi, Olivier Barraud, Yohei Doi, Phillippe Lanotte, Luis Martinez-Martinez, Allison Mcgeer, Keith Morris, Patricia de Palacios, Jeff Powis, Miquel Pujol, Luigia Scudeller, Matthew Sims, Joshua Thaden, Katsunori Yanagihara, Thomas Verstraeten, Florian Wagenlehner, and Stefan Zimmermann. We also thank Cassidy Bayley (Zoetic Science, an Ashfield company, part of UDG Healthcare plc), Philip Matthews (Eloquent Scientific Solutions), and Joanne Wolter (independent on behalf of Janssen) for medical writing assistance.
Financial support. This study and medical writing assistance were funded by Janssen Research and Development, LLC.
References
Author notes
Potential conflicts of interest. J. D., J. G., O. G., J. P., and M. S. are employees of Janssen and receive Janssen stock. P. H. was an employee of Janssen from 2012 to 2019 and since 2019 has been a Full Professor at UMC Utrecht. M. B. is chair of the international study steering committee for the E.mbrace study (Janssen Vaccines), with payments made to UMC Utrecht. S. G. consults/advises for Janssen. Conflicts that the editors consider relevant to the content of the manuscript have been disclosed.


Comments