


Abstract
The public health impact of a tobacco tax increase depends on the extent to which the industry passes the increase onto consumers, also known as tax-pass through. In 2020, the Netherlands announced tax increases aimed at increasing the retail price by €1 per 20 factory-made (FM) cigarettes and €2.50 per 50 g of roll-your-own (RYO) tobacco. This study examines the pass-through rate after the tax increase, and whether this differed by type of tobacco and brand segment.
Self-reported prices of 117 tobacco brand varieties (cigarettes = 72, RYO = 45) pre- and post-tax increases were extracted from the 2020 International Tobacco Control Netherlands Surveys (n = 2959 respondents). We calculated the tax pass-through rate per variant, examining differences between the type of tobacco and brand segments.
On average, cigarette prices increased by €1.12 (SD = 0.49; 112% of €1) and RYO prices by €2.53 (SD = 0.60; 101% of €2.50). Evidence of differential shifting across segments was found, with evidence of overshifting in non-discount varieties. The average price of discount varieties increased by €0.20 less than non-discount varieties. Similarly, the net-of-tax price decreased in discount varieties (cigarettes = −€0.02; RYO = −€0.05), but increased in non-discount varieties (cigarettes = +€0.14; RYO = +€0.20).
Despite the large tax increase, the industry increased prices in line with or above the required level. Through differential shifting, the price gap between discount and non-discount varieties has widened, which may reduce the public health impact of the tax increase. Measures aimed at reducing price variability should be strengthened in taxation policy, such as the European Tobacco Tax Directive (TTD).
We found that the industry used differential shifting after a significant tobacco tax increase in the Netherlands. Prices increased more than required in higher-priced products, but not in lower-priced products. This pattern was found both for FM cigarettes and RYO tobacco. Through differential shifting, the industry undermines the potential public health impact of tobacco tax increases, by offering a relatively cheaper alternative, which discourages people to quit or reduce consumption. The revision of the European TTD provides an opportunity to address the widening price gap—both between and within product segments—across the European Union.
Introduction
Increasing tobacco taxation is one of the most effective measures to reduce tobacco use.1,2 Raising taxation is expected to lead to an increase in retail price (hereafter: price), which in turn should motivate individuals to reduce consumption. However, while governments may impose a tax increase, the actual retail price is decided by the tobacco industry. The industry can shift a tax increase fully onto consumers, meaning that price will increase with the exact amount that taxation has increased. Industry can also decide to increase prices on top of the tax increase (overshifting), or absorb some of the tax increase, resulting in a smaller price increase than the tax increase (undershifting). The effectiveness of a tax increase is therefore dependent on the extent to which the industry passes the tax increase (ie, tax pass-through) onto consumers through a price increase.
The government of the Netherlands implemented a tax increase of €1 per 20 factory-made (FM) cigarettes and €2.50 per 50 g of roll-your-own (RYO) tobacco on April 1, 2020, This was the first of a series of tax increases, which aimed to increase the price of a pack of cigarettes from seven (2018) to ten euros (2023). To limit substitution, excise taxes on RYO tobacco were increased at an identical rate in absolute terms. The tax increases are part of the tobacco control chapter in the National Prevention Agreement, which aims to reduce tobacco prevalence and achieve a Smokefree Generation by 2040. Other tobacco control measures of the chapter are, amongst others: a display ban on tobacco in supermarkets (2020) and other points of sale (2021), plain packaging (2020), and reducing the number of tobacco outlets (from 2022 onwards).3 In 2019, prior to most of the tobacco control measures of the National Prevention Agreement, 21.7% of the adults in the Netherlands smoked, of which 15.9% (73.3% of smokers) smoked daily.4 The aim of our study is to examine to what extent the 2020 tax increase in the Netherlands was shifted towards consumers. Additionally, we explore whether this differed by type of tobacco (FM versus RYO), and brand segment (discount versus non-discount).
Insight into how the industry shifts tax increases in different segments is crucial for tobacco control since it can undermine the intended public health impact of a tax increase. A 2021 systematic review of tobacco industry pricing strategies found that in most high-income countries the industry employed differential shifting across price segments: Overshifting in the higher-priced segments, and undershifting in the lower-priced segments.5 A similar pattern of differential shifting was found in a study in Mauritius, which analyzed cigarette prices from brands by British American Tobacco, which has a near monopoly in the country.6 Due to differential shifting the price gap between lower-priced, such as budget or value brands, and higher-priced, premium brands is likely to increase, which facilitates brand substitution rather than smoking reduction or cessation as a response to tax increases.7,8 Tobacco industry documents have indicated that cheaper products have a tactical role in keeping people who smoke “in the marketplace when cigarette prices increase,”9 and are targeted specifically to young people.8,10 In addition, overshifting likely increases profits while undershifting in the lower-priced segment helps maintain sales volume.6
The popularity of lower-priced tobacco, such as discount-brand cigarettes, has been increasing.11 The discount segment consists of lower-priced cigarette brands and varieties, sometimes also referred to as economy or value(-for-money) brands. Some manufacturers further differentiate between these segments, such as an “ultra-low price segment”12 or “deep discount segment.”13 Publicly available industry documents indicate a global focus on more affordable products.14,15 As inflation continued to rise in 2022 and 2023, resulting in a cost-of-living crisis in multiple countries, it is not surprising that more affordable tobacco continues to grow in popularity. Imperial Brands reported, in an interview in January 2023, that “value segments were growing with 3 to 5 percent year-on-year in the United Kingdom and Ireland; […]the sub-economy segment accounts for 63% of FM cigarette sales, and the economy segment accounts for 56% of RYO sales.”16 While no such data is publicly available for the Netherlands, it is not unlikely that a similar trend is emerging in the Netherlands as tobacco prices have increased in recent years.
The use of RYO tobacco, an affordable alternative to cigarettes, is also increasing in popularity.11,17 In England, RYO prevalence increased from 6.7% to 8.1% between 2008 and 2017, while FM prevalence declined from 15.3% to 9.2% in the same period.18 RYO tobacco use is and historically has been, quite common in the Netherlands. The prevalence of RYO use among people who smoke in the Netherlands has decreased in the last few years but remains above 30% (2016: 40.2%, 2022: 34.0%).19 Despite its growing popularity globally, only four studies in the systematic review on industry pricing strategies also analyzed tax shifting in RYO tobacco. All four studies found indications of overshifting across RYO brands, and two found a similar approach to pricing as in the FM cigarette market: overshifting in the higher-priced segments and undershifting in the lower-priced segments.20,21
Methods
Sample
Since no retail scanner data was available publically, or at the request of the researchers, reported prices of tobacco brand varieties by respondents from the International Tobacco Control (ITC) Policy Evaluation Netherlands Survey, a prospective cohort study, were used. A nationally representative sample of smokers from the Netherlands was sampled from the TNS NIPObase. TNS NIPObase is a web database by Verian Public, formerly known as TNS NPO (TNS Netherlands Institute of Public Opinion), consisting of more than 200 000 respondents randomly sampled from the Netherlands population. Respondents were compensated with “NiPoints” which could be used to buy gift cards. Respondents had to be at least 18 years old, have smoked a minimum of 100 cigarettes in their life, and smoke at least one cigarette per month to be recruited. Respondents did not have to be current smokers at follow-up. Further details on sampling and the ITC methodology can be found elsewhere.22,23
The sample was restricted to tobacco brand varieties of which prices were reported by respondents before and after the tax increase. Reported prices in wave 1 (February—March 2020) were coded as prices pretax increase; prices reported in wave 2 (September–November 2020) were coded as prices post-tax increase. First, data from respondents who reported having bought tobacco outside of the Netherlands were excluded from analyses (wave 1 = 11.0%; wave 2 = 16.0%). Next, we restricted our sample to brand varieties that had at least one reported price in both waves—regardless of whether the prices were reported by the same respondent or not (FM: wave 1 = 90.4%, wave 2 = 94.5%; RYO: wave 1 = 92.3%, wave 2 = 94.3%). Reported prices by respondents who were added to the sample in wave 2, or dropped out, quit smoking, or switched varieties were thus included in our sample—as long as the price of the brand variety was reported in both waves by at least one respondent. In total, reported prices by N = 1647 respondents in wave 1 (FM = 1141; RYO = 506) and N = 1312 respondents in wave 2 (FM = 949; RYO = 363) were used. This resulted in self-reported prices of 103 varieties from 17 brands of FM cigarettes and 56 varieties from 22 brands of RYO tobacco. After the individual-level prices were inspected (see Measures below), the analytical sample was transferred to a new dataset. The analytical sample consisted of brand-level data, which was extracted from the person-level data from the ITC surveys. The next section provides more details.
Measures
Price, Tax, and Tax Pass-Through Parameter
Respondents who smoke were enquired about their last tobacco purchase. Each respondent was asked to report the brand, sub-brand, and package size (for example: Marlboro Red 20), as well as how much they paid for that specific brand, sub-brand, and package size (hereafter: variety). In the Netherlands, prices—and tax rates—are set for the whole country, meaning that no spatial differences in price per variety should exist. To account for variability and recall bias in the self-reported prices, we used the median reported price per variety, per wave for our analyses. Varieties with unrealistic median prices at wave 1 or 2 (such as variety X being 25% more expensive than comparable variety Y of the same brand), as well as an unlikely price change between both waves (such as a doubling of the price), were excluded from analyses (FM: N = 29; RYO: N = 13). The analytical sample consisted of N = 117 varieties (FM: N = 74, RYO: N = 43).
The median prices were used to calculate the taxes and price net-of-taxes, per variety, and per wave. In the Netherlands, the amount of taxes charged is dependent on the type of tobacco, the price of the product, as well as the number of cigarettes/grams in the product (Table 1 displays the tax rates per type of tobacco24). The exact tax increase thus differs per variety. FM cigarette excise taxes consist of a specific and ad valorem component, as well as a minimum excise tax. Specific excise taxes are a tax charged per quantity, for example per 1000 cigarettes. Ad valorem excise taxes are charged as a percentage of the value (price) of a product. The specific and ad valorem excise taxes together must be greater than the minimum excise tax—if not, it is replaced by the minimum excise tax rate. On RYO tobacco only specific excise taxes are charged. In addition to excise taxes, both FM cigarettes and RYO tobacco are subject to a value-added tax (VAT) of 21%.
Taxes on Factory-Made Cigarettes and Roll-Your-Own Tobacco Pre- and Post-tax Increase, as Set by the Ministry of Finance of the Netherlands
| Type of tobacco | Period | Specific excise duty1 | Ad valorem | Minimum taxation1 | VAT |
|---|---|---|---|---|---|
| FM cigarettes | Up to March 31, 2020 | €180.32 | 5% | €196.99 | 21% |
| Starting April 1, 2020 | €219.25 | 5% | €238.31 | 21% | |
| RYO tobacco | Up to March 31, 2020 | €114.65 | — | — | 21% |
| Starting April 1, 2020 | €155.97 | — | — | 21% |
The retail price minus taxes (excise duties and VAT) is the net-of-tax price. The communicated tax increases by the government, in this case €1 per pack or €2.50 per pouch, include both the increase in excise taxes as well as the increase in value-added taxes (VAT). All prices were standardized to a pack of 20 cigarettes or a pouch of 50 g RYO tobacco. The extent to which industry shifts the tax increase toward consumers, the tax pass-through, was calculated by dividing the change in retail price (in euros) by the change in taxes (in euros). If the tax pass-through parameter equals 1 taxes are fully shifted, less than 1 indicates undershifting, while greater than 1 indicates overshifting.
As sensitivity analyses, another set of price variables was set up using online archived prices of varieties post-tax increase. Prices of varieties were recorded through archived webpages of tobacco shops using the internet archive Wayback Machine, a public web archive which has archived more than 700 billion web pages since its start in 1996.25,26 No archived webpages were found with prices before the tax increase, but prices post-tax increase were found on archived webpages from four (online) tobacco retailers. The webpages were archived between September 18 and October 1, 2020; the same time period as our data collection of wave 2. Varieties of which the price was not archived online (FM = 15.1%; RYO = 4.4%) were excluded. This analytical sample consisted of N = 117 variants (FM: N = 72, RYO: N = 45).
Type of Tobacco
Varieties were classified as either FM or RYO, depending on the type of product.
Brand Segment
Two brand segments were distinguished: “discount” and “non-discount,” in line with one of our previous studies in the Netherlands.27 Discount brands and varieties are classified as lower value or lower-priced segments; non-discount brands and variants are often classified as premium, mid-priced, or the mid- and upper-priced segments. First, brands were assigned to one of the segments based on publicly available tobacco industry documents, commercial literature, and previous classifications found in the academic literature.27 All FM brands, and nine RYO brands could be assigned a brand segment based on these documents. Next, we explored whether the assigned classifications agreed with the Wave 1 prices per cigarette or per gram. Three FM brands were assigned another segment based on the price per cigarette: L&M, Caballero, and Winston. L&M and Winston were originally assigned “non-discount,” but recoded due to their price per cigarette being some of the lowest in our sample (€0.31 and €0.28, respectively). Caballero was originally assigned ‘discount’, but recoded due to their price per cigarette being one of the highest (€0.36). No RYO brands were assigned another classification based on their price per gram. RYO brands that could not be classified based on (industry) documents, were assigned to the same segment as verified brands with similar price per gram (discount: ≤0.19 euros, non-discount: ≥0.20 euros per gram). Table S1 displays the resulting classification.
Statistical Analysis
Differences in the tax pass-through parameter between brand segments, and type of tobacco were tested through an ANOVA. Due to non-normality of the residuals bias-corrected and accelerated bootstrap intervals were set up, based on 5000 samples. Because no interaction was found between brand segments and type of tobacco, only the main effects are displayed in the Results section. Sensitivity analyses using archived online prices were carried out in a similar fashion. All analyses were carried out in SPSS 27.
Results
The average prices, taxes, and net-of-taxes (price minus taxes) pre- and post-tax increase, standardized to a pack of 20 cigarettes or 50 g of RYO tobacco, are displayed in Figure 1. The reported price for a pack of 20 cigarettes increased by €1.12 (SD:0.49) from €6.63 (SD:0.49) to €7.75 (SD:0.72). The price of a pouch of 50 g of RYO tobacco increased by €2.53 (SD:0.60) from €9.69 (SD:1.29) to €12.22 (SD:1.33). The net-of-tax price per pack of FM cigarettes increased by 9 cents and for a pouch of RYO tobacco by 3 cents.
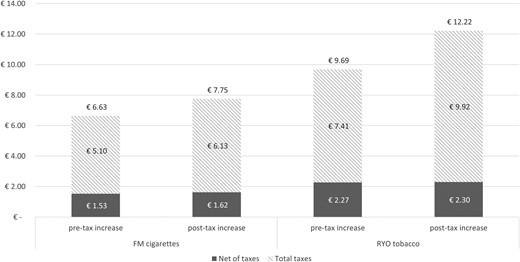
Average prices, taxes, and net-of-taxes (retail price minus taxes) pre- and post-tax increase, by type of tobacco.
Prices of non-discount varieties increased on average 20 euro cents per pack more than discount varieties, regardless of the type of tobacco (Figure 2, A and B). On average, the prices in the discount segment increased less than the tax increase of €1 (FM) or €2.50 (RYO), while the non-discount varieties increased prices more than the tax increase. The net-of-tax price decreased in the discount segment after the tax increase (FM = −€0.02; RYO = −€0.05) but increased in non-discount varieties (FM = +€0.14; RYO = +€0.20). An overview of the standard average prices, taxes, and net of taxes by type of tobacco pre- and post-tax increase, and by type of analyses (main and sensitivity) can be found in Table 2.
Standardized Average Prices, Taxes and Net-of-Taxes by Type of Tobaco Pre- and Post-tax Increase, by Type of Analysis
| pre-tax increase | Post-tax increase | ||||||
|---|---|---|---|---|---|---|---|
| Price (€) M (SD) | Tax (€) M (SD) | Net-of-tax (€) M (SD) | Price (€) M (SD) | Tax (€) M (SD) | Net-of-tax (€) M (SD) | ||
| Main analyses | FM cigarettes | 6.63 (.49) | 5.10 (.10) | 1.53 (.39) | 7.75 (.49) | 6.13 (.15) | 1.62 (.57) |
| Discount | 6.23 (.42) | 5.02 (.07) | 1.21 (.34) | 7.21 (.62) | 6.02 (.12) | 1.19 (.50) | |
| Non-discount | 6.82 (.40) | 5.13 (.08) | 1.68 (.32) | 7.99 (.62) | 6.18 (.14) | 1.82 (.49) | |
| RYO tobacco | 9.69 (1.29) | 7.41 (.22) | 2.27 (1.07) | 12.22 (1.33) | 9.92 (.23) | 2.30 (1.10) | |
| Discount | 9.02 (.67) | 7.30 (.12) | 1.72 (.56) | 11.46 (.60) | 9.79 (.10) | 1.67 (.46) | |
| Non-discount | 11.22 (1.05) | 7.68 (.18) | 3.54 (.87) | 13.96 (.84) | 10.22 (.15) | 3.74 (.70) | |
| Sensitivity analyses | FM cigarettes | 6.54 (.56) | 5.08 (.11) | 1.45 (.45) | 7.49 (.57) | 6.07 (.11) | 1.41 (.46) |
| Discount | 6.19 (.44) | 5.01 (.08) | 1.17 (.36) | 6.94 (.25) | 5.97 (.04) | .97 (.21) | |
| Non-discount | 6.69 (.54) | 5.11 (.10) | 1.58 (.44) | 7.73 (.50) | 6.12 (.10) | 1.61 (.40) | |
| RYO tobacco | 9.63 (1.48) | 7.40 (.26) | 2.23 (1.22) | 12.29 (1.18) | 9.93 (.21) | 2.36 (.98) | |
| Discount | 8.91 (.88) | 7.28 (.15) | 1.63 (.73) | 11.48 (.26) | 9.79 (.05) | 1.69 (.22) | |
| Non-discount | 10.87 (1.48) | 7.62 (.26) | 3.25 (1.22) | 13.68 (.76) | 10.17 (.13) | 3.50 (.63) | |
Prices were standardized to a pack of 20 factory-made cigarettes or 50 g of roll-your-own tobacco. M = mean; SD = standard deviation; FM = factory-made; RYO = roll-your-own
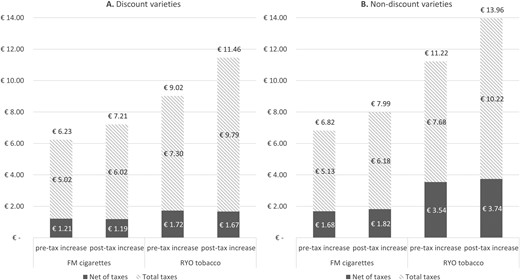
Average prices, taxes, and net-of-taxes (retail price minus taxes) pre- and post-tax increase, by type of tobacco and brand segment (A. Discount varieties; B. Non-discount varieties).
The ANOVA found no significant difference in tax pass-through rates between FM and RYO (F(1,114) = 0.001, p = .976), but did find a significant difference between brand segments (F(1,114) = 5.357, p = .022). The estimated marginal mean for discount brands was 0.959 (BCa 95% CI: .877 to 1.048) and for non-discount brands 1.096 (BCa 95% CI: 1.019 to 1.174). On average, taxes thus were overshifted in non-discount brands, but not in discount brands. We found no statistical evidence for over- or undershifting for FM brands, nor for RYO tobacco brands. Table 3 displays the pass-through parameters per type of tobacco and per brand segment.
Estimated Tax Pass-Through Parameters, Adjusted for Type of Tobacco and Brand Segment
| Main analyses (N = 117) | Sensitivity analyses (N = 117) | |
|---|---|---|
| Estimated marginal mean (BCa 95% CI) | Estimated marginal mean (BCa 95% CI) | |
| FM cigarettes | 1.026 (0.942 to 1.112) | 0.909 (0.837 to 0.984) |
| RYO tobacco | 1.026 (0.962 to 1.098) | 1.072 (1.003 to 1.151) |
| Discount brands | 0.959 (0.877 to 1.048) | 0.913 (0.848 to 0.984) |
| Non-discount brands | 1.096 (1.019 to 1.174) | 1.067 (0.993 to 1.149) |
FM = factory-made; RYO = roll-your-own; BCa = Bias-corrected and accelerated; CI = confidence interval
For sensitivity analyses, we used archived online prices rather than reported prices post-tax increase. Nearly half of the varieties had the same self-reported median price as archived online (FM = 48.1%; RYO = 53.1%). The archived prices that deviated from the self-reported prices were on average 0.36 euro (SE: 0.25) cheaper per pack of FM cigarettes than reported, and 1.30 euro (SE: 1.26) more expensive per pouch of RYO tobacco than reported (not-standardized). The average prices, taxes, and net-of-taxes (price minus taxes) pre- and post-tax increase, standardized to a pack of 20 cigarettes or 50 g of RYO tobacco, from the sensitivity analyses are displayed in Figure S1; The prices, taxes, and net-of-taxes split by brand segment can be found in Figure S2A and S2B.
The sensitivity analyses found a significant difference between brand segments (F(1,114) = 8.155, p = .005) as well as between FM and RYO tobacco (F(1,114) = 8.813, p = .004). While not always significant, a similar pattern in direction can be observed in the estimated marginal means across both analyses, except for FM cigarettes, which indicated full pass-through in the main analyses and undershifting in the sensitivity analyses.
Discussion
In 2020, the government of the Netherlands increased tobacco taxes to €1 per pack of 20 cigarettes and €2.50 per pouch of 50 g of RYO tobacco to reduce smoking prevalence. However, the extent to which this leads to a retail price increase is decided by the tobacco manufacturers. The aim of this study was to explore to what extent the 2020 tobacco tax increases were passed on to consumers, and whether this differed by type of tobacco and brand segment.
Consistent with previous studies,5,28,29 we found evidence of differential shifting across brand segments. The tax increase was overshifted in non-discount varieties, but not in discount varieties. Evidence for undershifting in the discount segment was found in our sensitivity analyses, as well as a nonsignificant difference in the main analyses in the same direction. This pattern was found for both FM cigarettes and RYO tobacco. For example, the price of a standardized pack of FM cigarettes increased by €1.18 for non-discount varieties, of which €1.04 were taxes, while the price of discount varieties increased by €0.98 despite a tax increase of €1.00 (Figure 2).
Overshifting taxes in the non-discount segment allows the industry to drive up profits through higher per-cigarette revenues. Overshifting may increase the public health impact of a tax increase because prices increase even more than the tax increase intended, which would stimulate people to smoke less or quit.6 However, this may not be the case if not all brands or varieties overshift the tax increase. By undershifting, or at least not overshifting, taxes in the lower-priced segments the price gap between discount and non-discount segments, as well as the range of prices within a segment, increases.5 Through differential shifting the industry allows smokers to switch to a more affordable range of cigarettes, therefore retaining sales volume and even smoking prevalence. Cheaper products provide price-sensitive smokers with an affordable alternative, enabling them to continue smoking and target young people to start smoking.6,9,10 The public health impact of the tax increase may thus have been partly undermined by the tobacco industry’s tactics.
The 2020 tax increase,30 as well as the recently announced 2023 and 2024 tax increases,31 were met with opposition by the tobacco industry. The industry argued against tax increases by stating that higher prices would lead to increases in cross-border and illicit purchasing, which would not result in the desired health and revenue outcomes.31 Yet, our study found indications of increasing prices on top of the tax increase, at least in non-discount varieties. This discrepancy between industry arguments (being against price increases) and actions (increasing the price above the required level) was also found in Britain29 and Ireland.32 The industry further argued that it is of great importance to tax RYO tobacco at a lower tariff to provide people with a more affordable alternative to cigarettes and to act as a “buffer” against cross-border and illicit purchasing.30,31 But, again, in contrast to industry arguments, indications of overshifting in RYO brands were found in our sensitivity analyses as well as a nonsignificant direction towards overshifting in our main analyses. While our conclusions on shifting in FM brands were inconclusive, indicating full shifting in main analyses and undershifting in our sensitivity analyses, the price gap between the cheapest FM cigarettes and most expensive RYO tobacco would likely decrease due to the differential shifting strategies.
The Netherlands’ tax structure might have added to the widening of the price gap. The communicated tax increase of €1 and €2.50 referred to the total increase in taxes paid over a pack of cigarettes or RYO tobacco, and thus not only includes an increase in excise taxes but also in VAT. If the industry thus decides to overshift taxes in a brand or variety, this effect is amplified by an additional increase in VAT, which is paid over the sales price. In the case of cigarettes, overshifting is also amplified by the ad valorem tax. As per the European Tobacco Tax Directive (TTD), European countries require a mixed excise system for FM cigarettes, thus comprising both specific and ad valorem excise taxes, and can choose the tax structure for other tobacco products, such as RYO tobacco, as long as it exceeds the minimum excise duty rates as set in Directive 2011/64/EU. Mixed excise structures have been found to have greater price variability than specific uniform tax structures33,34; the price gap between premium and lower-priced brands is larger in countries with a greater share of ad valorem tax.35 The renewal of the European TTD provides an opportunity to address the widening price gap—both between and within product segments—across the European Union, by implementing measures such as linking minimum excise taxes between products.36
There are two main limitations to our work. First of all, we had to deduce retail prices from self-reported prices of varieties by the ITC cohort, because historical price data such as retailer scanner data were not (publicly) available to the researchers. Consequently, some discrepancies may exist in the reported prices between respondents, as well as between the reported and actual retail prices. By using median prices per variety, inspecting all prices thoroughly, and omitting suspicious prices from analyses we have, to the best of our ability, limited the potential impact hereof. Furthermore, since our sample was restricted to varieties which were reported by the ITC cohort, the varieties and the corresponding prices in this paper may not reflect the whole tobacco market in the Netherlands. Second, our study was limited to exploring only one tax increase (April 2020) in one country, during the COVID-19 pandemic. The industry may have adjusted the prices between the tax increase and our Wave 2 Fieldwork (September–November 2020). However, we believe that this is unlikely given the short time frame, as well as the sales points of tobacco not being affected by government measures until December 2020. Future studies would benefit from examining a longer time period that includes a range of tax increases, or multiple countries, which may provide more insight into tobacco industry tactics.
In conclusion, we found that all varieties increased in price after the tax increase, but the extent to which the industry shifted taxes differed between brand segments, widening the price gap between more expensive and less expensive brands. By widening the price gap, the industry tempts price-sensitive smokers to switch to a more affordable product, rather than quit, when faced with increased prices. This undermines the potential public health impact of a tax increase. To counter this, the widening price gap between and within product groups should be addressed in tobacco taxation policies, for example, the European Tobacco Tax Directive.
Supplementary material
Supplementary material is available at Nicotine and Tobacco Research online.
Funding
The ITC Netherland Survey was supported by grants from Longfonds (Lung Foundation Netherlands), Hartstichting (Netherlands Heart Foundation), KWF Kankerbestrijding (Dutch Cancer Society), Trombosestichting Nederland (Thrombosis Foundation), Diabetesfonds (Diabetes Funds) (#2.1.19.004), and the Canadian Institutes for Health Research (FDN-148477). Additional support to GTF was provided by a Senior Investigator Grant from the Ontario Institute for Cancer Research and the Canadian Cancer Society O. Harold Warwick Prize. The funders had no role in the design of the study; in the collection, analyses, or interpretation of data; in the writing of the manuscript, or in the decision to publish the results.
Acknowledgments
We gratefully acknowledge several members of the ITC Project team at the University of Waterloo who have assisted in all stages of the ITC Netherlands Survey. In particular, we would like to thank Thomas K. Agar, Anne C.K. Quah, Christian Boudreau, Kai Jiang, and Ruth Loewen.
Declaration of Interests
Geoffrey T. Fong has served as an expert witness or a consultant for governments defending their country’s policies or regulations in litigation. All other authors have no conflicts of interest to declare.
Author Contributions
Cloé Geboers (Conceptualization [lead], Formal analysis [lead], Methodology [equal], Writing—original draft [lead], Writing—review & editing [lead]), Marc Willemsen (Conceptualization [supporting], Funding acquisition [lead], Project administration [equal], Supervision [lead], Writing—review & editing [supporting]), Math Candel (Conceptualization [supporting], Formal analysis [supporting], Methodology [supporting], Supervision [supporting], Writing—review & editing [supporting]), Corne van Walbeek (Conceptualization [supporting], Formal analysis [supporting], Methodology [supporting], Writing—review & editing [supporting]), Gera Nagelhout (Conceptualization [supporting], Funding acquisition [equal], Supervision [supporting], Writing—review & editing [supporting]), Hein de Vries (Conceptualization [supporting], Funding acquisition [supporting], Supervision [supporting], Writing—review & editing [supporting]), Bas van den Putte (Writing—review & editing [supporting]), and Geoffrey Fong (Funding acquisition [supporting], Writing—review & editing [supporting])
Data Availability
In each country participating in the international Tobacco Control Policy Evaluation (ITC) Project, the data are jointly owned by the lead researcher(s) in that country and the ITC Project at the University of Waterloo. Data from the ITC Project are available to approved researchers 2 years after the date of issuance of cleaned data sets by the ITC Data Management Center. Researchers interested in using ITC data are required to apply for approval by submitting an International Tobacco Control Data Repository (ITCDR) request application and subsequently to sign an ITCDR Data Usage Agreement. The criteria for data usage approval and the contents of the Data Usage Agreement are described online (http://www.itcproject.org).
Ethics Approval
The survey protocols and all materials, including the survey questionnaires, were cleared for ethics (ORE#41704) by Office of Research Ethics, University of Waterloo, Canada. Ethics clearance in the Netherlands was waived due to minimal risk. All participants provided informed consent to participate.

Comments