


Abstract
Vestibular schwannomas (VS) are tumors of the cerebellopontine angle with significant morbidity, causing hearing loss, tinnitus, and trigeminal and facial nerve compromise. An effective alternative to microsurgical resection is stereotactic radiosurgery (SRS), which can be delivered in either single-fraction (SRS) or hypofractionated stereotactic radiotherapy (hSRT) (3-5 treatments) regimens. It remains unclear which fractionation regimen provides superior outcomes.
Ovid MEDLINE, EMBASE, CINAHL, and Cochrane Reviews were searched for studies either comparing hSRT with SRS or focusing on hSRT alone in treating VS. Primary endpoints included tumor control, serviceable hearing, tinnitus, and cranial nerve V and VII symptoms. A random-effects analysis was employed to compare pre- and post-treatment effects (hSRT alone) or SRS and hSRT outcomes (two-arm studies).
This analysis included 21 studies focusing on hSRT alone and 13 studies comparing SRS and hSRT. Significant heterogeneity was observed. Overall, when hSRT was analyzed alone, crude tumor control was achieved in 94% (95% CI: 88%, 99%) of 1571 patients. There was no difference between pre- and post-treatment odds ratios (OR) of tinnitus, facial, or trigeminal impairment. Serviceable hearing was diminished following hSRT (OR = 0.60, 95% CI: 0.44, 0.83). Comparison with SRS showed no difference with respect to tumor control, serviceable hearing, trigeminal or facial nerve impairment.
hSRT achieved excellent tumor control and, with the exception of serviceable hearing, did not result in worse post-treatment cranial nerve symptomatology. Analysis of comparative studies between hSRT and SRS did not reveal any significant difference in either tumor control or treatment morbidities.
Vestibular schwannomas (VS) are benign nerve sheath tumors that arise from Schwann cells of the eight cranial nerve (CN VIII); they are the most common tumor arising in the cerebellopontine angle (CPA). Incidence is higher in neurofibromatosis type 2 (NF2).1–3 Though VS are benign, their continuous average growth rates of approximately 1-2 mm/year eventually lead to brainstem, cerebellum, and fourth ventricle compression.4,5 Presenting symptoms usually include auditory complaints, tinnitus, and other ipsilateral focal CN deficits. Intervention with either surgery or radiation therapy is often warranted to prevent progression and accumulation of comorbidities.6 Microsurgery is a valid interventional approach with low mortality.7 However, iatrogenic surgical morbidities such as CN palsies and hearing loss are significant concerns.8 These periprocedural risks are almost nonexistent in patients treated with radiation.9 As such, microsurgery in contemporary practice is most often used for large tumors, syndromic tumors, young patients, and patients for whom radiotherapy is not an option.1,10
Radiotherapy has been a valid alternative to surgery for decades.11 Two main radiation regimens have been employed: (i) the administration of a single, high radiation dose directed toward the tumor (ie, stereotactic radiosurgery [SRS])12–14 or (ii) the fractionation of the treatment in multiple smaller doses administered daily (ie, stereotactic radiotherapy [SRT]). In the latter case, different regimens exist, ranging from the classic 50 Gray (Gy) given in 25 or so 1.8-2.0 Gy fractions to hypofractionated (3-10 fraction) regimens.15 Conservative management with surveillance imaging (“wait and scan”) is losing traction as interventions become necessary and are often more complicated when the tumor is larger.16,17
In recent years, the hypofractionated stereotactic radiotherapy (hSRT) regimens of 18-30 Gy divided into 3-10 doses have gained traction as a means to deliver lower daily radiation doses. These regimens posit that hypofractionation will result in equivalent tumor control but potentially less morbidity than single-fraction regimens as normal tissues can recover between doses. It remains unclear, however, if hypofractionation is superior to single-dose radiosurgery.18–20 The issue is of particular relevance; as more centers utilize varying radiation regimens, clear guidelines are necessary to inform treatment and to compare outcomes with a standardized approach.
This issue is compounded by the lack of universal metrics to assess tumor response and comorbidities in the literature. For instance, tumor response can be defined as either lack of intervention (surgical or otherwise) or lack of tumor-growth on imaging.21,22 Length of follow-up and imaging response assessment is also not standardized.23
Hearing classification is similarly problematic: it can be characterized according to the Gardner-Robertson (GR) scale (where grades I and II are defined as “serviceable hearing,”) or to the American Academy of Otolaryngology-Head and Neck Surgery (AAO-HNS) scale (grades A and B indicate serviceable hearing).24 Both scales rely on assessments of the speech discrimination score (SDS), pure-tone audiometry (PTA), and speech reception threshold (SReT).25 Albeit common, these metrics require both patient participation and formal audiometry. Moreover, many studies do not have a standardized timeline of audiometric assessments. A similar issue is found with respect to other CN comorbidities.26
To answer these questions about tumor control and CN comorbidities following hSRT and SRS, a systematic review of the literature was carried out. Two groups of studies were identified: (i) those where hSRT was analyzed by itself, and (ii) those where hSRT and SRS were directly compared, overall yielding two sections of this study. Outcome measures assessed relate to tumor control and post-procedure neurologic morbidities.
Materials and Methods
Search Strategy and Selection Criteria
We conducted and reported this systematic review in accordance with the Preferred Reporting Items for Systematic Reviews and Meta-Analyses (PRISMA). An initial search was conducted in PubMed in order to identify relevant Medical Subject Headings (MeSH) and free-text search terms based on the eligibility criteria, potentially relevant studies, and personal expertise. Then, an experienced medical librarian (D.W.) developed and conducted all searches, using Ovid MEDLINE, EMBASE, CINAHL, and Cochrane Reviews. A second librarian reviewed the searches for completeness and accuracy. The Supplementary Materials include the full electronic database names, search dates, and search strategies. Results were delivered via Covidence (www.covidence.org), where authors first screened abstracts and then full texts for applicability. This study was registered in PROSPERO (protocol # CRD42020200477).
We included all peer-reviewed publications obtained from the keyword search specified in the Supplementary Materials that met the following criteria: (1) studies were in English and available when the search was conducted; (2) outcome was not limited to quality of life assessment but included, at least, either a functional (CN status) outcome or tumor control. Studies were grouped into two cohorts: (i) studies where hSRT is assessed by itself, and (ii) studies where hSRT is compared to single-dose SRS. Studies where conventional fractionation (eg, 1.8-2.0 Gy/fraction in 20+ fractions) or SRS assessed by themselves or compared to each other were excluded, as they were not within the scope of this review. Studies were not clustered based on hypofractionation regimens, albeit results are presented separately.
Primary outcomes assessed included rate of tumor control (defined as no need for further intervention or lack of symptom progression, as specified in each manuscript). Assessed toxicities included trigeminal nerve impairment, facial nerve impairment, serviceable hearing, and the presence of tinnitus. Secondary outcomes included the presence of postoperative hydrocephalus requiring ventriculoperitoneal shunting (VPS).
Data Collection
Abstract and full-text review was carried out independently and blindly by two authors (U.T., S.G.). Conflicts were resolved with discussion. Data were then extracted manually from the included articles and stored electronically. Data fields extracted included study characteristics (authors, publication year, study design, number of patients per treatment group), patient biographical characteristics (age, gender, NF2 status, prior therapy), fractionation regimen (number of fractions, dose per fraction, total dose, isodose line), tumor characteristics (volume, maximal diameter), tumor response (reported rate of tumor control, median progression-free survival [PFS], 5-year PFS), length of follow-up (median and range), rate of serviceable hearing (GR 1 or 2) before and after treatment, trigeminal symptoms before and after treatment, facial nerve symptoms before and after treatment, and the presence of tinnitus before and after treatment.
Data Analysis
Meta-analyses for the complication proportions and complication odds ratios (OR) were conducted for hypofractionated stereotactic radiation therapy (hSRT) only studies and studies directly comparing hSRT and SRS, respectively. Statistical heterogeneity was tested through the chi-square test (ie, Cochrane Q test) and a P value ≤.20 was used to indicate the presence of heterogeneity (since tests for statistical heterogeneity are often underpowered, this more conservative approach was used). Statistical heterogeneity was also assessed by the inconsistency statistic (I2). However, regardless of the heterogeneity test P value or I2 statistic percentage, a random-effects analysis was used to calculate the pooled proportions and OR. The random-effects analysis allows for more variability in the individual study proportion/OR estimates when generating the pooled proportion/OR and is more conservative. To assess complication proportions in studies that focused on hSRT only, the results of each study were expressed as binary proportions with exact 95% confidence intervals, except when all patients had the complication and a one-sided 97.5% confidence interval was expressed. For the hSRT only studies that had pre- and post-radiotherapy (RDT) complication proportions, we conservatively treated the pre and post groups as independent to facilitate an OR computation. The results of each study were expressed as OR comparing the post-radiotherapy proportion to the pre-radiotherapy proportion with exact 95% confidence intervals. For the complications of interest in the two-arm studies (hSRT vs SRS), the results of comparing the hSRT complication proportion to the SRS complication proportion was expressed as an OR, with exact 95% confidence intervals. A continuity correction of 0.5 was used in studies with zero cell frequencies.
For each meta-analysis of a specific complication type, the presence of publication bias was evaluated through a funnel plot. Egger’s test and the Begg-Mazumdar rank-correlation test were used to statistically assess the presence of publication bias, as described in the Supplementary Materials. All analyses were conducted with the use of R Version 3.6.2 (R Foundation for Statistical Computing, Vienna, Austria), as shown in the Supplemental Materials.
Results
A total of 3237 studies were identified. After de-duplication and initial screening, 509 full-text studies were assessed for eligibility, resulting in 21 studies where hypofractionation was assessed by itself18–20,27–44 and 13 studies where single fraction and hypofractionation were compared.12,45–56 General study characteristics and primary and secondary outcomes are described in Table 1 (hSRT) and Table 2 (two-arm studies). Rarely did studies reliably report on the incidence of brainstem toxicity or vestibular symptoms; thus, these measures could not be analyzed (Figure 1).
Studies on Hypofractionation
| First Author, y | N | Fraction. Regimen (Isodose Line) | Age Mean; Range | Prior Therapy | NF2 (%) | Tumor Vol. (cc); Max. d (mm) | Mean FU; Range (mo) | Tumor Control (5-y PFS) | CN V Deficit | CN VII Deficit | Serviceable Hearing | Tinnitus | Post-XRT Hydrocephalus | ||||
|---|---|---|---|---|---|---|---|---|---|---|---|---|---|---|---|---|---|
| Pre-RDT | Post-RDT | Pre-RDT | Post-RDT | Pre-RDT | Post-RDT | Pre-RDT | Post-RDT | ||||||||||
| Vernimmen,20 2008a | 51 | 3 × 4.7-11 Gy (85%) | 50; 20-85 | 27% | 10% | 5.9; N/A | 72; 24-149 | 96% (98%) | 23.5% | 23.5% | 39.2% | 31.4% | 43.1% | 42% | N/A | N/A | N/A |
| Gallogly,29 2018a | 22 | 3 × 7 Gy (80%) | 53.7; N/A | N/A | 0% | N/A; 1.4 | 52.3; N/A | 86.4% (76.9%) | 0% | 4.6% | 0% | 0% | 50.% | 36.4% | 45% | 45% | 0% |
| Williams,44 2002b | 111 | 5 × 5 Gy (80%) | 54.1; 22-81 | 3.2% | 0.8% | 1.4; N/A | 21.6; 12-68.4 | N/A | Serviceable hearing: 64.3%GR: 1 = 16; 2 = 20; 3 = 16; 4 = 2; 5 = 2 | Serviceable hearing: 58.9%GR: 1 = 9; 2 = 24; 3 = 14; 4 = 6; 5 = 3 | N/A | ||||||
| 14 | 10 × 3 Gy (80%) | 8.1; N/A | N/A | ||||||||||||||
| Williams,42 2003b | 70 | 5 × 5 Gy (80%) | 56.6; 24.3-81.6 | 5% | 1·25% | N/A; 1.4 | 19.2; 3.6-45.6 | N/A | 0% | 0% (2.5% transient) | 0% | 0% | 19%SDS: 68.4%SReT: 37.5 | 18%SDS: 67.6%SReT: 40.7 | N/A | N/A | N/A |
| 10 | 10 × 3 Gy (80%) | N/A; 2.8 | N/A | N/A | N/A | N/A | |||||||||||
| Song,36 1999a | 30 | 5 × 5 Gy (80-90%) | 57; 22-77 | 13.3% | 3.3% | 1.1; (0.5-2.7) | N/A; 6-44 | 100% (N/A) | 6.7% | 3.3% | 16.7% | 16.7% | 40% | 52% new loss | N/A | N/A | N/A |
| Chen,18 2018a | 47 | 5 × 5 Gy (80%) | 61; 25-82 | 45.6% | N/A | 2.0; 2.7 | 61; 9-92 | N/A (90%) | 23.4% | 27.7% | 19% | 19% | 40.0% | 31.6% | 49% | N/A | 2.1% |
| Patel,41 2017a | 383 | 5 × 5 Gy (80%) | 54.3; 18-82 | N/A | N/A | N/A | 72; 13.6-181.5 | 78.3% (N/A) | 16.4% | N/A | 4.2% | 12% | 66% | 36.2% | 67.9% | 69.5% | 0.3% |
| Kapoor,30 2011b | 340 | 5 × 5 Gy (80%) | 54; N/A | N/A | N/A | 2.7; N/A | 56; 18-138 | 67% (91.7 PFS) | 17.3% | 2.8% | 2.4% | 1.6% better; 1.6% worse | N/A | N/A | 58.5% | N/A | N/A |
| 36 | 10 × 3 Gy (80%) | N/A | N/A | ||||||||||||||
| Kranzinger,19 2014b | 29 | 7 × 4 Gy (90%) | 57; 32-75 | 27.6% | 0% | 0.9; 1.4 | 89.5; N/A | 96.6% (N/A) | 0% | 6.9% | 0% | 10.3% | 79.3%SDS: 74.3%PTA: 39.3 | 50%SDS: 38.1%PTA: 65.9 | Almost all patients, unchanged | N/A | |
| Mahadevan,34 2011a,c | 10 | 5 × 5 Gy (83%) | N/A | N/A | N/A | 1.9; N/A | 19; N/A | 100% (N/A) | N/A | N/A | 0% | 0% | 100% | 100% | N/A | N/A | N/A |
| Sakanaka,35 2010a | 12 | 13 × 3 Gy (N/A) | 52; 32-73 | 53.8% | 0% | 1.7; 1.3 | 87; 24-133 | 100% (N/A) | N/A | 0% | N/A | 0% (7.7% transient) | 15.4%PTA: 32 | 0%PTA: 59.5 | N/A | N/A | 0% |
| 1 | 10 × 3 Gy (N/A) | ||||||||||||||||
| 11 | 5 × 4 Gy (N/A) | 51.5; 30-75 | 33.3% | 0% | 5.2; 1.9 | 39.5; 24-64 | 91.7% (N/A) | N/A | 0% | N/A | 0% | 41.7%PTA: 18 | 80%PTA: 40 | N/A | N/A | 8.3% (not shunted) | |
| 1 | 6 × 4 Gy (N/A) | ||||||||||||||||
| Williams,38 2002b | 131 | 5 × 5 Gy (80%) | 54.1; 22.1-81.0 | 4.7% | 2.·7% | 1.5; 1.5 | 22.8; 12-70.8 | N/A | 0% | 0% (1.3% transient) | 0% | 0% | 63.9%SDS: 61.3%PTA: 44.8SReT: 44.9 | 55.6%SDS: 78.1%PTA: 59.5SReT: 46.4 | N/A | N/A | N/A |
| 18 | 10 × 3 Gy (80%) | 8.7; 2.9 | 0% | 0% | N/A | ||||||||||||
| 1 | 20 × 2 Gy (80%) | 26.3; 4.1 | 0% | 0% | N/A | ||||||||||||
| Teo,37 2016a | 30 | 3 × 6 Gy (80%) | 44; 17-82 | 36.7% | 20% | N/A; 3.49 | 97; 7-175 | 80% (81%) | N/A | N/A | 16.7% | 23.3% | 43.3%GR 1 + 2: 83.3% | 16.7%GR 1 + 2: 76.7% | N/A | N/A | 10% |
| Chang,28 2005b | 61 | 3 × 6-7 Gy (N/A) | 54; 27-79 | 13.1% | 0% | N/A; 18.5 | 48; 36-62 | 98% (91.4%) | 0% | 0% | 1.5% | 1.5% | 57.3%SDS: 72.2%PTA: 34.9 | 74.3%SDS: 60.6%PTA: 48.8 | N/A | N/A | N/A |
| Kocak,32 2016a | 41 | 1-7 × 4.25-13 Gy (85%) | 53; 21-80 | 22.0% | 0% | N/A; 20 | 25; 9-44 | 97·6% (N/A) | 0% | 0% | 19.5% | 22.0% | N/A | 21.9% | 63.4% | 43.9% | 2.4% |
| Lederman,33 1997a | 23 | 4-5 × 4-6 Gy (90%) | 62; 35-83 | N/A | N/A | 1.8; 17 | 27; 6-37 | 100% (N/A) | N/A | N/A | N/A | No new change | N/A | 4.3% new loss | N/A | N/A | N/A |
| 16 | 4-5 × 4-5 Gy (90%) | 56; 35-88 | N/A | N/A | 14.4; 37 | 28; 14-35 | 100% (N/A) | N/A | N/A | N/A | No new change | N/A | 6.3% new loss | N/A | N/A | N/A | |
| Casentini,27 2015a | 25 | 2-3 × 6-7 Gy (70-85%) | 65; N/A | 15.2% | 6.1% | 9.3; N/A | 48; 12-111 | 58% (83%) | 21.2% | 24.2% | 27.3% | 30.3% | 24% | 21% | 61% | 61% | 6% |
| 3 | 4 × 3.5-4.2 Gy (70-85%) | 69; N/A | 10.4; N/A | ||||||||||||||
| 5 | 5 × 3.9-4 Gy (70-85%) | 74; N/A | 13.4; N/A | ||||||||||||||
| Hansasuta,40 2011a | 383 | 1-5 × 4.8 Gy (80%) | 54; 11-91 | 10.7% | 3.9% | 1.1; N/A | 43.2; 12-120 | 97% (96%) | 9.7% | 10.7% | 8.9% | 9.1% | 78% | 76% | 49.1% | N/A | 1.0% |
| Feng,39 2019a | 41 | 3 × 6 Gy (80%) | 57.4; 26-90 | N/A | 0% | 4.9; N/A | 56.6; 35-88 | N/A (82.5%) | N/A | 17.1% | N/A | 4.9% | 100% | 75.5% | N/A | N/A | N/A |
| Ju,43 2008a | 21 | 3 × 6-6.6 Gy (83%) | 54; 27-79 | 4.8% | 33.3% | 5.4; N/A | 15; 6-25 | 100% (N/A) | 4.8% | 4.8% | 14.3% | 14.3% | 4.8%d | 4.8%d | 81.0% | 81.0% | 0% |
| Karam,31 2013a | 37 | 3-5 × 5-7 Gy (80%) | 58; 31-85 | 0% | 0% | 1.0; N/A | 52.2; 9-108 | 100% (N/A) | 3% | 5.4% | 0% | 5.4% | 73.7% | 57.9% | 43.2% | 48.6% | 0% |
Abbreviations: CN, cranial nerve; FU, follow up; GR, Gardner-Robertson; NF2, neurofibromatosis type 2; PFS, progression-free survival; PTA, pure-tone audiometry; RDT, radiotherapy; SDS, speech discrimination score; SReT, speech reception threshold; XRT, radiation..
aIndicates retrospective study.
bIndicates prospective study.
cStudy assessed meningiomas as well. Patients were intact upon entry.
dDid not differentiate between serviceable and non-serviceable hearing. Percentages refer to “impairment.”
Studies Comparing Single-Dose Radiosurgery and Hypofractionation
| First Author, y | N | Fraction. Regimen (Isodose Line) | Age Mean; Range | Prior Therapy | NF2 (%) | Tumor Vol. (cc); Max. d (mm) | Mean FU; Range (mo) | Tumor Control (5-y PFS) | CN V Deficit | CN VII Deficit | Serviceable Hearing | Tinnitus | Post-XRT Hydrocephalus | ||||
|---|---|---|---|---|---|---|---|---|---|---|---|---|---|---|---|---|---|
| Pre-RDT | Post-RDT | Pre-RDT | Post-RDT | Pre-RDT | Post-RDT | Pre-RDT | Post-RDT | ||||||||||
| Mandl,56 2010a,b | 8 | 1 × 12.5 Gy (80%) | 54.1; 12-80 | 31% | 10.3% | 15.3; 33 | 36; 12-120 | 84% (82%) | 41% | 48.2% | 28% | 44.8% | 31.0% | 10% | 17% | N/A | 17.2% |
| 21 | 5 × 5 Gy (80%) | ||||||||||||||||
| McWilliams,47 2011c | 13 | 1 × 12.5 Gy (80%-90%) | 73; 52-82 | N/A | N/A | N/A; 11 | 15 | 92% (N/A) | SDS; PTA; SReT: 68; 56.8; 51.2 | SDS; PTA; SReT (% worse): 39.1 (92.3%); 69.3 (84.6%); 64.2 (90%) | N/A | ||||||
| 10 | 5 × 5 Gy (80%-95%) | 67.5; 41-80 | N/A | N/A | N/A; 14 | 12.5 | 80% (N/A) | SDS; PTA; SReT: 48.8; 56.9; 49.5 | SDS; PTA; SReT (% worse): 35.6 (50.0%); 64.6 (80%); 57 (69.2%) | N/A | |||||||
| Schneider,52 2015b,d | 40 | 1 × 12-14 Gy (N/A) | 62.5; 39-85 | 0% | 0% | 1.03; N/A | 20.4; 4.8-100 | 92.5% (N/A) | N/A | N/A | 13.6% | N/A | 90.1% deficit | N/A | 56.8% | N/A | 2.5% |
| 122 | 5 × 5 Gy (80%) | 56; 30-88 | 0% | 0% | 0.96; N/A | 63.6; 6-144 | 93.44% (N/A) | 1.6% | |||||||||
| Arribas,53 2015b | 155 | 1 × 12 Gy (N/A) | 58.4; 19-87 | N/A | 3.6% | 2.76; N/A | 80.4; 12-175 | 95% (97%) | 10% | 8% | 7% | 7% new sx. | 19% | 68.7% | 53.9% | 54.5% | 5% |
| 12 | 6-28 × 1.8-5 Gy (N/A) | 0% | |||||||||||||||
| Meijer,50 2003c | 49 | 1 × 10-12.5 Gy (80%) | 49; N/A | N/A | N/A | N/A; 25 | 30; N/A | N/A (100%) | 16% | 8% | 16% (84% HB GR I) | 7% | 56% | 75% | N/A | N/A | 2% |
| 80 | 5 × 4-5 Gy (80%) | 63; N/A | N/A | N/A | N/A; 26 | 35; N/A | N/A (94%) | 2% | 3% | 61% | N/A | N/A | 0% | ||||
| Collen,46 2011c,e | 78 | 1 × 11-14 Gy (80%) | 59; 25-88 | N/A | 2.6% | 1.7; 16.6 | 56; 7-129 | 95% (95%) | 9.0% | 14.1% | 11.5% | 25.6% | 44.9% | 36.8% (82% 4-y retention) | 29.5% | N/A | 5% |
| 42 | 10 × 3-4 Gy (95%) | 57; 22-84 | N/A | 14.6% | 6.3; 24.6 | 73; 6-136 | 16.7% | 19.0% | 23.8% | 26.1% | 45.2% | 26.7% (59% 4-y retention) | 31.0% | N/A | |||
| Badakhshi,45 2014a,b | 190 | 1 × 13.5 Gy (80%) | N/A | 18.4% | 1.2% | N/A | 33.8 (3-180) | 88% (N/A) | 24.4% | 27.6% | 18% | 20.8% | 18% | 17.2% | 57.2% | 54.4% | N/A |
| 35 | 7 × 5 Gy (80% | N/A) | N/A | 90% (N/A) | N/A | ||||||||||||
| 25 | 11 × 3.8 Gy (80%) | N/A | N/A | 100% (N/A) | N/A | ||||||||||||
| Meijer,48 2008a,b | 7 | 1 × 10-12.5 Gy (80%) | 32; 11-70 | N/A | 100% | N/A | 51 (12-109) | 100% (N/A) | 4% | 4% (no new deficit) | 24% | 24% (no new deficit) | SDS; PTA: 68.3; 51.5 | SDS; PTA (% worse): 40.7 (60.0%); 77.5 (80%) | N/A | N/A | N/A |
| 18 | 5 × 4-5 Gy (80%) | N/A | 100% (N/A) | N/A | N/A | N/A | |||||||||||
| Meijer,49 2008b,d | 14 | 1 × 12.5 Gy (80%) | 66; N/A | N/A | N/A | 3.1; N/A | 50 (32-78) | 85.7 % (N/A) | N/A | N/A | N/A | N/A | N/A | N/A | N/A | N/A | N/A |
| 31 | 5 × 5 Gy (80%) | 52; N/A | N/A | N/A | 83.8% (N/A) | N/A | N/A | N/A | N/A | N/A | N/A | N/A | N/A | N/A | |||
| Santa Maria,51 2019b,f | 23 | 1 × 13-14 Gy (80%) | 53.9; 13-91 | 10% | 4.4% | 2.2; 16.2 | 66 (12-225.6) | N/A (N/A) | N/A | N/A | N/A | N/A | SDS; PTA: 60.3%; 47.3 | SDS; PTA (% worse): 82% (65%): 63.6 (65%) | N/A | N/A | N/A |
| 434 | 3 × 6-7 Gy (80%) | N/A (N/A) | N/A | N/A | N/A | N/A | N/A | N/A | N/A | ||||||||
| Puataweepong,12 2013b | 39 | 1 × 12-13 Gy (80%) | 47; 16-71 | 64% | 5% | 0.96; 16 | 61 (12-143)e | N/A (95%) | 23% | 15% | 44% | 41% | 10% | 75% (likelihood of preservation) | N/A | N/A | 0% |
| 79 | 3-10 × 3-6 Gy (80%) | 50; 14-78 | 58% | 8% | 3.9; 25 | N/A (100%) | 20% | 15% | 27% | 20% | 42% | 87% (likelihood of preservation) | N/A | N/A | 1% | ||
| Wong,55 2018b | 46 | 1 × 13 Gy (N/A) | 53.7; 17-78 | 38% | 3.9% | 1.68; N/A | 40.6 (4.6-90.7) | 100% (N/A) | 23.4% | 2% worse | 26.0% | 2% worse | 11% | 11% | N/A | N/A | 0% |
| 31 | 5 × 5 Gy (N/A) | 96.8% (N/A) | 6% worse | 6% worse | 19% | 10% | N/A | N/A | 3% | ||||||||
| Tang,54 2018b | 29g | 1 × 12.5 Gy (51%) | 47; 15-65 | 3.4% | N/A | 3.03; N/A | 19 (6-45) | 100% (N/A) | 0% | 6.9% | 0% | 0% | 69.0%; PTA: 39.9 | 31.0%; PTA: 48 | N/A | N/A | N/A |
| 29g | 3 × 6.3-7 Gy (53%) | 43; 19-61 | 0% | N/A | 2.81; N/A | 26 (5-56) | 96.6% (N/A) | 0% | 3.4% | 0% | 3.4% | 93.1%; PTA: 34.1 | 48.3%; PTA: 55.1 | N/A | N/A | N/A |
Abbreviations: CN, cranial nerve; FU, follow up; GR, Gardner-Robertson; HB, House-Brackmann; NF2, neurofibromatosis type 2; PFS, progression-free survival; PTA, pure-tone audiometry; RDT, radiotherapy; SDS, speech discrimination score; SReT, speech reception threshold; XRT, radiation..
aStudy did not clearly separate between regimens with respect to outcome.
bIndicates retrospective study.
cIndicates prospective study.
dStudy focused on volumetric outcomes; did not assess CN response thoroughly.
eAuthors did not separate between normal fractionation and hypofractionation. They are reported together here.
fStudy focused on hearing only.
gPatients selected from a pool of 561 patients after propensity score matching.
A total of 21 studies that focused solely on hSRT were selected (Table 1). Of these, 7 studies clustered patients based on fractionation regimens. Such a separation, however, was not necessarily maintained when assessing outcomes.27,30,33,35,38,42,44 Six studies were prospective; 15 were retrospective. Overall, hSRT was utilized on 2014 patients. Great variability in outcome reporting was observed, with 18 studies reporting tumor control outcomes, 17 mentioning CN V deficits, 20 discussing CN VII deficits, 20 mentioning hearing outcome, 10 discussing tinnitus, and 10 mentioning post-procedural hydrocephalus. With respect to hearing, some studies mentioned serviceable hearing only; others gave SDS, PTA, and SReT metrics. Cochlear dose was assessed in only two studies.18,39
Sixteen studies (1571 patients) were included that evaluated tumor control. The combined control rate was 94% (95% CI: 88%, 99%) (Figure 2A). Heterogeneity, however, was significant (I2 of 93%). Eight studies (668 patients) assessed 5-year PFS, for a combined rate PFS proportion of 89% (95% CI: 83%, 95%) (Figure 2B). Heterogeneity was, again, present and significant (I2 of 76%).
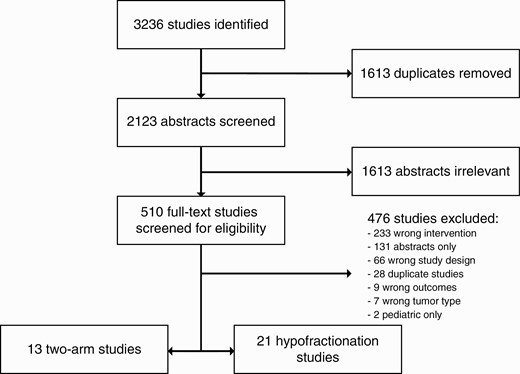
Scheme of search results and assessment of eligibility.
Significant comorbidities were observed before and after treatment as well. For all primary endpoint comorbidities, OR were calculated as post- over pre-treatment symptom incidence. Only five studies (548 patients) consistently discussed tinnitus and, thus, were included in the analysis. Heterogeneity was low (I2 of 0%), for a combined OR of 1.0 (95% CI: 0.78, 1.29, P = .99) (Figure 2C). Eighteen studies were included to analyze serviceable hearing (1393 patients before hSRT, 1177 patients after). Overall, moderate heterogeneity was observed (I2 of 57·1%), for a combined OR of 0.60 (95% CI: 0.44, 0.83, P = .002)—ie, hearing outcomes were worse following treatment (Figure 2D). Trigeminal impairment was assessed consistently in 14 studies (1370 patients), for a combined OR of 0.93 (95% CI: 0.48, 1.83, P = .89), with high heterogeneity (I2 of 63%) (Figure 2E). Facial nerve impairment was consistently assessed in 15 studies (1695 patients), for a combined OR of 1.30 (95% CI: 0.98, 1.73, P = .11); heterogeneity was low (I2 of 5%) (Figure 2F). Incidence of post-radiation hydrocephalus requiring VPS was assessed in 10 studies (1022 patients), for an overall incidence below 1% (95% CI: 0%, 2%). Heterogeneity was moderate (I2 of 36%) (Supplementary Figure 1).
A total of 13 studies comparing hSRT and single-dose SRS were selected (Table 2). One study further clustered patients depending on the fractionation regimen received45; other studies clustered patients together if more than one regimen was utilized. Not all studies clustered outcome by regimen used, in which case those studies were necessarily excluded from meta-analysis. Only seven studies gave tumor control measures separating SRS from hSRT. Only five did so for serviceable hearing, trigeminal weakness, and facial weakness. None did so for tinnitus and, as such, this measure had to be excluded from analysis. Lastly, five studies separated hydrocephalus requiring VPS by treatment group. Cochlear dose was recorded in only three studies, with two indicating their goal to keep cochlear dose below 5 Gy53,55; one study reported maximal dose at 4.0 Gy.54
With respect to gross tumor control, only seven studies (276 hSRT, 339 SRS) could be analyzed. Overall, the tumor control OR comparing hSRT to SRS was 0.95 (95% CI: 0.46, 1.98, P = .84); heterogeneity was low (I2 of 0%) (Figure 3A). With respect to serviceable hearing, when comparing hSRT (n = 261) to SRS (n = 241) studies differed by pre-treatment symptom incidence (OR = 2.67; 95% CI: 0.99, 7.2, P = .05, I2 of 66.4%) (Supplementary Figure 2A); however, they did not differ with respect to postoperative serviceable hearing, given an OR of 1.23 (95% CI: 0.49, 3.07; P = .65) (Figure 3B). Heterogeneity was high (I2 of 74%). When comparing hSRT (n = 261) to SRS (n = 241), studies did not differ on trigeminal impairment, either pre-treatment (OR = 1.09; 95% CI: 0.67, 1.8, P = .72, I2 of 0%) (Supplementary Figure 2B) or post-treatment (OR = 0.99; 95% CI: 0.57, 1.71, P = .96, I2 of 0%) (Figure 3C). With respect to facial nerve impairment as assessed in five studies, when comparing hSRT (n = 254) to SRS (n = 237), the OR of post-treatment impairment was 0.73 (95% CI: 0.40, 1.35, P = .32) (Figure 3D). Heterogeneity was low (I2 of 26%). Only two studies gave separate measures of pre-treatment facial nerve impairment and, as such, no analysis was done.12,46 Finally, five studies (324 hSRT, 329 SRS) assessed risk of post-treatment hydrocephalus, for a combined OR of 0.86 (95% CI: 0.23, 3.22, P = .83, I2 of 0%) (Supplementary Figure 3).
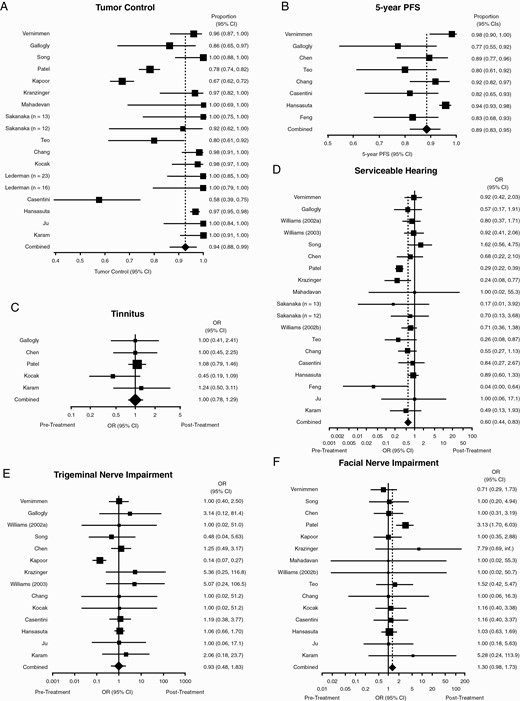
hSRT performance. Forest plots summarizing (A) crude tumor control rates and (B) 5-year PFS. (C-F) Forest plots summarizing pre- and post-treatment odds ratios of (C) tinnitus; (D) tinnitus; (E) trigeminal nerve impairment; and (F) facial nerve impairment. OR <1 indicates how the event is more likely to occur before treatment than after. Abbreviations: hSRT, hypofractionated stereotactic radiotherapy; OR, odds ratios; PFS, progression-free survival.
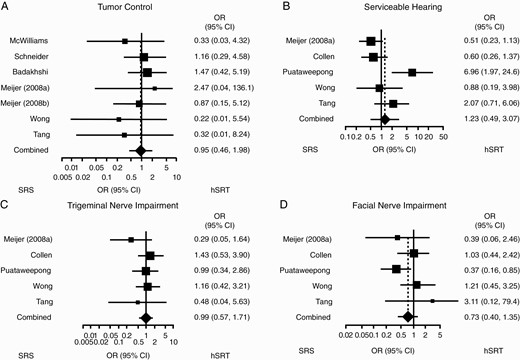
Comparison between hSRT and SRS. Forest plots summarizing postoperative odds ratios of (A) tumor control; (B) serviceable hearing; (C) trigeminal impairment; and (D) facial impairment. OR <1 indicates how the event is more likely to occur with SRS rather than hSRT. Abbreviations: hSRT, hypofractionated stereotactic radiotherapy; OR, odds ratios; SRS, stereotactic radiosurgery.
Overall, our results show how hSRT and SRS have similar tumor control and toxicity outcomes. In particular, hSRT—as determined by studies that focused solely on this treatment modality—achieved tumor control in 94% of cases and, with the exception of serviceable hearing, did not result in worse post-treatment cranial neuropathies.
Discussion
Overall, 3237 abstracts were screened eventually yielding 21 studies on hSRT and 13 where hSRT was compared to SRS. A wide variety of fractionation regimens were used, ranging from 10 doses of 3 Gy each to 3 doses of 7 Gy each; the 5 × 5 Gy regimen was the one most commonly used. Given the lack of data indicating the superiority of a regimen to others, this variability is in part to ascribe to the provider’s level of comfort with a specific regimen. In studies focusing on hSRT alone, with the exception of serviceable hearing, hSRT did not significantly change the incidence of any CN comorbidities, achieving high tumor control (94%). Although comprehensive data on hSRT alone are scarce, our findings are consistent with published literature.4,30,40 The studies included in our search and others published since rarely found any difference in outcomes from hSRT or SRS.45,57 Importantly, most studies selected were retrospective. It is important to note how, from 13 two-arm studies selected, only 7 reliably reported tumor control incidence separated by treatment group and only 5 did so for CN comorbidities. Unfortunately, vestibulopathy was sporadically assessed in the studies here discussed, thus making statistical analysis not possible.45,55,57
SRS, SRT, and, more recently, hSRT are utilized regularly for VS treatment, either as adjuncts or alternatives to surgical resection.5,11 Compared to microsurgery, these treatment modalities are less invasive, better tolerated, and less likely to injure CN.58 Hearing outcomes in radiation therapy have to be compared against the natural history of observation or surgery of VS. Data indicate that for growing or radiographically stable tumors, the rate of hearing preservation at 5 years is approximately 30%, with increased hearing loss over time.59 For surgery, the rates of hearing preservation vary substantially and depend largely on preoperative hearing quality, surgeon experience, tumor size, and surgical approach.1,10,60 Ultimately, this work is not intended to help adjudicate between surgical and radiosurgical treatment options but rather to distinguish treatment outcomes between two different modalities of radiotherapy.
Initial good hearing status is generally believed to be a positive prognostic factor of post-treatment hearing outcome, especially when VS are managed expectantly.16 The exact role of SRS in long-term hearing preservation remains unclear, especially on long-term follow-up, as it becomes challenging to parse out treatment-related toxicities and failures from natural disease progression—further longitudinal review studies will be needed to determine the outcome of this treatment modality.51 Longitudinal data on hSRT are still missing, but our initial findings seem to suggest that hypofractionated radiation regimens will also result in hearing deterioration. Overall, these findings caution against the use of prophylactic radiation therapy (either single dose or fractionated) in those patients whose tumor course is unclear, as (highly heterogeneous) published data show that 30% of incidentally found VS will not grow.61–64
The morbidity associated with SRS and hSRT can be largely attributed to the delivery of high doses of radiation to nontarget normal tissues contiguous to VS. Even though the doses associated with SRS and hSRT are not high in absolute terms compared to the regimens used for other malignancies, it is postulated that local edema and mass effect can result in damage to exquisitely sensitive nearby structures such as CN. Over time, developments in radiography, treatment planning software, and the equipment used to deliver treatment have resulted in lower doses to the cochlea, facial and trigeminal nerves, and brainstem. Imaging advances resulted in more shots being used to create more conformal plans; this resulted in less cranial neuropathies following SRS.65 Better hearing preservation with lower doses delivered to the cochlea and improved treatment planning capabilities may provide better long-term hearing than historical practice reports would indicate. For frameless treatments on linear accelerators, the difficulties of establishing stereotactic accuracy over the period of time required to obtain imaging, plan, and deliver treatments meant that the high dose radiosurgery volumes that were needed to account for these sources of inaccuracy would often include these normal tissues. Framelessness permitted (indeed, necessitated) fractionation to decrease the risk of iatrogenic morbidity. Continuous developments of the delivery platforms are necessary to optimize delivery, as framelessness cannot, with current technologies, have the same accuracy as a frame-based approach where CT and MRI are performed with the same frame in place. Further, significant variability exists across centers in technologies used, further adding heterogeneity to the data.
The use of SRS and hSRT is somewhat limited by tumor size, as these techniques have been preferentially used for small- and medium-sized VS. In this review, however, three studies focused specifically on “large” tumors.27,37,56 Further studies are necessary to thoroughly assess the role of radiation therapy in treating large VS. It remains unclear what size, if any, precludes radiotherapy treatment, if large tumor size predisposes to a worse outcome, and, finally, how patient with large tumors fare following treatment in the long term. However, it is important to note that in patients with brainstem compression and associated symptoms, surgical resection remains the gold standard66; radiotherapy rarely causes substantial acute volumetric reduction in VS, and relief of mass effect is among the primary reasons for open surgical intervention.
A second cohort that warrants attentions is that of NF2-associated VS. NF2 patients tend to present with bilateral VS and, as a consequence, worse hearing outcomes and, potentially, deafness. Further, they tend to be younger than their sporadic counterparts and have other comorbidities at diagnosis (eg, NF2-associated non-VS tumors).67 These patients also carry a theoretical higher risk of radiation-induced secondary malignancy.68–70 It remains unclear whether NF2-associated VS respond similarly to their sporadic counterpart to radiation.71–73
This study has important limitations. First, none of the studies analyzed were randomized-controlled trials (RCTs). Second, a majority of studies had a small number of patients enrolled and, at times, did not distinguish outcomes based on therapy used—eventually leading to exclusion from analysis. Further, different studies used a range of radiation regimes (as summarized in Tables 1 and 2), without necessarily clustering outcomes by specific radiation regimen, thus adding heterogeneity to our results. It is unfortunate that the literature on hSRT radiation therapy for VS lacks RCTs; however, we do believe that the summary here presented on hSRT and the comparison between hSRT and SRS significantly adds to the existing literature and poses hSRT as a valid and equal alternative to SRS. Furthermore, the technical requirements for hSRT relative to single fraction are decidedly less demanding; our data indicate that hSRT is likely a reasonable alternative to single-fraction SRS in selected patients (eg, those without extremely large tumors that would preclude to the safe administration of radiation), especially as the delivery system is further developed and ease of access increases.
Conclusions
Our study shows how both single-dose and hypofractionation radiosurgical regimens achieve similar results in treating VS, with sparing of CN function and worsening hearing outcomes. Given the less demanding technical requirements associated with hSRT, this treatment modality should be considered in further clinical practice.
Funding
A.A. and P.J.C. were both partially supported by the National Center for Advancing Translational Science of the National Institute of Health under award number UL1TR002384.
Conflict of interest statement. The authors have no conflict of interest, financial or otherwise, to disclose. This paper is the first one, of two, being submitted.
