


Abstract
Patients with glioma are highly symptomatic and often have functional limitations from the time of diagnosis. Measuring health status may have value in determining impact of disease. This study provided a description of health status and utility scores in glioma patients throughout the illness trajectory using the EQ-5D (a functional measure of general health status). Furthermore, it evaluated the information provided by the MD Anderson Symptom Inventory-Brain Tumor (MDASI-BT; a measure of symptom burden and interference) in describing health-related quality of life as assessed by the EQ-5D.
Glioma patients completed the EQ-5D and MDASI-BT. Disease and clinical details were collected by medical record review. Linear regression evaluated whether MDASI-BT scores adequately predict patient health outcomes measured by the EQ-5D.
The sample included 100 patients (65% male, 78% with a glioblastoma, median age 52 [range, 20–75], 56% in active treatment). Seventy-two percent of patients reported functional limitations in at least 1 area. Extreme cases reported inability to perform usual activities (8%) and significant anxiety/depression (5%). The MDASI-BT neurologic factor and activity-related interference (walking/activity/work) explained 52% of the variability in the EQ-5D in this patient population while adjusting for the effect of tumor grade, recurrence status, and performance status.
The majority of glioma patients reported at least 1 functional limitation on the EQ-5D. Over half of the variance in the EQ-5D was explained by the MDASI-BT, performance status, tumor grade, and recurrence status. The resultant model demonstrates the significant contribution of symptom burden on health status in glioma patients.
Understanding the impact of a brain tumor diagnosis on health-related quality of life (HRQOL) and general health status provides important insights into the patient’s experience with a glioma. Patients with malignant glioma are often highly symptomatic; one study reported that 40% of patients had symptoms that they reported as moderate-severe in severity.1 Often these symptoms and functional limitations are present from the time of diagnosis and continue throughout the illness trajectory. Symptom burden interferes in different aspects of a patient’s life including general level of activity, work, and mood. Furthermore, the clinical relevance of the burden associated with the occurrence of symptoms is underscored by the findings that patient-reported interference related to activities such as work and walking has been shown to be predictive of tumor progression.2
The EQ-5D3 is a tool designed to measure general health. Conceptually, the EQ-5D provides a holistic view of health that includes its medical definition as well as independent physical, emotional, and social functioning.4 Research on the EQ-5D among glioma patients is primarily limited to evaluation within a surgical context5–8 or impact of specific therapies on solid tumors.9,10 Estimates of health status have been provided by mapping the EQ-5D onto different HRQOL measures, such as the EORTC QLQ-30,11,12 SF-36,12,13 and PROMIS,14 but not to HRQOL measures specific to the primary brain tumor population.
Generic measures of health states are popular in cost utility analysis in which the cost of health care interventions are compared to the patient outcomes.15 However, the utility of measuring general health status also has value in determining the impact of disease, such as cancer. Health status has been found to be responsive to change when the patient’s health is deteriorating following surgery for a glioma5 and the pattern of change is typically abrupt, not gradual, in patients with tumor progression.6
Because of the demonstrated impact of symptom burden and the interference of symptoms on functional and survival outcomes,2,16,17 this project was undertaken to evaluate the relationship between patient-reported health status using the EQ-5D and symptom severity and interference using the MD Anderson Symptom Inventory-Brain Tumor (MDASI-BT) in the primary brain tumor patient population. The goal of this study was twofold. First, to provide a descriptive profile of health status and utility scores in glioma patients throughout the illness trajectory, using the EQ-5D. Second, to evaluate the relevant information provided by the MDASI-BT in describing patients’ HRQOL as assessed by the EQ-5D.
Methods
Patients with malignant glioma undergoing outpatient treatment at the University of Texas MD Anderson Cancer Center participated in an institutionally reviewed study exploring symptom burden throughout the disease trajectory. Patients provided written informed consent and completed questionnaires, including the EQ-5D and MDASI-BT. Research staff collected demographic, clinical, and treatment information (eg, tumor grade and type, disease stage). Performance status was categorized as “good” or “poor” based on Karnofsky Performance Status (KPS) ratings, with a KPS of 90 and above as “good” and a KPS of 80 and below as “poor,” as has been previously reported.1,2 When evaluating associations with tumor grade, patients with grade II and grade III tumors were grouped together and compared with patients with grade IV tumors.
Measures
The MD Anderson Symptom Inventory-Brain Tumor (MDASI-BT) is a self-report measure of symptom burden and symptom interference within the past 24 hours. It consists of 22 symptom items rated 0 (not present) to 10 (as bad as you can imagine) and 6 interference items rated 0 (did not interfere) to 10 (interfered completely). Armstrong et al18 demonstrated both the symptom item and interference items can be further categorized into symptom factors (Affective, Cognitive, Neurologic, Treatment-related, General Disease, and Gastrointestinal) and interference subscales (Mood-related [REM] and Activity-related [WAW]).18,19 A score is provided for the overall symptoms, their factors, and the interference and its subscales by calculating the mean for each. A symptom rated 5 or higher may be described as moderate-to-severe.20,21
The EQ-5D is a “standardized measure of health status developed by the EuroQol Group in order to provide a simple, generic measure of health for clinical and economic appraisal.”3 It is a self-report functional measure of general health status, assessing 5 dimensions: mobility, self-care, usual activities, pain/discomfort, and anxiety/depression. Patients choose a level for each dimension that reflects their “own health state today.” The possible levels represent “no problems,” “some problems,” and “extreme problems.” A profile indicating the extent of problems on each of the 5 dimensions is provided by a 5-digit health state. Also, an EQ-5D index score of the health state is calculated using a scoring function based on population-based preference weights. The EQ-5D also includes a 20-cm visual analog scale, with endpoints at 0 (worst imaginable health state) and 100 (best imaginable health state), on which patients rate their own health.
Statistical Analysis
All statistical analyses were performed on IBM SPSS Version 21.0.22 Descriptive statistics described the patient sample and provided summary scores for the MDASI-BT and EQ-5D. Shaw et al15 provided the scoring algorithm for the EQ-5D index scores using U.S. population-based preference weights. The EQ-5D index score ranged from 0.11 to 1.0. A score of 1.0 describing health as perfect, a score of 0.0 describing health as death-like, and negative scores describing health as worse than death. Associations between clinical factors (tumor grade, performance status, treatment phase, and recurrence) and severity levels of the EQ-5D were explored with chi-square tests and Fisher’s exact tests. Independent sample t tests were used to determine mean differences in visual analog scale scores and EQ-5D index scores between groups. Since there were 4 clinical factors of interest, the significance level was set at P < .0125 to adjust for multiple comparisons. Lastly, we evaluated the relationship between symptom burden and interference and health status with 2 models. Both used linear regression with backwards selection (P < .05). The first model evaluated which MDASI-BT symptom factors and interference subscales adequately predict patient health outcomes as measured by the EQ-5D. The second model added the clinical factors to the MDASI-BT symptom factors and interference subscales identified by the first model.
Results
Patient Characteristics
One hundred patients were approached about the study, provided informed consent, and completed both the MDASI-BT and the EQ-5D. The majority of patients were white (88%) males (65%) aged 20 to 75 years (mean = 50, SD = 12). A WHO grade IV glioma (also known as glioblastoma) was the most common tumor (78%) and a tumor recurrence had occurred in 38% of patients. Initial treatment was a gross total resection for 43% of patients. Overall, most patients had good performance status (63%). Treatment categories at the time of the analysis were as follows: 56% of patients were receiving active treatment, 24% were in follow-up, and 20% were newly diagnosed (after surgery but before additional cancer treatment). Table 1 describes the patient sample.
Patient demographics and clinical characteristics (N = 100)
| Age | Mean | 50 |
| Median (Range) | 52 (20–75) | |
| % | ||
| Sex | Male | 65% |
| Female | 35% | |
| Race | White | 85% |
| Asian | 7% | |
| Black or African American | 4% | |
| Native Hawaiian or other Pacific Islander | 1% | |
| Missing | 3% | |
| Marital status | Married | 77% |
| Single | 11% | |
| Divorced | 9% | |
| Separated | 2% | |
| Widowed | 1% | |
| Employment | Employed full-time | 43% |
| Employed part-time | 7% | |
| Retired | 14% | |
| Homemaker | 3% | |
| Unemployed due to diagnosis of tumor | 14% | |
| Unemployed prior to diagnosis | 1% | |
| Student | 1% | |
| Other | 11% | |
| Missing | 6% | |
| Education | ≤12 years | 17% |
| 13–16 years | 45% | |
| 17+ years | 36% | |
| Missing | 2% | |
| Household income | $100,000 or more | 45% |
| $50,000 - $99,999 | 19% | |
| $30,000 - $49,999 | 10% | |
| Less than $30,000 | 15% | |
| Missing | 11% | |
| Original surgery extent | Gross total resection | 43% |
| Partial resection | 37% | |
| Biopsy | 19% | |
| None | 1% | |
| Tumor grade | Grade II-Grade III | 22% |
| Grade IV | 78% | |
| Performance Status | Good (KPS ≥ 90) | 63% |
| Poor (KPS ≤ 80) | 37% | |
| Treatment status | Newly diagnosed | 20% |
| On treatment | 56% | |
| Follow-up without active treatment | 24% | |
| Recurrence | No | 62% |
| Yes–first time | 24% | |
| Yes–repeated | 14% |
Abbreviation: KPS, Karnofsky Performance Status.
Current Health Status (EQ-5D)
Health profiles
Thirty-one of the possible 243 EQ-5D health profiles were displayed by our patient sample. The 3 most reported profiles were: 1) “no problems” across the 5 dimensions (profile 11111, 28%); 2) “some problems” with anxiety/depression and “no problems” elsewhere (profile 11112, 7%); and 3) “some problems” with mobility, usual activities and anxiety/depression but “no problems” in self-care or pain/discomfort (profile 21212, 6%). The majority of patients (72%) reported having limitation (either “some problems” or “extreme problems”) in at least 1 area, with 9% reporting limitation in all 5 areas. The areas with the most “extreme” limitation were usual activities (8%) and anxiety/depression (5%). Both tumor grade and performance status were associated with limitation. More patients with grade IV gliomas reported limitation with self-care compared to patients with grade II or III gliomas (31% vs 5%, P = .012). Patients with poor KPS more frequently reported limitation across dimensions, especially inability for self-care (P < .005). Treatment phase and recurrence were not significantly associated with limitation in the 5 dimensions. Table 2 summarizes the percentages of patients endorsing the dimensions of the EQ-5D according to clinical characteristics.
Severity of EQ-5D dimensions by clinical characteristics
| Total Sample | Tumor grade | Performance status | Treatment phase | Recurrence | ||||||
|---|---|---|---|---|---|---|---|---|---|---|
| II-III | IV | Poor (KPS ≤ 80) | Good (KPS ≥ 90) | Newly diagnosed | On treatment | Follow-up | No | Yes | ||
| N = 100 | n = 22 | n = 78 | n = 37 | n = 63 | n = 20 | n = 56 | n = 24 | n = 62 | n = 38 | |
| Mobility | ||||||||||
| No problems | 57% | 59% | 56% | 22% | 78% | 65% | 59% | 46% | 60% | 53% |
| Some problems | 41% | 36% | 43% | 73% | 22% | 30% | 39% | 54% | 38% | 44% |
| Confined to bed | 2% | 5% | 1% | 5% | 0% | 5% | 2% | 0% | 2% | 3% |
| Self-care | ||||||||||
| No problems | 75% | 95% | 69% | 54% | 87% | 80% | 77% | 67% | 74% | 76% |
| Some problems | 22% | 0% | 28% | 38% | 13% | 20% | 18% | 33% | 23% | 21% |
| Unable to wash or dress | 3% | 5% | 3% | 8% | 0% | 0% | 5% | 0% | 3% | 3% |
| Usual activities | ||||||||||
| No problems | 51% | 59% | 49% | 24% | 67% | 40% | 52% | 58% | 55% | 45% |
| Some problems | 41% | 36% | 42% | 60% | 30% | 45% | 43% | 34% | 35% | 50.0% |
| Unable to perform | 8% | 5% | 9% | 16% | 3% | 15% | 5% | 8% | 10% | 5% |
| Pain/Discomfort | ||||||||||
| No pain or discomfort | 66% | 64% | 67% | 49% | 76% | 65% | 64% | 71% | 65% | 68% |
| Moderate pain or discomfort | 32% | 36% | 30% | 46% | 24% | 35% | 34% | 25% | 32% | 32% |
| Extreme pain or discomfort | 2% | 0% | 3% | 5% | 0% | 0% | 2% | 4% | 3% | 0% |
| Anxiety/Depression | ||||||||||
| Not anxious or depressed | 62% | 50% | 65% | 49% | 70% | 60% | 66% | 54% | 63% | 61% |
| Moderately anxious or depressed | 33% | 45% | 30% | 40% | 28% | 30% | 29% | 46% | 32% | 34% |
| Extremely anxious or depressed | 5% | 5% | 5% | 11% | 2% | 10% | 5% | 0% | 5% | 5% |
For the tests of association, the “some problems” and “extreme problems” levels were combined. Abbreviation: KPS, Karnofsky Performance Status.
Visual Analog Scale
Ninety-six patients reported a mean visual analog scale score of 73 (SD = 20; range, 1–100). Patients with poor KPS or who had experienced a recurrence reported lower scores (worse health) than patients with good KPS or without a recurrence. However, neither test achieved statistical significance after adjusting for multiple comparisons (P = .014, P = .053, respectively). Fig. 1 illustrates the mean visual analog scale scores according to clinical characteristics.
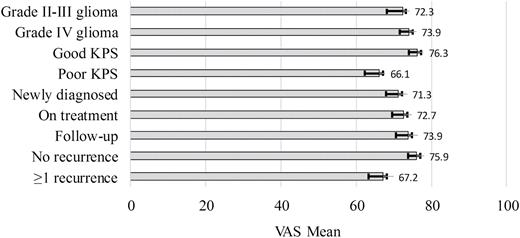
EQ-5D visual analog scale (VAS) ratings by clinical characteristics. EQ-5D VAS is rated on a 0 (worst imaginable health) to 100 (best imaginable health) scale.
EQ-5D index score
The EQ-5D index score ranged from 0.03 to 1.0, with a mean score of 0.80 (SD = 0.2). Based on index scores, 72% of patients perceived their health to be less than perfect. A significant difference was observed in index scores in terms of performance status (t(98) = −5.2, P < .001). Patients with poor performance status had lower scores compared to patients with good performance status [mean = 0.68 (SD = 0.24) vs mean = 0.87 (SD = 0.13)]. No differences were observed in index scores based on tumor grade, treatment phase, or recurrence. See Table 3 for EQ-5D summary scores.
Summary of EQ-5D index scores and MDASI-BT scores (N = 100)
| EQ-5D index scores by clinical characteristics | |||
|---|---|---|---|
| Mean | SD | Range | |
| Total sample | 0.80 | 0.20 | 0.03–1.0 |
| Tumor grade II-III | 0.82 | 0.20 | 0.03–1.0 |
| Tumor grade IV | 0.79 | 0.20 | 0.24–1.0 |
| Poor KPS (≤80) | 0.68 | 0.24 | 0.03–1.0 |
| Good KPS (≥90) | 0.87 | 0.13 | 0.44–1.0 |
| Newly diagnosed | 0.77 | 0.20 | 0.28–1.0 |
| On treatment | 0.81 | 0.21 | 0.03–1.0 |
| Follow-up | 0.79 | 0.16 | 0.26–1.0 |
| No recurrence | 0.80 | 0.21 | 0.24–1.0 |
| At least one recurrence | 0.80 | 0.18 | 0.03–1.0 |
| MDASI-BT by symptom factors | |||
| Overall | 1.5 | 1.1 | 0–5.9 |
| Affective | 2.4 | 2.0 | 0–8.6 |
| Cognitive | 1.7 | 1.7 | 0–7.0 |
| Neurologic | 1.1 | 1.4 | 0–7.8 |
| Treatment-related | 1.8 | 1.6 | 0–7.0 |
| Generalized disease | 1.0 | 1.4 | 0–8.3 |
| Gastrointestinal | 0.4 | 0.9 | 0–3.5 |
| Interference | 2.4 | 2.5 | 0–9.3 |
| Activity-related interference | 2.5 | 2.9 | 0–10.0 |
| Mood-related interference | 2.3 | 2.6 | 0–10.0 |
Abbreviation: KPS, Karnofsky Performance Status; MDASI-BT, MD Anderson Symptom Inventory-Brain Tumor
Symptom Burden and Interference
Symptom burden, as measured by the MDASI-BT, ranged from 0.0 to 5.9, with a mean score of 1.5 (SD = 1.1). Sixty-three percent of patients reported at least 1 moderate-to-severe symptom. The most frequently reported symptom was fatigue (83% present, 36% moderate-to-severe), followed by feeling drowsy (71% present, 31% moderate-to-severe), and disturbed sleep (63% present, 26% moderate-to-severe). The Affective factor (fatigue, disturbed sleep, feeling distress, feeling sad, irritability) was the most severely reported symptom factor with a mean of 2.4 (SD = 2.0), followed by the Treatment-related factor (lack of appetite, feeling drowsy, dry mouth) with a mean of 1.8 (SD = 1.6), and the Cognitive factor (difficulty remembering, understanding, speaking and concentrating) with a mean of 1.7 (SD = 1.7). Symptomatic patients (reporting at least 1 moderate-severe symptom) did not differ from asymptomatic patients in terms of age, gender, performance status, or tumor grade.
Symptom interference ranged from 0.0 to 9.3 with a mean score of 2.4 (SD = 2.5). Activity-related interference (WAW subscale: work, activity, walking) was rated higher than mood-related interference (REM subscale: relations with others, enjoyment of life, mood) (mean = 2.5; SD = 2.9; range, 0–10 vs mean = 2.3; SD = 2.6; range, 0–10, respectively). Table 3 and Fig. 2 summarize the symptom and interference ratings for the MDASI-BT.
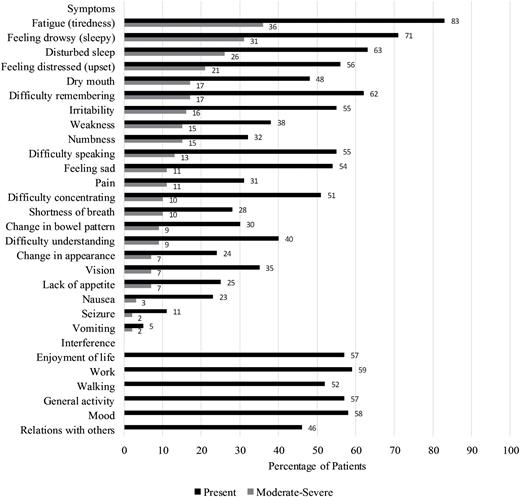
MDASI-BT severity by item. Percentage of patients who endorsed symptoms as moderate-severe. A rating of 5 or higher on a 0 (symptom not present) to 10 (symptom is as bad as can be imagined) scale is considered moderate-severe.
Relationship Between MDASI-BT and EQ-5D
There was a direct relationship among symptom burden, symptom interference, and health status. An initial linear regression model revealed the MDASI-BT Neurologic factor (pain, numbness, weakness, seizure) score (β = −0.36, t(97) = −4.22, P < .001) and the WAW interference score (β = −0.44, t(97) = −5.21, P < .001) together explained almost half of the variability of the EQ-5D in this patient population (F(2,97) = 48.5, P < .001, adj R2 = 0.49) (Table 4). As patients reported more symptoms and interference or more severe symptoms and interference, their health status declined. When tumor grade (β = -0.06, t(94) = -0.77, ns), KPS (β = 0.21, t(94) = 2.69, P < .01), and recurrence status (β = 0.03, t(94) = 0.47, ns) were also included in a second model, over half of the EQ-5D variance was explained (F(5,94) = 22.1, P < .001, adj R2 = 0.52). However, only KPS significantly contributed to the EQ-5D variance in addition to the MDASI-BT neurologic factor and activity-related interference scores. A lower KPS predicted a worse health status (see Table 4).
Linear regression of MDASI-BT and clinical factors on EQ-5D Index score (N = 100)
| Variables | Model 1 (MDASI-BT only) | Model 2 (MDASI-BT + Clinical Factors) | ||||
|---|---|---|---|---|---|---|
| B | SE B | CI1 | B | SE B | CI1 | |
| Constant | 0.93 | 0.02 | 0.89, 0.97 | 0.88 | 0.05 | 0.79, 0.97 |
| MDASI-BT | ||||||
| Neurologic factor | −0.05* | 0.02 | −0.07, -0.03 | −0.05* | 0.01 | −0.07, -0.03 |
| WAW interference | −0.03* | 0.01 | −0.04, -0.02 | −0.02* | 0.01 | −0.04, -0.01 |
| Clinical factors | ||||||
| KPS | — | — | — | 0.09* | 0.03 | 0.02, 0.15 |
| Tumor grade | — | — | — | -0.03 | 0.03 | −0.09, 0.04 |
| Recurrence status | — | — | — | 0.01 | 0.03 | −0.04, 0.07 |
| Model 1: Adj R2 = 0.49, F(2,97) = 48.5; *P < .01; 195% Confidence Interval | Neurologic: Pain, numbness, weakness, seizure | |||||
| Model 2: Adj R2 = 0.52, F(5,94) = 22.1; *P < .01; 195% Confidence Interval | WAW: Work, general activity, walking | |||||
Abbreviation: KPS, Karnofsky Performance Status; MDASI-BT, MD Anderson Symptom Inventory-Brain Tumor
Discussion
It is well recognized that the general health status of patients with malignant gliomas is poor; most patients are unable to return to work.23,24 Studies using qualitative measures have demonstrated that patients spend a majority of their time dealing with the impact of the disease.25,26 Even at the time of diagnosis, patients with malignant gliomas have a definable and significant symptom burden that typically continues throughout the disease course. Symptoms can improve or worsen with the prescribed treatment, thereby impacting the patient’s quality of life. The relationship between the self-reported symptom burden of this population and its impact on health status has been seldom explored. Studies using standardized instruments to measure health status, such as the EQ-5D, which allow comparative impact of a brain tumor diagnosis to healthy individuals or patients with other solid tumor malignancies, are limited in number and scope.7,10,14,27,28 To date, there have been less than 10 studies reporting on the use of the EQ-5D in adult glioma patients and have focused primarily on presurgery and postsurgery comparisons.5–8,29–31 These studies have shown EQ-5D to be related to KPS but more sensitive to changes in health status after surgery.30 The current study found both symptom burden and KPS to be responsible for more than half of the functional limitation patients are reporting. In addition, the current study reported health status throughout the disease trajectory.
Overall, patients with a malignant glioma who participated in this study reported similar health status as patients with other solid tumor malignancies and other chronic medical conditions. For example, Pickard et al reported a mean index score of 0.78 (SD = 0.15) in a sample of 534 patients with a variety of solid tumors27 and of 0.79 in a separate oncology patient sample of 472.28 The current study patients also reported better health status compared to patients with chronic mental and/or physical medical conditions such as heart disease, psychiatric disorders, and osteoarthritis, but worse health status compared to patients in the general population without any chronic medical conditions, as measured by the PROMIS.14 The EQ-5D index scores estimate the value of a health state to the individual person32; however, while an EQ-5D index score of 1.0 represents perfect health, it is otherwise difficult to qualify health status as poor or good based on the EQ-5D, underscoring the difficulty of the measure in exploring differences among populations with chronic health conditions.
In our study, the majority of brain tumor patients reported at least one functional limitation, as measured either by the MDASI-BT interference items or EQ-5D. Health status was impacted by the patient’s limitation in usual activities, with most patients rating this area as problematic in the EQ-5D. The WAW, which is the activity-related interference subscale of the MDASI-BT, was predictive of health status, adding support to the importance of these functional limitations in determining health status in this patient population. While the interference measured by the MDASI-BT and that measured by the EQ-5D appear similar, they are two different constructs. The MDASI measures symptom burden and the interference caused by the symptom burden. The EQ-5D is a measure of function, a reflection of “a person’s level of subjective satisfaction, distress, or desirability associated with different health conditions,”32 regardless of symptoms. Findings in this study highlight the importance of the role of symptoms in determining patients’ report of functional limitations.
Fatigue-related symptoms were most prominent in this patient population; however, neurologic symptoms were predictive of health status, underscoring the importance of these disease-related symptoms in this patient population. One explanation is that neurologic symptoms (such as self-reported weakness on one side of the body, altered sensation, and seizures) are more closely related to activity levels as measured by the EQ-5D.
As reported elsewhere,1,5 there was a modest percentage of patients with no symptoms (37% with no moderate-severe symptoms) or whose health status was “perfect” (28% with EQ-5D index score of 1.0). Identification of this subset of patients has implications for both care and research. Further exploration is needed to understand if patients respond differently to treatment with varying health states. In this study, there were no differentiating characteristics, such as age, gender, performance status, or tumor grade, between these 2 groups (symptomatic, asymptomatic) of patients. As a result, there is an inability to predict patients with no symptoms based on typical demographic and clinical characteristics, highlighting the importance of patient self-report to identify those with symptoms that are severe or interfere with function in clinical practice. Future studies exploring individual differences in the severity of symptoms and impact throughout the trajectory are warranted.
In this study, over half of the variance in the EQ-5D was explained by the MDASI-BT, KPS, tumor grade, and recurrence status. While the additive value of the clinical factors is significant, the bulk of the EQ-5D’s variance was explained by the MDASI-BT alone. Tumor grade and recurrence were not significant predictors of health status, but were included based on previous research and clinical judgement. The resultant model demonstrates the significant contribution symptom burden and interference has on determining health status in this patient population. When compared to other self-report measures, the MDASI-BT explained less of the EQ-5D’s variance than the PROMIS (R2 = 0.6514) or EORTC (R2 = 0.6111). However, the MDASI-BT is the only self-report measure of the 3 that is disease-specific to brain tumor patients. Predicting EQ-5D scores from disease-specific measures allows for estimating health status in the absence of generic instruments used in cost-utility analyses and to estimate quality-adjusted life-years. Revicki et al32 suggest that the use of utility scores may serve different purposes (cost-utility analysis versus clinical application) and that the EQ-5D is better for the former, while patient-derived utility scores (such as what the MDASI-BT would provide) may be better for the latter.
There are several limitations to this study, the first being it was a cross-sectional sample. It included patients presenting to a large cancer hospital in the southern United States with a distinctive referral pattern. The sample also included primarily high-grade glioma patients on active treatment. Preliminary research shows there may be different symptom clusters for patients on active treatment compared to patients not on active treatment.33 Additionally, the small sample size did not allow for splitting the sample into testing and validation samples. Future studies with larger samples will provide the opportunity to test the predictive ability of the model currently derived.
Future studies exploring general health status and symptom burden longitudinally throughout the illness trajectory will be important to fully evaluate the relationship during the various stages of treatment and recurrence. Utility scores and patient-reported outcomes play complementary roles in evaluating treatment and its impact on patient outcomes. This provides an opportunity to readily monitor patient function with the goal of early recognition and interventions to improve patient outcomes.
Funding
Partially supported by the Collaborative Ependymoma Research Network (CERN Foundation).
Conflict of interest statement. The authors declare no potential conflicts of interest.
Acknowledgements
Study findings were presented during a poster session at the 20th Annual Scientific Meeting of the Society of Neuro-Oncology, November 2015.
References
