


Abstract
Magnetic resonance imaging (MRI) cerebral blood volume (CBV) measurements improve the diagnosis of recurrent gliomas. The study investigated the prognostic value of dynamic contrast-enhanced (DCE) CBV imaging in treated IDH wildtype glioblastoma when added to MRI or amino acid positron emission tomography (PET).
Hybrid [18F]FET PET/MRI with 2CXM (2-compartment exchange model) DCE from 86 adult patients with suspected recurrent or residual glioblastoma were retrospectively analyzed. High CBV tumor volume (VOLCBV), and contrast-enhancing (VOLCE) and [18F]FET active tumor (VOLFET) volumes were delineated. Absolute and fractional high CBV subvolumes within VOLCE and VOLFET were determined. Associations with overall survival (OS) were assessed by Cox analysis.
Adjusted for methyltransferase gene status and steroid use all total tumor volumes were individually associated with shorter OS. Adding VOLCBV to VOLCE or VOLFET only the effect of VOLCBV was prognostic of OS (hazard ratio [HR] 1.327, P = .042 and 1.352, P = .011, respectively). High CBV subvolumes within both VOLCE and VOLFET were associated with shorter survival (HR 1.448, P = .042 and 1.416, P = .011, respectively), and the low CBV subvolumes with longer survival (HR 0.504, P = .002 and .365, P = .001, respectively). The fraction of VOLCE and VOLFET with high CBV was a strong predictor of OS with shorter median OS in upper versus lower tertiles (8.3 vs 14.5 months and 7.1 vs 15.6 months, respectively, both P < .001).
The high CBV tumor volume was a strong prognosticator of survival and allowed for the separation of high- and low-risk subvolumes underlining the heterogeneous physiological environment represented in the contrast-enhancing or metabolically active tumor volumes of treated glioblastoma.
The study investigated the prognostic value of DCE measurements in treated glioblastoma.
High CBV tumor volume was a strong and independent prognosticator of survival.
CBV measurements identified high-risk subvolume within MRI and PET tumor volumes.
The prognosis of recurrent glioblastoma is overall poor, but variable, and prognostic biomarkers may be of value for risk stratification. The present study investigates the prognostic information of routine dynamic contrast-enhanced (DCE)-magnetic resonance imaging (MRI) cerebral blood volume (CBV) imaging in patients with suspected recurrent glioblastoma referred for amino acid positron emission tomography (PET)/MRI. The study shows that the high CBV tumor burden is a strong and independent prognosticator of survival when added to conventional MRI or amino acid PET adjusted and accounting for established risk factors. We also showed that CBV imaging allowed for the identification of high-risk and lower-risk subvolumes within both the contrast-enhancing and the metabolically active tumor volume, and propose the high CBV fraction as a simplified prognostic biomarker. The findings of the study underline the potential of advanced imaging to characterize the physiological heterogeneity of treated brain tumors and to improve prognostic stratification.
Glioblastoma (GBM) has a poor prognosis with a median overall survival (OS) of 15 months despite standard optimal management.1 Identification of viable progressive tumor tissue is of great importance, but the accuracy of standard MRI in the post-treatment setting is low due to the presence of treatment-induced changes. The specificity of conventional pre- and post-contrast T1- and T2-weighted MRI may be as low as 50% for biopsy-verified recurrent glioma.2 Hence, various functional imaging modalities aiming to establish the nature of magnetic resonance imaging (MRI) lesions have been introduced3,4 which may allow a more accurate assessment of true tumor burden in the post-treatment setting. More accurate differentiation of post-treatment-related effects and recurrence or regrowth will ultimately benefit patients by avoiding unnecessary anxiety, surgical procedures, and withdrawal of potentially useful drugs in post-treatment-related effects, and earlier change of treatment in patients with recurrence or regrowth.
Amino acid positron emission tomography (PET) tracers such as O-(2-[18F]-fluoroethyl)-L-tyrosine ([18F]FET) are increasingly being used as an adjunct to conventional MRI for separating metabolically active tumors from surrounding non-malignant tissues, in particular, for identification of diffusely infiltrative tumor components and for discriminating tumor from post-treatment changes.5 Although amino acid PET may be considered the best imaging modality in clinical use,3,6 it is increasingly appreciated that non-specific increased uptake above standard cut-offs may be observed in non-tumor tissue, eg, infarction or infection/inflammation7 and importantly also frequently observed in treatment-related effects.8,9
Increased tumor blood volume as assessed by perfusion MRI is considered a marker of tumor angiogenesis. Perfusion imaging is typically used as an adjunct to conventional MRI for differentiation of recurrence from post-treatment-related effects. MRI perfusion measurements for estimation of cerebral blood volume (CBV) are most commonly performed using the dynamic susceptibility contrast (DSC) approach.10 Using DSC-MRI, recent studies have reported that the fraction of the contrast-enhancing volume with increased CBV can be used as a simplified measure correlating with tumor content verified by histopathology.11,12 The T1-weighted dynamic contrast-enhanced (DCE) approach is less affected by ambiguity in leakage quantification and susceptibility artifacts than DSC measurements.13 Furthermore, as opposed to the more widely used 3-parameter Extended Tofts model for analysis of DCE data, the 2-compartment exchange model (2CXM) enables separation and absolute quantification of blood flow and permeability in addition to CBV.14,15 The 2CXM DCE approach is in the phase of clinical validation. In a recent publication, we compared the diagnostic yield of 2CXM DCE CBV and amino acid PET using [18F]FET and reported similar high specificity, but slightly lower sensitivity of maximal DCE CBV, and further that specificity of [18F]FET PET increased in lesions concordant positive on both modalities.16
A challenge of post-treatment diagnostic studies is that lesions will often be heterogeneous with a mixture of both tumor- and treatment-related effects. Even when using histopathology as reference, agreement between pathologists on the separation of the entities is low,17 and histopathological diagnosis may not be predictive of clinical outcome.18 Given the limited survival benefit of salvage therapies, OS may thus be a more robust measure of tumor behavior.
At our institution, both standard MRI and 2CXM DCE CBV imaging are included in the clinical [18F]FET PET/MRI protocol for patients with suspected recurrent GBM. These data allow us to assess the prognostic value of DCE CBV imaging when added to MRI or amino acid PET, and to investigate the hypothesis that the visually increased CBV subvolume within the contrast-enhancing volume or metabolically active tumor volume constitutes more aggressive tumor components associated with poorer OS compared to subvolumes with low CBV.
Methods
Patient Population
The study cohort comprised consecutive patients undergoing [18F]FET PET/MRI between January 2016 and September 2020 (although from November 2019 patients without evaluable diagnostic outcome [n = 37 of 51 scans] were not included in the cohort). For the present analysis, we included adult patients (> 18 years) with suspected residual or progressive isocitrate dehydrogenase-1 (IDH1) wildtype (wt) GBM following standard therapies (ie, biopsy or maximal safe resection, radiation therapy, and/or chemotherapy with temozolomide, please refer to Supplementary Table 1 in the supplementary material for standard treatment protocols). Patients with atypical/mixed pathology (eg, sarcomatous components) or prior non-standard therapies were excluded. Technically non-valid scans were also excluded (n = 21).
Eligibility was initially assessed from the referral as stated in the imaging report and subsequently confirmed by a review of patient records. In patients with multiple eligible scans, only the first scan was included. A total of 86 scans from unique patients with GBM, WHO CNS grade 4, IDH wt were included in the analysis (see Supplementary Figure 1 in supplementary material for flow chart of inclusion). In 46 (53.5%) of the patients, an a priori clinical and imaging diagnosis of progression had been made (14 of these by surgery < 60 days prior to imaging) and the scan was performed to evaluate residual tumor, as a baseline evaluation before second-line therapy or prior to surgery. All patients had undergone both prior surgery/biopsy and radiotherapy, except for 2 patients with surgery only.
Ethics
Retrospective use of clinical data was approved by the Danish National Center for Ethics (ref no. 2305993). A subset of 41 scans with diagnostic outcome was included in a previous publication assessing diagnostic accuracy.16 Also, a subset of patients participated in prospective studies of combined nivolumab/bevacizumab (n = 12) or lomustine/bevacizumab (n = 8) and gave informed written consent prior to the scan. These prospective studies were approved by the local ethics committee (H-17040888 and H-1-2013-062) and conducted in accordance with the Helsinki Declaration. For these patients, only scans in the baseline bevacizumab naïve condition were included in the analysis.
Clinical Characteristics and Outcome
Tumor histology, IDH1 (or IDH2 in patients < 55 years) mutation and methylguanine-DNA methyltransferase gene (MGMT) promoter methylation status were defined as stated in the pathology report, established at the last surgery or biopsy prior to imaging. For the purpose of the study, the tumor type was retrospectively re-classified according to the revised 2021 WHO criteria.19 Initially, all patients previously classified using the 2016 WHO classification of CNS tumors20 as IDH1 (or IDH2 in patients < 55 years) wt GBM, WHO grade IV or anaplastic astrocytoma, WHO grade III were identified (n = 93). Histology reports prior to and up to 3 months after imaging were reviewed. Of 85 patients with histological features of GBM (necrosis or microvascular proliferation), 3 patients were excluded due to ATRX or histone 3 mutations and 1 young patient (age 34 years at presentation) was excluded due to incomplete molecular characterization. Among the remaining 8 patients without histological features of GBM, 5 patients fulfilling molecular criteria (TERT mutation, EGFR amplification, + 7/ − 10, or match for GBM IDH wt on 850K methylation analysis) were re-classified as GBM, WHO CNS grade 4, according to 2021 WHO classification criteria.19 At primary diagnosis, 9 patients were according to earlier WHO classifications diagnosed with anaplastic astrocytoma WHO III (2 of which with anaplastic astrocytoma with molecular features of GBM) and one with astrocytoma grade II.
Patient records were reviewed for prior treatments, and for the use of steroids (yes/no) and WHO performance status (PS) at the time of scan. The PS score closest to the time of scan (usually ± 2 weeks) was used if the patient was described in stable clinical condition. As PS was sometimes noted between 2 scores (eg, PS 1–2), the scores were grouped as 0–1, 1–2, or ≥ 2. If no PS score was recorded, a probable PS score of 0–1 was assigned if the patient was described as in good clinical condition (eg, at work) or considered for the resective surgery. In 8 patients, a PS score could not reliably be assigned.
Survival from the time of scan was determined as overall survival (OS, death from any causes). The vital status of each patient was assessed using electronic patient records in May 2023.
In patients with resection or biopsy performed within 3 months after the scan, histopathology was classified as reactive (or predominantly reactive with only minimal tumor), mixed (both reactive and tumor), or recurrence (only tumor).
Imaging Protocol
All imaging data were performed on a Siemens Biograph mMR 3T hybrid PET/MRI system equipped with a 16-channel head-neck coil (Siemens Biograph, Siemens, Erlangen, Germany).
The hybrid PET/MRI protocol included a single-bed 20-min simultaneous PET/MRI acquisition performed 20 min after i.v. injection of 200 MBq ± 10% [18F]FET. DCE data were analyzed with in-house software for Matlab (Mathworks, Natick, MA) applying a 2CXM as previously described.14,21 Details of image acquisition, PET reconstruction, and DCE processing are provided below. In addition to DCE imaging, the MRI protocol included axial T2 BLADE (0.7 × 0.7 × 5 mm3), axial T2 FLAIR (1.2 × 0.9 × 5 mm3), and post-contrast 3D-T1 (1 × 1 × 1 mm3)-weighted sequences.
DCE CBV Imaging
Dynamic T1-weighed imaging was performed using a fast 3D spoiled gradient echo (VIBE) sequence with full brain coverage (2.4 × 2.4 × 5 mm3, TR/TE 2.94/0.86–0.91 ms, flip angle 14 °C, linear phase encoding, 30 axial slices). Images for T1-mapping were acquired before contrast injection using variable flip angles (4, 8, 14, and 20 or from Jan 2019 2, 3, 4, 6, and 8 °C) and otherwise identical parameters. A total of 180 frames with a temporal resolution of 2.55 s were acquired during a double bolus passage of 0.05 mmol/kg (Gadovist 1 mmol/mL, Bayer, Berlin, Germany) injected at 18 and 85 s after the dynamic DCE acquisition was started using a power injector (Medrad, Pittsburgh, PA) at a rate of 3 mL/s, each bolus followed by 25 mL of NaCl (3 mL/s).21,22 The magnitude of the dose of each bolus was based on a compromise between increasing the contrast to noise for a higher dose and the possibility of introducing a T2* effect or truncation of the bolus peak of the arterial input function. The second bolus also further stabilizes the deconvolution of the arterial input function and tissue curve when determining flow. DCE data were analyzed using fully automated in-house software for MATLAB (Mathworks Inc, MA) as previously described21 in which blood flow is initially estimated by model-free deconvolution regularized by Tikhonov’s method.15 CBV, permeability (unidirectional clearance constant, Ki), and extra-vascular, extra-cellular space are subsequently fitted from a 2CXM.14,21
PET Reconstruction
The PET images were reconstructed into a 344 × 344 matrix (voxel-size 0.8 × 0.8 × 2 mm3) using 3D OP-OSEM (4 iterations, 21 subsets) and applying a 5-mm Gaussian filter. The spatial resolution of the system is approx. 5 mm.23 Attenuation correction was performed either using a separately obtained low-dose CT (120 kV, 30 mAs, 5 mm slice width, Siemens Biograph PET/CT system) as previously described24 or MRI-based attenuation correction from a region-specific optimization of a UTE sequence (RESOLUTE).25
Delineation of Volumes
For lesion contouring, PET and CBV images and structural MRI were registered, displayed, and analyzed using Mirada RTx software (Mirada Medical Ltd., Oxford, UK). To ensure consistency, the delineation of tumor volumes was performed by a single author (O.H.) blinded to all clinical information and analyzed in a fixed order (first conventional MR, then DCE CBV, and finally [18F]FET PET). Delineated high CBV tumor volumes were stored and corroborated by a second author (I.L., 8 years of experience with clinical DCE CBV imaging).
Guided by the MRI report, the contrast-enhancing tumor volume (VOLCE) was delineated by isocontouring and adjusted manually. As no biopsy-controlled threshold exists for DCE CBV imaging, the high CBV tumor volume (VOLCBV) was visually defined as CBV higher than normal-appearing white matter and higher than surrounding or similar contralateral structures. VOLCBV was delineated by 3D isocontouring and adjusted manually. Avoiding macrovascular signal, the maximal CBV value (CBVmax) within VOLCBV (or within VOLCE or the metabolically active volume defined by [18F]FET PET if visually showing low CBV) was obtained. Also, median CBV within VOLCE was recorded as a representative measure of CBV within the MRI-defined lesions. An approximately 2 mL volume of interest was drawn in normal-appearing white matter of the contralateral hemisphere for calculation of normalized CBV values. In an ad-hoc analysis, the approximate CBV threshold applied to each patient was retrospectively noted. As exploratory analysis showed similar results for absolute and normalized CBV values, only normalized values better reflecting visual appearance are reported.
The metabolically active [18F]FET tumor volume (VOLFET) was defined according to guidelines as tissue with [18F]FET uptake (tumor-to-background ratio, TBR) exceeding 1.6 of the mean activity of a background region drawn in normal-appearing cortex of the contralateral hemisphere.26 The maximal tumor-to-background uptake ratio (TBRmax) was calculated as a measure of metabolic activity. Examples of delineated volumes are shown in Figure 1.
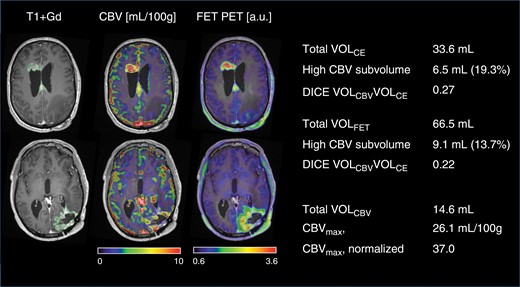
Delineation of tumor volumes and subvolumes. A case of multifocal recurrent glioblastoma. Scan was performed 1 month after resection of recurrence in left occipital lobe (8 months after end of radiotherapy). Axial sections are shown at the upper part of the lateral ventricles (upper row) and basal ganglia (lower row). The scan showed contrast enhancement at the primary tumor site in the left occipital region and appearance of 2 additional lesions (upper row) and second-line therapy was initiated. A subvolume of 6.5 mL showed high CBV and contrast enhancement corresponding to 19.3% of VOLCE. The high CBV subvolume within the metabolically active volume was 9.1 mL corresponding to 13.7% of VOLFET (see Figure 2 for definition of subvolume). Note good spatial agreement between modalities in the 2 lesions in the upper row, but low agreement in the occipital lesion in the lower row. Values shown are for all 3 components combined (and used in the analyses).
In patients with multiple lesions, each lesion was initially delineated separately and then combined into a single volume for each modality. In addition to total tumor metrics for each modality obtained as described above, high CBV and low CBV subvolumes within total VOLCE or VOLFET, and the non-enhancing metabolically and non-active subvolumes within VOLCBV were determined as shown in Figure 2. Both the absolute (in mL) and fractional (percentage) high CBV and low CBV subvolumes were calculated. The spatial agreement of total tumor volume was assessed by calculation of the DICE coefficient as shown in Figure 2.
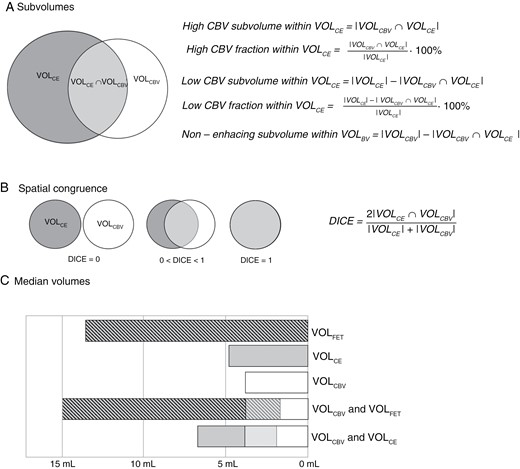
Analysis of spatial overlaps. Upper panel (A) shows calculation of absolute and fractional high and low CBV subvolumes within the contrast-enhancing volume. Middle panel (B) shows calculation of corresponding DICE coefficient. Spatial overlaps of VOLBV and VOLFET were analyzed in a similar way. In lower panel (C), median absolute tumor volumes and overlaps are shown graphically.
Statistics
For continuous parameters, the median value [range] is reported, and group differences were tested using the Mann–Whitney test (or Wilcoxon signed rank test for paired observations). Categorical variables were analyzed using Fischer’s exact test.
The associations of risk factors, total tumor metrics, and CBV-defined subvolumes with OS were investigated in Cox proportional hazard models. The prognostic value of clinical parameters (age, MGMT status, steroid use, PS, and an a priori diagnosis of progression) were initially assessed individually and included in models if showing an effect in univariate analysis. Due to right-skewed distribution, all CBV values and tumor volumes were analyzed log2-transformed in Cox models (for volumes as log2 of volume + 1 in order to include also lesions with volume = 0 mL) such that an increase by 1 corresponds to a doubling of the parameter. Models based on non-transformed parameters yielded comparable results for volume-based metrics, while quantitative CBV metrics did not show any effects in Cox models. Only Cox models based on log-transformed parameters are presented. Due to the collinearity of image-derived tumor metrics, the (marginal) effect of each tumor metric in the Cox model was assessed in models including only selected clinical parameters and also either contrast-enhancing volume or high CBV volume. Each model thus included a maximum of 2 image-derived metrics (from single modalities or combing DCE CBV with either contrast-enhanced MRI or [18F]FET PET). To assess possible type 1 errors in Cox analyses, all P-values from Cox models are reported raw and in square brackets corrected for false discovery rate (FDR) according to the method of Benjamini and Hochberg. The proportional hazard assumption was assessed by testing for a non-zero slope of a linear regression of scaled Schoenfeld residuals and predictive value was assessed by Harrel’s C index (please refer to Supplementary Table 2 in supplementary material). Survival functions were displayed by Kaplan–Meier plots and compared using a log-rank test.
A 2-tailed significance level of 0.05 was applied. All statistical analysis was performed in STATA 15 (Stata Corp, College Station, TX), except for FDR-corrected values calculated in SAS studio (release 3.8, SAS Institute Inc, Cary, NC).
Results
Patient summary characteristics are presented in Table 1. At follow-up 83 of 86 patients (96.5%) had died (median survival 10.9 [range 0.8–36.0] months).
Patient summary statistics
| n = 86 | ||
|---|---|---|
| Clinical | Age*, years | 60 [35–76] |
| Male, n | 49 (57.0%) | |
| MGMT methylated, n | 41 (47.7%) | |
| Molecular GBM | 5 (5.8%) | |
| Time from diagnosis to scan, months | 9.6 [3.9–71.2] | |
| Follow-up from scan, months | 11.4 [0.8–71.3] | |
| Prior surgery | Time from last surgery*, months | 6.6 [0.5–71.2] |
| Biopsy only, n | 10 (11.6%) | |
| Radiotherapy | 30 F × 2 Gy with concomitant TMZ, n | 74 (86.1%) |
| 30 F × 2 Gy (no TMZ), n | 4 (4.7%) | |
| 10 F × 3.4 Gy, n | 5 (5.8%) | |
| 33 F × 1.8 Gy, n | 1 (1.1%) | |
| No RT, n | 2 (2.3%) | |
| Time from end of radiotherapy*, months | 7.5 [1.8–67.2] | |
| Adjuvant TMZ* | Number of series, n [range] | 5 [0–11] |
| No adj. TMZ, n | 8 (9.2%) | |
| Steroid use* | Yes, n | 30 (35.3%) |
| WHO performance status* | 0–1, n | 56 (65.1%) |
| 1–2, n | 4 (4.6%) | |
| ≥2, n | 18 (20.9%) | |
| n.a., n | 8 (9.3) | |
| Location, n | Frontal | 22 (25.6) |
| Parietal | 13 (15.1) | |
| Temporal | 20 (23.3) | |
| Occipital | 8 (9.3) | |
| Striatum/thalamus | 2 (2.3) | |
| Cerebellum | 1 (1.2) | |
| >1 lobe** | 20 (23.3) |
Abbreviations: TMZ = temozolomide, Gy = Gray, F = fractions, n = number of patients.
All value are n (%) or median [range].
*at time of scan.
**involvement of more than a single lobe, region, or hemispheres
Similarity of Total Tumor Volumes
Imaging metrics summary statistics are presented in Table 2. Four patients did not have any contrast-enhancing lesions. Correlations of volume sizes (in mL, see also Supplementary Figure 2 in supplementary material) between VOLCBV and VOLCE and between VOLCBV and VOLFET were R2 = 0.65 (P < .001) and (R2 = 0.52, P < .001), respectively, with corresponding median DICE coefficients of 0.40 and 0.32, respectively (Table 1).
Tumor metrics summary statistics
| n = 86 | |
|---|---|
| Contrast-enhancing tumor volume | |
| Total volume (VOLCE), mL | 4.8 [0–49.5] |
| High CBV subvolume, mL | 1.8 [0–22.9] |
| High CBV fraction, % | 39.9 [0–90] |
| Normalized median CBV in VOLCE | 3.3 [0.2–18.3] |
| High CBV tumor volume | |
| Normalized CBVmax | 19.4 [0.5–205] |
| Total volume (VOLCBV), mL | 3.8 [0–44.5] |
| Isocontour threshold, normalized CBV | 3.9 [1.9–8.3] |
| [18F]FET active tumor volume | |
| Total volume (VOLFET), mL | 13.5 [0–111] |
| TBRmax (a.u.) | 2.8 [1.1–5.3] |
| High CBV subvolume, mL | 2.5 [0–35.1] |
| High CBV fraction, % | 21.4 [0–69.5] |
| DICE coefficient | |
| VOLCBV and VOLCE | 0.40 [0–0.79] |
| VOLCBV and VOLFET | 0.32 [0–0.75] |
All values are median [range].
Prognostic Risk Factors
In univariate Cox models of other prognostic risk factors, OS was positively associated with MGMT methylation (hazard ratio [HR] 0.490 [CI: 0.314–0.765], P = .002 [.005]) and borderline significant negatively associated with steroid use (HR 1.562 [CI: 0.991–2.463], P = .055 [.093]), but not with PS (HR 1.284 [CI: 0.841–1.959], P = .247 [.344]), age (HR 0.992 [CI: 0.969–1.107], P = .528 [.638]), an a priori diagnosis of progression (HR 1.304 [CI: 0.845–2.012], P = .230 [.332]), or prior biopsy only (HR 0.53 [CI: 0.263–1.062], P = .073 [.119]). Applying an FDR-corrected criterion of P < .1 only MGMT status and steroid use were included in multivariate models of imaging metrics.
Total Tumor Metrics
Results of the main Cox models for total tumor metrics are shown in Table 3 (see Supplementary Table 3 for additional results). Increasing contrast-enhancing tumor volume (VOLCE), high CBV tumor volume (VOLCBV), and metabolically active tumor volume (VOLFET) were all associated with shorter OS, also when adjusted for steroid use and MGMT status. When combing VOLCBV with either VOLCE or VOLFET, only VOLCBV was prognostic of OS (HR 1.327 per doubling of volume, P = .042 [0.074] and HR 1.352, P = .011 [.022], respectively). Increasing normalized CBVmax was associated with shorter OS (HR 1.226 per doubling CBVmax, P = .004 [.009]), but added to total tumor volumes no effect of CBVmax values was observed in any model. Neither absolute nor normalized median CBV within the contrast-enhancing volume was associated with OS in any of the models (Supplementary Table 3). Maximal metabolic activity (TBRmax) had a strong prognostic effect in all models rendering the effect of the metabolic volume (VOLFET) non-significant when including both (see also Supplementary Table 3 for TBRmax-adjusted models).
Cox models for analysis of tumor metrics
| Adj. risk factors† | Adj. risk factors + VOLCE | Adj. risk factors + VOLCBV | Adj. risk factors + VOLFET | |||||
|---|---|---|---|---|---|---|---|---|
| HR [CI] | P-val. [FDR] | HR [CI] | P-val. [FDR] | HR [CI] | P-val. [FDR] | HR [CI] | P-val. [FDR] | |
| High CBV volume | ||||||||
| Total CBV volume (VOLCBV), doubling | 1.435 [1.246–1.652] | <.001 [< .001] | 1.327 [1.011–1.743] | .042 [.074] | – | – | 1.352 [1.072–1.705] | .011 [.022] |
| Normalized CBVmax, doubling | 1.226 [1.068–1.408] | .004 [.009] | 1.006 [0.841–1.204] | .944 [.944] | 0.906 [7.747–1.099] | .317 [.427] | 1.035 [0.869–1.131] | .700 [.781] |
| Contrast-enhancing volume | ||||||||
| Total CE volume (VOLCE), doubling | 1.418 [1.220–1.648] | <.001 [< .001] | – | – | 1.101 [0.824-1.471] | .516 [.648] | – | – |
| High CBV subvolume, doubling | 1.576 [1.324–4.876] | <.001 [< .001] | 1.448 [1.014–2.067] | .042 [.074] | 1.287 [0.501–3.305] | .599 [.688] | – | – |
| Low CBV subvolume, doubling | 1.313 [1.119–1.541] | <.001 [.003] | 0.504 [0.328–0.774] | .002 [.005] | 0.990 [0.789–1.243] | .932 [.944] | – | – |
| Normalized median CBV in VOLCE, doubling | 1.164 [0.961–1.409] | .120 [.187] | 1.145 [0.932–1.407] | .196 [.294] | 0.970 [0.783–1.202] | .781 [.823] | ||
| Metabolically active volume | ||||||||
| Total PET volume (VOLFET), doubling | 1.331 [1.163–1.524] | <.001 [< .001] | – | – | 1.072 [0.863–1.331] | .531 [.648] | – | – |
| TBRmax (per a.u.) | 2.375 [1.762–3.200] | <.001 [< .001] | – | – | 1.939 [1.125–3.095] | .005 [.012] | 2.441 [1.515–3.933] | <.001 [.001] |
| High CBV subvolume, doubling | 1.482 [1.273–1.7269] | <.001 [< .001] | – | – | 1.281 [0.568–2.889] | .551 [.651] | 1.416 [1.082–1.854] | .011 [.022] |
| Low CBV subvolume, doubling | 1.285 [1.118–1.472] | <.001 [.002] | – | – | 1.033 [0.853–1.251] | .740 [.801] | 0.365 [0.198–0.673] | .001 [.004] |
Estimates show hazard ratios (HRs) of each parameter tested in separate models including only covariates shown in top of each column. Both raw and false discovery rate [FDR]-corrected P-values are shown, HRs for absolute volumes are based on log-transformed volumes (log2[vol + 1]).
†MGMT (methyltransferase gene) methylation status and steroid use.
DCE CBV-Defined Subvolumes
All absolute subvolumes were inversely associated with OS (Table 3). Adjusting for total VOLCE increasing size of the high CBV subvolume was associated with shorter OS (HR 1.448 per doubling volume, P = .042 [.074]) and the low CBV subvolume was associated with longer OS (HR 0.504 per doubling volume, P = .002 [.005]). Accordingly, increasing fractional high CBV volume was associated with shorter OS (HR 1.186 [CI: 1.089–1.293] per 10% point adjusted for risk factors and 1.142 [CI: 1.043–1.251] adjusted also for VOLCE, both P < .005 [P < .010]). Similar effects were observed when analyzing high and low CBV subvolumes within the metabolically active volume (Table 3). Kaplan–Meier curves for tertiles of the high CBV fractions are provided in Figure 3. Median survival in lower (< 20% of VOLCE) versus upper tertiles (> 55% of VOLCE) of the high CBV fraction within the contrast-enhancing tumor volume was 14.5 months versus 8.3 months (log-rank P < .001). Within the metabolically active tumor volume median OS in lower and upper tertiles of fractional high CBV volume were 15.6 months and 7.1 months, respectively (log-rank P < .001).
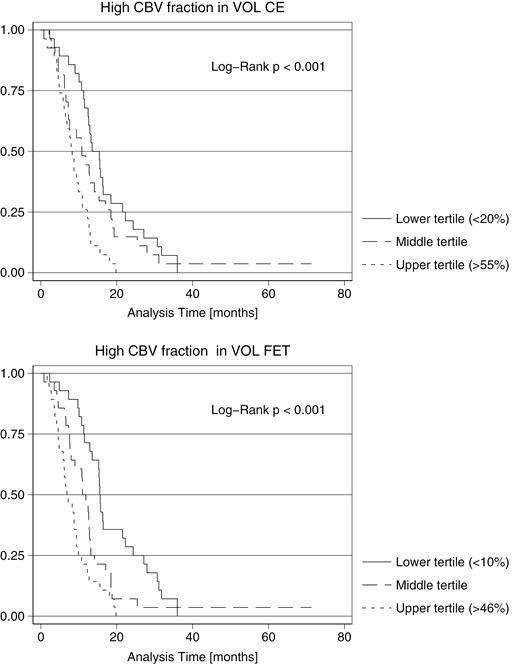
Kaplan–Meier curves for overall survival from time of scan. Survival curves of fractional high CBV subvolume within the contrast-enhancing volume and metabolic active volume, respectively. Patients are stratified according to lower, middle, and upper third values (tertiles) of fractional high CBV subvolumes.
Follow-up histopathology was available in 32/86 (31%) of patients overall and in 22/86 (26%) within 3 months (reactive n = 3, mixed n = 6, and recurrence n = 13). Fractional high CBV tumor volume within both VOLCE and VOLFET tended to be lower in patients with reactive changes (median 27.3% and 1.9% respectively) compared to mixed histopathology (median 44.9% and 29.2%, respectively) and highest in recurrence only (median 62.3% and 34.7%, respectively), although differences were not statistically significant. Corresponding median OS in the histopathology groups were 30.7 months (reactive), 7.6 months (mixed), and 11.3 months (recurrence).
Discussion
In the present study, we investigated the added prognostic value of 2CXM DCE CBV imaging in patients with treated GBM. Based on an assumption of physiological heterogeneity within tumor volumes defined by contrast-enhanced MRI and by amino acid PET, we further investigated if CBV imaging would allow the identification of high- and low-risk tumor subvolumes. The main findings are that both the total high CBV volume identified by 2CXM DCE and the high CBV subvolumes within both the contrast-enhancing and metabolically active tumor volumes were independent and strong predictors of shorter OS in addition to total tumor volume and other established prognostic risk factors. In contrast, the low CBV subvolumes were associated with relatively longer survival indicating a more benign physiological phenotype.
Several studies have investigated the prognostic value of MRI perfusion imaging, but often such studies are based on pre-treatment imaging27 and often include a mixture of tumor types and grades,28 or assess response to second-line therapy.29,30 Large studies relating imaging metrics selectively in treated GBM with survival are less abundant and findings furthermore not consistent. In a diagnostic accuracy study of patients (n = 68) with suspected recurrent high-grade glioma with subsequent surgery, the authors retrospectively found that increasing mean DSC CBV value in the contrast-enhancing region was associated with shorter OS in univariate Cox analysis.31 A retrospective analysis of patients diagnosed with recurrent GBM (n = 127) reported an association of increased mean normalized CBV value with shorter OS in univariate Cox analysis, but only in patients subsequently treated with bevacizumab and not in patients receiving alkylating agents.30 An analysis of the prospective EORTC 26101 trial (n = 254), however, could not confirm an association of baseline mean normalized DSC CBV with OS irrespective of bevacizumab treatment in multivariate Cox models also including established prognostic factors.29 In the present study, we found that the maximal CBV value was associated with OS, but not when adjusting for the contrast-enhancing or high CBV volume, nor did we find any association with OS of the median CBV value in the anatomically defined contrast-enhancing tumor volume. The low prognostic values of quantitative CBV measurements are in contrast to the high diagnostic value shown for differentiation of recurrence from treatment effects.32 In agreement with this, we have previously shown high diagnostic specificity of maximal (90%) and median CBV (85%) using 2CXM DCE for recurrence in high-grade glioma.16 Together, these observations may suggest that quantitative CBV value metrics reflecting the intensity of angiogenesis, but not tumor burden (size), is better suited for the detection of recurrence than for prognostication. A potential advantage of 2CXM DCE over DSC or conventional DCE approaches (ie, extended Tofts model) is absolute quantification of perfusion parameters,14,15 but in the present analysis, we did not demonstrate any added prognostic value of absolute quantification of CBV.
The present data show that tumor load measured by the contrast-enhancing tumor volume (VOLCE) is a strong prognostic factor in accordance with previous studies of prognostic factors in recurrent GBM.33–35 The data also found that the metabolically active tumor volume (VOLFET) is prognostic of OS when adjusted for clinical risk factors. This is in agreement with prior studies of [18F]FET PET scans performed in GBM patients after surgery for planning of radiotherapy36 and in suspected recurrent GBM.37 However, when combined with CBV measurements, only the high CBV tumor volume (VOLCBV) showed prognostic value. This is in agreement with the expectation that the high CBV tumor volume better represents the biological, progressive tumor burden than the contrast-enhancing tumor volume which is often a heterogeneous entity, also includes reactive treatment-related effects. Similar was observed when combining the high CBV tumor volume with the metabolically active tumor volume (VOLFET), in that only the high CBV tumor volume showed prognostic value. This could suggest DCE CBV to be more specific for progressive tumors not only compared to MRI but also compared to amino acid PET.
A caveat of the volume-based metrics in the case of CBV imaging, however, is the lack of established cut-offs for the separation of tumor from non-tumor tissue. Visual reading of DSC CBV images as positive/negative has previously been reported to be unreliable for differentiation of pseudoprogression from true progression.38 For DSC-MRI, efforts have been made to standardize the method39 and to determine CBV cut-off based on histopathology,11,12,40,41 but such cut-offs cannot readily be applied to DCE. Similar to previous publications analyzing the spatial extent of DSC CBV imaging,42,43 we applied visual criteria. In an attempt to provide guidance for the CBV cut-off, we investigated the actual threshold used for isocontouring, but variability was considerable (by a factor of 4) for normalized CBV thresholds. The variable threshold may in addition to possible errors related to kinetic modeling also reflect physiologically increased CBV in adjacent structures. Thus, the interplay between multiple factors such as lesion size, CBV signal intensity, and resolution of DCE imaging necessitates a subjective visual interpretation. To overcome the difficulties of defining a fixed threshold, one study of DSC CBV imaging applied an atlas-based Z-score approach to define areas of increased CBV.44 The authors found that increasing vasoactive volume at baseline was associated with shorter OS in patients scheduled for bevacizumab for recurrent GBM, also when accounting for the contrast-enhancing tumor volume. Our findings thus support an added prognostic value of the total high CBV tumor volume.
The second important finding was that the high CBV subvolumes (and fractions) within both the contrast-enhancing and metabolically active tumor volumes were independently and strongly associated with lower OS. Calculation of the high DSC CBV fraction within the contrast-enhancing volume has been suggested as a measure of active tumor versus treatment-related effects,12 and has been shown to correlate with histological tumor content yielding receiver operating characteristic area under the curve 0.85 for detection of > 50% tumor content.11 A small study (n = 25) also reported an association of the DSC high CBV fraction with OS in univariate Cox analysis.40 As opposed to the present analysis, these studies applied fixed cut-offs for CBV normalized to normal-appearing white matter, with increased CBV defined as normalized CBV > 1.0. The findings of the present study support that areas within the contrast-enhancing volume with increased CBV are more likely to harbor aggressive tumor components, irrespective of the MRI perfusion method and how the high CBV component is defined.
While MRI CBV imaging is generally accepted as a valuable addition to contrast-enhanced MRI, and the effect of CBV subvolume may be expected, it is noteworthy that similar observations were made for high CBV subvolumes within the metabolically active tumor volume PET. In clinical routine, the differentiation of reactive versus true tumor tracer uptake in treated gliomas poses a challenge for the interpretation of amino acid PET, in particular, for mildly to moderately active tissue, eg, TBR between 1.6 and 2.4. Our findings suggest that the low CBV components predict a more favorable long-term prognosis and also tend to correlate with early follow-up histopathology, but lacking image-correlated histopathological confirmation it is not possible to determine if low CBV reflects predominantly reactive tissue or merely represents less aggressive GBM components with low vascularity45 similar to low-grad gliomas.42,46 Regardless of the underlying biology, the presence of low CBV in a metabolically active component is predictive of a less aggressive clinical course and could allow for a strategy of observation and repeated imaging. However, present data for the 2CXM DCE approach are insufficient as a base for clinical decision rules and further studies are warranted.
As opposed to previous studies, we have extended the survival analysis to include the subvolume and fractions of contrast-enhancing or metabolically active tumor components that did not have measurable angiogenetic activity, indeed showing prognostic improvement over a conventional model including only VOLCE or VOLFET. This could reflect intralesional pathological heterogeneity47 and underline the importance of tumor vascularity in progressive development.
In general, prognostic biomarkers are of value for prediction of the clinical course, and of particular importance in clinical controlled trials. Eligible patients are often randomized by a web-based program and stratified by a minimization procedure to ensure balance within each group and overall balance including major prognostic factors, especially age, WHO PS, surgery for tumor recurrence, corticosteroid use at baseline, and diameter of the recurrent lesion. To this end, physiological imaging biomarkers, such as those derived from DCE, could contribute significant additional information. As shown in this study, a more differentiated approach may provide noteworthy prognostic factors.
Important strengths of the study are the large number of patients from a relatively homogenous patient population restricted to histologically verified GBM according to current tumor classification, following standard first-line therapy only, and use of a standardized imaging protocol applying fully quantitative DCE modeling and also including amino acid PET.
We applied 2CXM analysis to DCE data which may overcome some of the theoretical shortcomings of the more widely used extended Tofts model48,49 and thus provide more accurate parameter estimates across various vascular tissue properties. The 2CXM approach, however, imposes also the risk of overfitting the model to the data. Possibly a Patlak model would be more robust, but the permeability in contrast-enhancing areas may be too high for the assumption of only unidirectional transport to be fulfilled.
The study has some limitations mainly related to the study design. The study population was identified retrospectively and may differ from that of routine clinical imaging by including both patients with low suspicion of recurrence (eg, 3-month follow-up due to ambiguous MRI findings) and patients in whom a diagnosis of progression was made on MRI prior to PET/MRI. Also, imaging was not performed at a defined baseline during the disease course, and important clinical parameters (such as WHO PS) were due to the retrospective design not systematically recorded at the time of scan and not available for all patients. The manual adjustment of volumes, eg, by removing areas with larger vessels could have induced variation and a possible bias of the fractional subvolumes. However, we believe the adjusted volumes are overall more precise. Finally, the analyses presented here employed only basic tumor metrics, and for simplicity, we did not include results of prior imaging, other imaging features or other DCE parameters of potential importance, such as permeability or blood flow, in the analysis.
In conclusion, the present study shows that DCE CBV may provide additional prognostic information compared to both contrast-enhanced MRI and amino acid PET which may be of value both in clinical management and for balancing clinical trials. The high CBV tumor volume was the strongest prognostic factor, potentially enabling the differentiation of high- and low-risk prognostic subvolumes.
Funding
Author M.J.L. was supported by a grant from The Danish Childhood Cancer Foundation (2015-48).
Acknowledgments
We thank The John and Birthe Meyer Foundation who generously donated the Siemens Biograph mMR PET/MR scanners to the Copenhagen University Hospital Rigshospitalet. The authors would also like to thank all technologists and radiographers for scanner assistance.
Conflict of interest statement
The authors declare no competing interests.
Authorship Statement
All authors contributed to the study’s conception and design. Material preparation, data collection, and analysis were performed by O.M.H., A.M., M.J.L., A.E.H., K.M., V.A.L., and I.L. H.S.P. provided clinical information from the on-site clinical glioblastoma database. The first draft of the manuscript was written by O.M.H. and all authors commented on previous versions of the manuscript. All authors read and approved the final manuscript.
Data Availability
The datasets used and/or analyzed during the current study are available from the corresponding author upon reasonable request.
Ethics Approval
Retrospective use of clinical data from 2016 to 2019 was approved by the Danish Patient Safety Authority (reference no. 3-3013-1957/1), and from 2020 by the local hospital administration (Rigshospitalet). A subset of patients participated in prospective studies approved by the local ethics committee (H-17040888 and H-1-2013-062, respectively) conducted in accordance with the Helsinki Declaration.
Consent to Participate
Patients included in prospective studies gave informed written consent prior to the scan.
