


Abstract
Alterations in tumor growth rate (TGR) in recurrent glioblastoma (rGBM) after treatment may be useful for identifying therapeutic activity. The aim of this study was to assess the impact of volumetric TGR alterations on overall survival (OS) in rGBM treated with chemotherapy with or without radiation therapy (RT).
Sixty-one rGBM patients treated with chemotherapy with or without concomitant radiation therapy (RT) at 1st or 2nd recurrence were retrospectively examined. Pre- and post-treatment contrast enhancing volumes were computed. Patients were considered “responders” if they reached progression-free survival at 6 months (PFS6) and showed a decrease in TGR after treatment and “non-responders” if they didn’t reach PFS6 or if TGR increased.
Stratification by PFS6 and based on TGR resulted in significant differences in OS both for all patients and for patients without RT (P < 0.05). A decrease of TGR (P = 0.009), smaller baseline tumor volume (P = 0.02), O6-methylguanine-DNA methyltransferase promoter methylation (P = 0.048) and fewer number of recurrences (P = 0.048) were significantly associated with longer OS after controlling for age, sex and concomitant RT.
A decrease in TGR in patients with PFS6, along with smaller baseline tumor volume, were associated with a significantly longer OS in rGBM treated with chemotherapy with or without radiation. Importantly, all patients that exhibited PFS6 also showed a measurable decrease in TGR.
A small baseline tumor volume and a decrease in enhancing tumor growth rate after chemotherapy with or without radiation were associated with favorable survival.
All patients that exhibited PFS6 had a decrease in tumor growth rate after treatment.
The proper evaluation of treatment-related effects in recurrent glioblastoma (rGBM) is crucial for drug development. Alterations in tumor growth rate (TGR) in rGBM estimated before and after treatment may be a useful strategy for identifying antitumor therapeutic activity. We have proposed a new imaging endpoint based on the combination of progression-free survival at 6 months (PFS6) with a reduction after chemotherapy in TGR calculated from contrast-enhanced tumor volumes on MRI. In this retrospective study examining rGBM patients treated with chemotherapy, patients with PFS6 and a reduction in TGR showed significantly longer overall survival (OS). In addition, multivariable Cox regression analyses confirmed that continuous measures of change in volumetric TGR, as well as baseline tumor size, were independent prognostic factors for OS in rGBM treated with chemotherapy with or without radiation. This supports the use of TGR as an early and independent predictor of clinical benefit in rGBM.
Glioblastoma (GBM) is an aggressive tumor with an extremely poor prognosis.1,2 After recurrence, few standard treatment options exist,3,4 yet most exploratory new therapies are tested in recurrent glioblastoma (rGBM). In the setting of single arm phase 1 expansion or phase 2 trials in new therapies, time to event endpoints including progression-free survival (PFS) and overall survival (OS) are less informative due to numerous prognostic factors that are not controlled for, including baseline tumor size, age, O6-methylguanine-DNA methyltransferase (MGMT) status, etc.5–18 While objective response rates (ORRs) are meaningful in these single arm trial settings,19 many effective agents may result in at least temporary tumor growth rate stability and may not shrink the tumor to the degree required to reach a radiographic response. For this reason, we proposed a new imaging endpoint for identifying new promising therapies in single arm studies by defining a “clinical effect” in rGBM clinical trials defined through measurable alterations in tumor growth rate (TGR).20 Such an endpoint may bridge the gap between early phase trials that determine drug safety and late-stage trials quantifying efficacy.
Although many investigators agree that the proportion of patients with PFS longer than 6 months (PFS6) has merit and at a minimum is required, but not sufficient, for demonstration of clinical activity,21 investigators also agree that PFS6 alone is not meaningful due to numerous prognostic factors and the fact that adequate pretreatment tumor growth is not verified or used to isolate therapeutic effects. It relies on only posttreatment changes in tumor size and a slow growing, nonresponding tumor could reach PFS6 by chance. Since many studies have shown that slower posttreatment TGR22–24 are associated with longer OS in rGBM, an endpoint that uses alterations in TGR before and after treatment may be meaningful to demonstrate and isolate therapeutic effects in rGBM.20 We propose that a therapeutic effect can be identified:
(1) Increase or no change in TGR after treatment relative to baseline TGR → Drug is not working.
(2) Decrease in TGR relative to baseline TGR → Drug is working.
While we theorize that alterations in TGR are important for isolating therapeutic effects, durability of such effects need to be considered if there is to be translation of these effects into clinical benefit including OS. In addition, accurate estimates of TGR require a sufficient number of posttreatment time points and time on drug. Thus, we propose the addition of PFS6 as the minimum period of time an altered TGR needs to be sustained (Figure 1B).
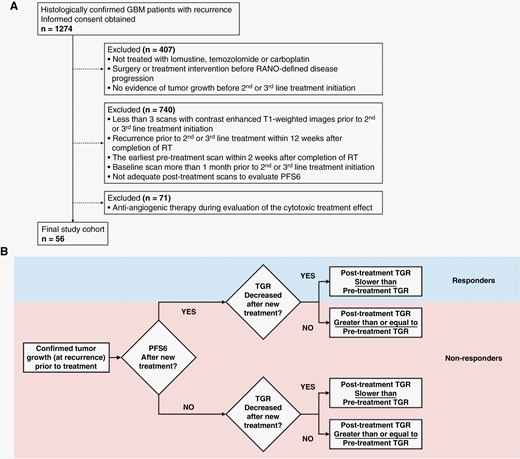
(A) CONSORT diagram. RT = radiation therapy. PFS = progression free survival. RANO = response assessment in neuro-oncology. (B) Proposed framework for determining therapeutic activity based on combination of PFS6 and change of tumor growth rate (TGR). Patients were categorized as “responders” if they reached PFS6 and TGR slowed after treatment start and “nonresponders” if they do not reach PFS6 or tumor growth rate had not slowed.
In the current retrospective “natural history study” we evaluated potential OS differences in rGBM patients treated with cytotoxic therapies including chemotherapy with and without radiation therapy (RT) based on traditional and newly proposed imaging endpoints, including PFS6 and alterations in TGR.
Materials and Methods
Patients
This retrospective study included consecutive patients of 1st or 2nd rGBM treated with chemotherapy (lomustine at 90–110 mg/m2, temozolomide at 150–200 mg/m2 or carboplatin at target area under the curve 5 mg/ml/min) between 2004 and 2022 at our institution. All patients gave informed written consent to be part of our IRB-approved Neuro Oncology Database. Patients were selected based on the following inclusion criteria: 1) at least three pretreatment scans with contrast enhanced T1-weighted images prior to 2nd or 3rd line treatment initiation; 2) recurrence prior to 2nd or 3rd line treatment at least 12 weeks after completion of RT and the earliest pretreatment scan at least two weeks after completion of RT to limit contamination of pretreatment TGR estimates; 3) the baseline scan (the 3rd pretreatment scan) performed less than 1 month prior to the 2nd or 3rd line treatment initiation; 4) evidence of tumor growth before the start of 2nd or 3rd line treatment; 5) adequate posttreatment scans to evaluate PFS6; 6) no use of anti-angiogenic therapy during evaluation of the cytotoxic treatment effect; and 7) no surgery or treatment interventions before response assessment in neuro-oncology (RANO)-defined disease progression21 (Figure 1A).
MR Data Acquisition
Most exams fulfilled requirements for the standardized brain tumor imaging protocol recommendations25; however, some patients were scanned prior to the 2015 recommendations. In general, all patients received either a two- or three-dimensional pre- and postcontrast T1-weighted fast spin-echo or gradient-echo sequence (repetition time/echo time/inversion time, 10–3410/1.2–24/0–1100 ms; section thickness, 1–5 mm; intersection gap, 0–7 mm; number of signals acquired, one to three; matrix size, 160–512 × 144–512; and field of view, 157–260 mm) on 1.5- or 3-T scanners (Skyra, Sonata, Verio, Prisma, Aera, Avanto, Sola, Vida, Trio or Espree [Siemens Healthcare, Erlangen, Germany]; Discovery MR750 or MR750W, Optima MR450w, Genesis Signa, or SIGNA Architect, EXCITE, HDx, HDxt, PET/MR or Premier [GE HealthCare, Waukesha, United States]; Achieva, Ingenia S or Intera [Phillips Healthcare, Best, Netherlands]; MRT200-PP5 [Toshiba Medical, Tokyo, Japan]) either at our institution or external institutions.
Contrast-Enhanced Tumor Volume Measurement
Subtraction maps of CE T1-weighted MR images were created using techniques previously described.1,9 Briefly, linear registration was first performed between pre- and postcontrast T1-weighted images by using a 12 degree-of-freedom transformation and a correlation coefficient cost function in FSL (FLIRT; FMRIB Software Library, Oxford, England; https://fsl.fmrib.ox.ac.uk/fsl/fslwiki). T2-weighted and/or FLAIR were also registered to pre- and postcontrast T1-weighted images using a 12 degree-of-freedom transformation and a mutual information cost function. Next, image intensity for both nonenhanced and contrast enhanced T1-weighted images was normalized using 3dUnifize of Analysis of Functional Neuroimages software (AFNI, https://afni.nimh.nih.gov).26 Then, voxel-by-voxel subtraction between normalized pre- and postcontrast T1-weighted images was performed. Image voxels with a positive (greater than zero) before-to-after change in normalized contrast enhancement signal intensity (ie, voxels increasing in MR signal after contrast agent administration) within T2-weighted FLAIR hyperintense regions were isolated to create the final T1 subtraction maps to exclude large vessels and other hyperintense regions outside the primary tumor area. Segmentation of contrast enhanced tumor lesion was performed automatically with guidance from NS-HGlio artificial intelligence device (Neosoma Inc, Groton, MA, https://neosomainc.com),27 or semi-automatically by manually defining the relative tumor region and determining thresholds on the subtraction maps using AFNI. These segmentations were then edited by a board-certified neuroradiologist to exclude any nontumor tissue.
Estimation of Tumor Growth Rate (TGR)
TGR was computed from pre- and posttreatment contrast-enhancing tumor volumes using a piecewise linear model with the treatment start date as day 0 (Figure 2) as previously described for nonenhancing tumor in IDH mutant gliomas.28–30 Tumor volumes from three time points prior to treatment initiation were used to estimate pretreatment TGR. Posttreatment TGR was estimated from all available timepoints over up to 6 months of treatment in patients with PFS6. In the case where the tumor progressed within 6 months of start of treatment, all posttreatment timepoints before and including the time of disease progression were used for analysis. To best estimate TGRs, pretreatment TGRs were first estimated to determine the y-intercept at the time of treatment initiation. Then, posttreatment TGR was estimated using the y-intercept estimated from the pretreatment TGRs. Change of TGR was determined by calculating the difference in slopes between pre- and posttreatment TGR.
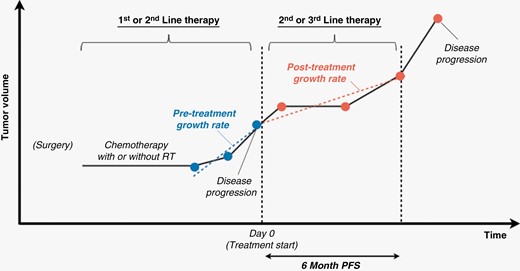
Pretreatment TGR was estimated using tumor volumes of three time points prior to treatment initiation. Posttreatment TGR was estimated from timepoints over six months or timepoints before and including disease progression within six months.
Definition of Clinical Effect
Tumor progression occurred when there were progressive imaging findings or clear clinical deterioration assessed by neuro-oncologists not attributable to other causes apart from the tumor. Progressive imaging findings were determined by a greater than 40% increase in contrast-enhanced tumor volumes compared with baseline scan or best response, or any new lesion.31,32 We applied these criteria to scans both before and after 2nd or 3rd line therapy. PFS6 was achieved when a patient showed no progression on or after 6 months. For the newly proposed endpoint categories,20 we determined “clinical effect” based on both PFS6 and TGR as follows: patients were categorized as “responders” if they reached PFS6 and TGR had slowed after treatment (negative difference in TGR) and “nonresponders” if they do not reach PFS6 or if PFS6 was reached but TGR did not decrease after treatment (Figure 1B).
Statistical Analysis
OS was determined as the time between the date of treatment initiation and death from any cause, otherwise OS was censored at the last date of clinical contact. OS was compared with respect to PFS6, and between “responders” and “nonresponders” using the newly proposed endpoint using a log-rank test applied to Kaplan–Meier data. We also explored the optimal threshold for change in TGR independent of PFS6 to stratify patients by calculating the Mantel–Haenszel hazard ratio and corresponding P values with changing the thresholds. Univariate Cox regression analysis was performed to assess the effect of continuous estimates of TGR change (cc/day), baseline tumor volume (cc), MGMT promoter methylation status, number of recurrences, and whether patients were treated with RT in addition to chemotherapy on OS from the time of therapy. Multivariate Cox regression analysis was also performed to adjust for age and sex. For each analysis, a subgroup of cases without concomitant RT at recurrence were evaluated separately. In multivariate analyses all reported P values were adjusted to control the overall false discovery rate.33 A P value less than 0.05 was considered statistically significant. Statistical analyses were performed using MATLAB (version R2018a, Mathworks, Inc., Natick, MA, USA).
Results
A total of 56 patients met the inclusion criteria out of 1274 rGBM patients who consented (Figure 1A; age, 60.2 ± 9.4 [mean ± standard deviation]; 35 males). Five patients were analyzed for both 1st and 2nd recurrences. Thus, a total of 61 evaluations were performed, including 44 cases after the 1st progression and 17 cases at the time of 2nd recurrence. For the analysis of patients who received chemotherapy without RT for 2nd or 3rd therapy, 42 patients were included and two of them were analyzed for both 1st and 2nd recurrences. Patient characteristics are summarized in Supplementary Table S1. The median OS from the start of treatment for recurrence was 403.0 days (range, 42–4348 days) for all 61 cases and 319.5 days (range, 42–1208 days) for the 44 cases receiving chemotherapy without RT.
A total of 9 of the 61 cases (14.8 %), and 6 of the 44 patients without radiation (13.6 %), were classified as “responders” according to the newly proposed imaging endpoint combining PFS6 with a decrease in TGR. Figure 3 shows representative cases of a “responder” and three examples of “non-responders.” OS in the cases considered “responders” was significantly longer than patients considered “non-responders” when evaluating all cases (Figure 4A; 560 [418–4348] days vs 314 [42–1581] days, respectively; P = 0.04) and for patients without RT (Figure 4B; 587 [418–1208] days vs 309 [42–994] days, respectively; P = 0.009). These comparisons were identical to those using PFS6 alone, including evaluations for all cases (560 [418–4348] days vs 314 [42–1581] days, respectively; P = 0.04) and for patients who did not receive RT (587 [418–1208] days vs 309 [42–994] days, respectively; P = 0.009). Out of 61 patients, 29 cases had increased TGR and didn’t achieve PFS6, while 32 patients showed decreased TGR and nine of them achieved PFS6. The optimal threshold for change in TGR independent of PFS6 was +0.1 cc/day (P < 0.001).
![Enhancing tumor volume plots and contrast-enhanced T1-weighted images of representative cases. (A) a 62-year-old male responder (progression-free survival at 6 months [PFS6] achieved/ post-treatment tumor growth rate [TGR] < 0), (B) a 59-year-old male non-responder (PFS6 not achieved/ post-treatment TGR < 0. This patient was classified as PFS6 not achieved because there was no evidence of progression-free scan on or after 6 months from treatment initiation.), (C) a 62-year-old male non-responder (PFS6 not achieved/ post-treatment TGR < pre-treatment TGR) and (D) a 61-year-old female non-responder (PFS6 not achieved/ post-treatment TGR > pre-treatment TGR).](https://oup.silverchair-cdn.com/oup/backfile/Content_public/Journal/noa/5/1/10.1093_noajnl_vdad084/1/m_vdad084_fig3.jpeg?Expires=1747897769&Signature=1JfRbGabJ4Zpigo6E0Qfo6lxZC~MdUH0S1~3p55YQ0YppIIQr7mdRQPFbGHqJz~X51CpRzEXPi54NQ8TPwnCVj1GXJ6mjhsg8LZcKYdFzpcfGTHkDdB7j5v-Ai3LuytnadQjKztmfP407lIBZ6fF3dgX8ZpZ-WEKFulBawQsg0QZiS-tESJVtQJTq1lknipDPQHF0DonFHI6aNSAUY3dJ~JDkCA6P-xPGl6WMjGHjcarvo0GJ3ui-POUfW4zZSjULfc8v4eGj~gWD0p2ZrCwQdSoBv8dRBGSgd01mPhBhoz6Fwz-O5nX9DthxRq11KtDf4K~BOoc1gpxNAJWIj9zLA__&Key-Pair-Id=APKAIE5G5CRDK6RD3PGA)
Enhancing tumor volume plots and contrast-enhanced T1-weighted images of representative cases. (A) a 62-year-old male responder (progression-free survival at 6 months [PFS6] achieved/ post-treatment tumor growth rate [TGR] < 0), (B) a 59-year-old male non-responder (PFS6 not achieved/ post-treatment TGR < 0. This patient was classified as PFS6 not achieved because there was no evidence of progression-free scan on or after 6 months from treatment initiation.), (C) a 62-year-old male non-responder (PFS6 not achieved/ post-treatment TGR < pre-treatment TGR) and (D) a 61-year-old female non-responder (PFS6 not achieved/ post-treatment TGR > pre-treatment TGR).

Comparison of overall survival (OS) between responders and non-responders based on progression-free survival after 6 months (PFS6) and a reduction in tumor growth rate (TGR) in patients treated with (A) chemotherapy or radiation therapy and (B) chemotherapy only.
Results of univariate and multivariate Cox regression analyses are shown in Table 1. Univariate Cox regression revealed that change in TGR (P < 0.001; HR [hazard ratio] = 26.97, 95% CI 5.16–140.89), baseline tumor volume (P < 0.001; HR = 1.07; 95% CI 1.03–1.11), number of recurrences (P = 0.001; HR = 3.18; 95% CI 1.57–6.45) and concomitant RT (P = 0.02; HR = 0.41; 95% CI 0.19–0.88) were significantly associated with OS. After controlling for age and sex, change in TGR (P = 0.009; HR = 14.66; 95% CI 2.72–78.99), baseline tumor volume (P = 0.02; HR = 1.09; 95% CI 1.02–1.17), MGMT promoter methylation status (P = 0.048; HR = 0.38; 95% CI 0.16–0.90) and the number of prior recurrences (P = 0.048; HR = 3.15; 95% CI 1.05–9.45) were significantly associated with OS. However, use of RT was not associated with a better OS when controlling for these other factors. For patients treated with chemotherapy alone, without concomitant radiation, change in TGR (P < 0.001; HR = 28.28; 95% CI 4.90–163.35), baseline tumor volume (P = 0.005; HR = 1.06; 95% CI 1.02–1.10), and number of recurrences (P = 0.007; HR = 3.33; 95% CI 1.39–7.94) were associated with OS for univariate analysis. Multivariable Cox regression controlling for age and sex verified that change in TGR (P = 0.01; HR = 13.28; 95% CI 2.35–75.21), and baseline tumor volume (P = 0.04; HR = 1.08; 95% CI 1.01–1.16), but not MGMT status nor the number of recurrences, were associated with OS benefit in patients treated with chemotherapy without radiation.
Univariate and Multivariate Cox Regression Analysis of OS in all 61 cases with chemotherapy or radiation and 44 cases with chemotherapy
| Chemotherapy or Radiation (n = 61 [in 56 patients]) | OS (Univariate) | OS (Multivariate)† | ||||
|---|---|---|---|---|---|---|
| Hazard Ratio (95% CI) | Z score | P value | Hazard Ratio (95% CI) | Z score | P value | |
| Increase of TGR (cc/day) | 26.97 (5.16–140.89) | 3.91 | <0.001** | 14.66 (2.72–78.99) | 3.13 | 0.009** |
| Baseline tumor volume (cc) | 1.07 (1.03–1.11) | 3.54 | <0.001** | 1.09 (1.02–1.17) | 2.64 | 0.02* |
| MGMT promoter methylation | 0.65 (0.31–1.36) | −1.14 | 0.25 | 0.38 (0.16–0.90) | −2.19 | 0.048* |
| Number of recurrences (2nd vs 1st) | 3.18 (1.57–6.45) | 3.20 | 0.001** | 3.15 (1.05–9.45) | 2.05 | 0.048* |
| RT | 0.41 (0.19–0.88) | −2.29 | 0.02* | 0.53 (0.20–1.41) | −1.27 | 0.20 |
| Chemotherapy (n = 44 [in 42 patients]) | OS (Univariate) | OS (Multivariate)† | ||||
| Hazard Ratio (95% CI) | Z score | P value | Hazard Ratio (95% CI) | Z score | P value | |
| Increase of TGR (cc/day) | 28.28 (4.90–163.35) | 3.74 | <0.001** | 13.28 (2.35–75.21) | 2.92 | 0.01* |
| Baseline tumor volume (cc) | 1.06 (1.02–1.10) | 2.81 | 0.005** | 1.08 (1.01–1.16) | 2.27 | 0.04* |
| MGMT promoter methylation | 0.59 (0.24–1.44) | −1.15 | 0.25 | 0.34 (0.11–1.05) | −1.87 | 0.08 |
| Number of recurrences (2nd vs 1st) | 3.33 (1.39–7.94) | 2.71 | 0.007** | 2.71 (0.68–10.79) | 1.42 | 0.16 |
†Controlling for age and sex. *P < 0.05, **P < 0.01.
OS, overall survival; RT, radiation therapy; TGR, tumor growth rate; MGMT, O6-methylguanine-DNA methyltransferase.
Discussion
The proper evaluation of even small treatment-related effects in rGBM are crucial for drug development. While a single arm early phase study in a new therapy may not meet strict ORR benchmarks that might lead to accelerated regulatory approval, evidence of slight alterations in TGR isolated to the investigative therapy can be useful for drug development, as dosing, timing, and combinations can be explored before extending to larger, late-stage trials. In addition, we theorized that better understanding the impact of TGR on survival in rGBM treated with commonly used cytotoxic treatments would allow us to better understand the likelihood of clinical benefit in a new drug using the same approach, providing some insight into potential clinical benefit in later-phase, randomized trials.
To test this hypothesis, the current study retrospectively evaluated 56 patients with rGBM over 61 unique treatment periods in order to evaluate whether PFS6 combined with a reduction in TGR after cytotoxic treatments translate into a significant OS. Consistent with our hypotheses, results in the current study show that PFS6 combined with a reduction in TGR translates to an OS benefit in rGBM treated with chemotherapies, including lomustine, temozolomide and carboplatin, with or without concomitant RT. Interestingly, categorization of response based solely on PFS6 was identical to categorization based on the combination of PFS6 and decreased TGR, suggesting all patients with PFS6 benefit had a decrease in TGR. Notably, not all patients with a decrease in TGR had PFS6. In patients whose TGR decreased but showed tumor progression in six months from treatment start, the tumors shrank after the initiation of chemotherapy but subsequently grew. At first glance this appears to support the use of PFS6 as a meaningful endpoint for single arm rGBM trials. However, it is important to note that there was significant selection bias in the current retrospective study, including verification of adequate pre-treatment TGRs, which may or may not occur if this approach was evaluated in a prospective trial. Conceivably, a prospective study with slightly less conservative inclusion criteria may allow slower growing tumor to be enrolled and therefore there could be a discrepancy between patients exhibiting PFS6 and those experiencing both PFS6 and a measurable decrease in TGR.
Despite no difference in OS between patients exhibiting PFS6 and those exhibiting both PFS6 and alterations in TGR, not all patients with a reduction in TGR after treatment had PFS6, and multivariable Cox regression analyses confirmed that continuous measures of change in TGR, as well as baseline tumor size, were independent prognostic factors for OS in rGBM. This is consistent with previous studies showing OS benefits in patients with small tumor size5–14 and slower growing tumors,10,22–24,34 and supports the use of TGR as an independent predictor of clinical benefit in rGBM. Although the confidence intervals of hazard ratios for TGR are large, future prospective studies with a larger number of patients are expected to more evidently demonstrate the value of TGR in predicting prognosis of rGBM. In addition, while MGMT status is known to be a prognostic factor for longer OS in newly diagnosed35 and recurrent GBM,15–18 results from the current study suggest this may be the most relevant in rGBM patients treated with cytotoxic chemotherapy plus concomitant RT.
There were significant limitations to the current retrospective study that need to be addressed. First, IDH mutation status could not be confirmed in all cases included in the current study because some cases were prior to identification of the IDH mutant subtype. However, all patients had WHO grade IV designation including the appearance of measurable contrast enhancement and sufficient pretreatment TGRs. Regardless, it is conceivable that some IDH mutant gliomas may have been included and could have impacted both imaging response as well as OS. Another important limitation was the heterogeneous image acquisition protocol, as many of these patients had exams prior to the 2015 consensus guidelines.25 Ideally, a standardized image acquisition protocol should be used to control technical factors that may influence accuracy of lesion measurements. Additionally, while we excluded patients treated concurrently with antiangiogenetic agents, alterations in corticosteroids dose were not considered but could conceivably affect estimates of enhancing tumor volume. Prospective studies controlling for steroid dose should be performed to confirm our findings, preferably in a larger cohort of patients from multiple centers. Furthermore, although we calculated enhancing tumor volumes, nonenhancing tumor volume of GBM can also affect OS.36 However, complete differentiation between nonenhancing tumor and edema is difficult, making the evaluation of tumor volume potentially inaccurate. Finally, although pseudoprogression is typically observed within first 3 months after concurrent temozolomide and radiotherapy,37 we cannot exclude the possibility of late treatment-related changes due to previous RT and pseudoprogression caused by concomitant RT during the treatment for recurrence that may have contaminated pre- and post-treatment TGR estimates.
Conclusions
In summary, results from the current study suggest a combination of PFS6 and reduction in TGR in rGBM after treatment with cytotoxic chemotherapy with or without concomitant radiation at 1st or 2nd recurrence significantly extends OS compared with patients that did not experience PFS6 or TGR decrease. Results also confirm that baseline tumor volume and changes in TGR after treatment are independent prognostic factors in rGBM.
Funding
This study was supported by grant from the National Brain Tumor Society (NBTS) and the Sontag Foundation, and funding from the National Institutes of Health (R01CA270027; R01CA279984; P50CA211015; NIGMS T32 GM008042) and the Department of Defense (CA20029; CA220732). SO has received grant from the Nakatani Foundation.
Conflict of Interest
BME is a Paid Consultant and Advisor for Siemens;Medicenna;MedQIA;Imaging Endpoints;Agios Pharmaceuticals;Neosoma;Janssen;Kazia;VBL;Oncoceutics;Boston Biomedical Inc;ImmunoGenesis;and Ellipses Pharma. BME has received grant funding from Siemens, Agios, and Janssen.
TFC is cofounder, major stock holder, consultant and board member of Katmai Pharmaceuticals, member of the board for the 501c3 Global Coalition for Adaptive Research, holds stock option of Notable Labs, holds stock in Chimerix and receives milestone payments and possible future royalties, member of the scientific advisory board for Break Through Cancer, member of the scientific advisory board for Cure Brain Cancer Foundation, has provided paid consulting services to GCAR;Gan & Lee;BrainStorm;Katmai;Sapience;Inovio;Vigeo Therapeutics;DNATrix;Tyme;SDP;Novartis;Roche; Kintara;Bayer;Merck;Boehinger Ingelheim;VBL;Amgen;Kiyatec;Odonate Therapeutics QED;Medefield;Pascal Biosciences;Bayer;Tocagen;Karyopharm;GW Pharma;Abbvie;VBI;Deciphera;VBL;Agios;;Genocea;Celgene;Puma;Lilly;BMS;Cortice;Wellcome Trust;Novocure;Novogen;Boston Biomedical;Sunovion;Human Longevity;Insys;ProNai;Pfizer;Notable labs;Medqia Trizel;Medscape and has contracts with UCLA for the Brain Tumor Program with Oncovir;Merck;Oncoceutics;Novartis;Amgen;Abbvie;DNAtrix;Beigene;BMS;AstraZeneca;Kazia;Agios;Boston Biomedical;Deciphera;Tocagen;Orbus;AstraZenica;Karyopharm.
Authorship
Conceptualization: SO, TFC, BME; Data collection: SO, AH, CR, CW, NSC, BSCE, PLN, AL, NS, TFC, BME; Analysis: SO, AH, CR, NSC, JL, DT, TFC, BME; Manuscript preparation: all authors.
