


Abstract
Among primary brain tumors, glioblastoma (GBM) is the most common and aggressive in adults, with limited treatment options. Our previous study showed that autologous formalin-fixed tumor vaccine (AFTV) contributed to prognostic improvements in newly diagnosed GBM patients. However, some patients died early despite the treatment. The discovery of predictive factors in the treatment was warranted for efficient patient recruitment and studies to overcome resistance mechanisms. Identifying prognostic factors will establish AFTV guidelines for patients who may respond to the therapy.
Data from 58 patients with newly diagnosed GBM, including 29 who received standard therapy plus AFTV (AFTV group) and 29 who received standard treatment (control group) were analyzed. Several data including patient age, sex, the extent of removal, and various cell immunohistochemistry (IHC) parameters were also included in the analysis.
Both univariate and multivariate analyses revealed that gross total resection (GTR) and negative p53 were associated with a better prognosis only in the AFTV group. In the IHC parameters, CD8 staining status was also one of the predictive factors in the univariate analysis. For blood cell-related data, lymphocyte counts of 1100 or more and monocyte counts of 280 or more before chemo-radiotherapy were significant factors for good prognosis in the univariate analysis.
A p53-negative status in IHC and GTR were the predictive factors for AFTV treatment in newly diagnosed GBM patients. Microenvironment-targeted treatment and pretreatment blood cell status may be key factors to enhance therapy effects.
We found that p53-negative statuses and gross total removal were significantly good prognostic factors only in vaccine group of GBM patients.
Immunoreactive tumor microenvironment may also be a candidate factor of the responsiveness to vaccine therapy.
Among immunotherapies for GBM, previous studies have shown the efficacy of autologous tumor vaccine treatment. In this study, we found that p53 negativity and gross total resection of the tumor were predictors of standard treatment with tumor vaccine, but not without vaccine. Immunoreactive tumor microenvironment (“hot tumor” cases), lymphocyte counts of 1100 or more before chemo-radiotherapy, and monocyte counts of 280 or more before chemo-radiotherapy may also be candidate factors of the responsiveness. It is expected to make a significant contribution to improving life expectancy and elucidating the mechanism of resistance in the future.
GBM is one of the most aggressive tumors in adults and intensive chemo-radiotherapy, including postoperative temozolomide (TMZ), achieves 3-year survival rates of less than 20% in patients with this disease.1 In a previous phase I/IIa trial, we showed that autologous formalin-fixed tumor vaccine (AFTV) therapy, applied additionally with standard treatment for GBM patients, was safe and feasible.2 A multivariate analysis of gross total resection (GTR) cases with newly diagnosed GBM showed that immunotherapy, including mainly AFTV treatment, contributed to prognostic improvements in both a retrospective cohort2 and prospective randomized study.3 However, some patients died early despite AFTV treatment.4 Previously, we found that high programmed cell death-1 (PD-1) expression in specimens of recurrent GBM patients treated with AFTV was associated with poor prognosis after recurrence, suggesting that the tumor immune microenvironment affected the prognosis despite no predictive immune markers in any initial cell specimens from 16 GBM patients.4 In other recurrent malignancies, such as breast and colorectal cancer, the outcome was found to be influenced by the immune microenvironment of the tumors.5 Therefore, we explored predictive factors, including immune cell-related markers, using data adjusted by propensity score matching of 58 newly diagnosed GBM patients at our hospital, 29 of whom were treated with AFTV while 29 simultaneously received standard treatment.
Materials and Methods
Patient Enrollment
A total of 58 patients with WHO grade IV GBM treated from May 2007 to December 2018 at our institution were enrolled in this study. Among them, 29 patients received standard treatment plus AFTV (AFTV group) and 29 other patients (control group) were selected by propensity score matching out of 89 total GBM patients who underwent standard treatment at the same time, adjusted for age, proportion of short-lived patients, and proportion of isocitrate dehydrogenase 1 (IDH1) mutant-type GBM. Gene panel testing was first performed to discover gene mutations that could affect the prognosis in the AFTV group patients. A cohort of 27 unintentionally selected, IDH1 wild-type patients, including 13 cases from the AFTV group and 14 cases from the control group, were included for the sequencing.
In all 58 patients, patient age, sex, Karnofsky performance status (KPS) at the time of surgery, lesion side, extent of removal (EOR), various cell counts/parameters (including white blood cells, neutrophils, lymphocytes, monocytes, neutrophil to lymphocyte ratio [NLR], and lymphocyte to monocyte ratio [LMR]), IDH status, MIB-1 index, p53 status, MGMT status, CD3, CD8, PD-1, programmed cell death-ligand (PD-L), CD20, and CD163 levels were examined. This experiment that enrolled patients and used human specimens was approved by the University of Tsukuba Ethics Committee (Approval No.: R01-165). The EOR was evaluated based on T1-weighted gadolinium-contrasted MR images within 3 days after surgery and the following definitions were used: gross total removal (GTR, 100% of EOR) with complete disappearance of the enhanced area, subtotal removal (STR) with 90% or more of tumor volume reduction or the maximum residual tumor diameter of 10 mm or less, partial resection between 5% and 90%, and biopsy with less than 5% of tumor removal.2
Histopathological Diagnosis
Histopathology diagnosis was made by pathologists at the University of Tsukuba according to the 2016 WHO criteria. Immunohistochemistry (IHC) included anti-Ki-67 (MIB-1, Dako), anti-p53 (DO-7, Dako), anti-IDH-1R132H (D299-3, MBL), anti-Alpha Thalassemia/Mental Retardation Syndrome X-Linked (ATRX) (HPA001906, Sigma Aldrich), anti-CD3 (SP7, Novus), anti-CD8 (SP16 Gene Tex), anti-CD20 (bs-0080R, Bios Inc), anti-CD163 (AB182422, Abcam), anti-PD-1 (AB224774, Abcam), and anti-PD-L1 (28-8, Abcam). For IDH-R132H, any cases with 50% or more positive cells were evaluated as positive while cases with less than 50% of positive cells were evaluated as negative. If patients were younger than 55 years, IDH status was confirmed by Sanger sequencing or next-generation sequencing. As for p53 status, 10% or less staining of p53 by IHC was classified as p53-negative. CD3, CD8, CD20, CD163, and PD-1 expression in infiltrating immune cells was recorded as 1 point (0–4 cells per high magnification field of view, ×400), 2 points (5–8 cells), 3 points (9–12 cells), or 4 points (>13 cells). The staining score, which is the sum of the 2 median values (2–8 points) for each of the three fields of view (a region with abundant blood vessels (median value [1–4 points] of 3 fields of view) and a region with relatively few blood vessels (median value [1–4 points] of 3 fields of view), was used. The expression of PD-L1 in tumor cells was assessed using staining scores of “-” (no staining), “+” (less than 25% stained cells), “++” (25%–50% stained cells), or “+++” (>50% stained cells).
DNA Extraction, Bisulfite Treatment, and Methylation-Specific Polymerase Chain Reaction
Genomic DNA extraction from freshly frozen tissues was conducted using the DNeasy® Blood and Tissue Kit (Qiagen) according to the manufacturer’s instructions. Genomic DNA extraction from formalin-fixed paraffin-embedded tissues was performed by our partner institution the Tsukuba Human Tissue Biobank Center (T-PASS). Briefly, after deparaffinization, all slides were scraped and dissolved in 360 μL of BufferATL (Qiagen) and 40 μL of Proteinase K (Qiagen) before incubating at 56°C overnight. Genomic DNA (1 μg) underwent bisulfite modification using the MethylEasy™Xceed Rapid DNA Bisulfite Modification Kit (Human Genetic Signatures) according to the manufacturer’s protocol. The modified DNA was purified and used immediately. Bisulfite-modified genomic DNA from Hela and U87 cell lines were used as positive controls for unmethylated and methylated DNA, respectively. Distilled water was used as a negative control.
Methylation-specific polymerase chain reaction (PCR) to verify the MGMT status was performed in a Veriti thermocycler (Applied Biosystems) using 50 ng of bisulfite-modified DNA in a total volume of 10 μL containing 5 μL of 2 × AmpliTaqGold FastPCR Master Mix (Applied Biosystems). Methylated or unmethylated MGMT PCR reactions were performed at 95°C for 10 minutes, followed by 40 cycles of denaturation at 96°C for 30 seconds, annealing at 62°C for 30 seconds, elongation at 68°C for 30 seconds, and a final elongation step at 72°C for 30 seconds. The PCR products were electrophoresed in a 2% agarose gel and stained with ethidium bromide at a final concentration of 0.1 μg/mL.
Gene Panel Testing and Bioinformatics Analysis
Cancer panel testing was conducted using a comprehensive cancer panel (Qiagen QIAseq Targeted DNA Panels) to investigate the presence or absence of 275 known oncogene deletions and SNPs (scoring: probably damaged, possibly damaged, or benign). Gene panel testing was performed at Tsukuba i-Laboratory LLP using next-generation sequencing. For the analysis, genomic DNA extraction from formalin-fixed paraffin-embedded tissues was performed at our partner institution the Tsukuba Human Tissue Biobank Center (T-PASS).
In this study, DNA was extracted from the patient’s tumor cells while SNPs that did not affect the amino acid sequence and SNPs in the normal range were deleted using the Japanese Whole Genome Reference Panel (38KJPN). In addition, the effect of SNPs on gene mutations was tested manually and deleted using poly-phen2 (http://genetics.bwh.harvard.edu/pph2/bgi.shtml).
Statistical Analysis
Statistical analysis was performed using standard statistical software (IBM SPSS statistics version 27.0 Macintosh: SPSS, Chicago, Illinois, USA). Survival time from diagnosis to death or last follow-up was estimated using the Kaplan–Meier method and the log-rank test was used to evaluate the groups in comparison. Less than 0.05 for 2-sided P-values was considered statistically significant. The Mann–Whitney U test was used to compare each continuous variable of the AFTV and control groups. These groups were also compared in 2 groups: Those with a survival time of 36 months or longer and those with a survival time of less than 36 months to investigate whether any items were involved in survival. All tests were 2-sided and a P-value less than .05 was considered statistically significant. Propensity scores for each patient were calculated using a 1:1 nearest neighbor matching method and caliper matching was employed to limit the log standard deviation of the propensity scores to 0.20 to prevent differences between matched pairs.
Results
Significant Consistence of TP53 Alterations With IHC p53 Positivity in Gene Panel Testing
A gene panel test using a next-generation sequencer was performed in 27 patients, including 13 in the AFTV group and 14 in the control group. Of these, 30% (8 patients) had TP53 alterations, including benign genetic mutations, and other genetic alterations. Pathogenic mutations were found in 41% (11 patients) of TERT carriers and in 15% (4 patients) of IDH1 carriers (Supplementary Figure 1). In addition, TP53 alteration was highly correlated with p53 positivity by IHC (P < .01, data not shown). As a result, 15 genetic alterations were correlated with prognoses in the AFTV group (but not in the control group) and, among those 15 genes, 5 were associated with TP53 alterations (detailed data not shown).
p53 Staining Status Predicts the Prognosis in AFTV-Treated Patients
We validated whether p53 IHC status predicts the survival of AFTV-treated patients in 2 matched cohorts totaling 58 patients. The pathological background of the 2 matched groups is shown in Table 1. In these cohorts, 51.7% (15 patients) were men, 34.5% (10 cases) of the tumors were on left side, and 69.0% (20 patients) underwent GTR. The 36-month survival rate of 29 patients in the AFTV group was approximately 44%. The median age, KPS, and overall survival (OS) were 61.0 years, 80, and 32.6 months, respectively. As shown in Figure 1A, there was no difference between the median OS in the 2 groups as 29 GBM patients in the control group who received standard treatment were adjusted for the proportion of short-lived patients, as well as age and IDH status. However, the survival curve showed a tail plateau, indicating that there were patients with longer survival in the AFTV group. Regarding pathological features, an MIB-1 index < 30% was exhibited in 69% (20 cases) of patients (median value of 23.9%), the p53 status was negative in 44.8% of patients (13 cases), 59% of patients (17 cases) showed a methylated MGMT status, and IDH1(R132) was mutated in 17% of patients (5 cases) in the AFTV group. Compared to the control group, there were no significant differences in the patient backgrounds, except for the MIB-1 indices and PD-1 scores. (Table 1)
Characteristics and the Pathological Background of 29 Patients Treated With Chemo-radiotherapy and Autologous Formalin-Fixed Tumor Vaccine (AFTV) (the AFTV Group) and 29 Patients Treated With Standard Chemo-radiotherapy Adjusted for Age, IDH Status, and OS by Propensity Score Matching (Control Group)
| AFTV Group (29 Cases) | Non-AFTV Group (29 Cases, Adjusted for Age, IDH Status, and OS by Propensity Score Matching) | P-value | |
|---|---|---|---|
| Age (median, year-old, [min–max]) | 61(39–74) | 60(median) | Adjusted (.396*) |
| Sex (cases, M/F) | 15(51.7%)/ 14 | 22(75.9%)/ 7 | .100** |
| Lesion side (cases, Left/Right) | 10(34.5%)/ 19 | 18(62.1%)/ 11 | .065** |
| KPS (median, [min–max]) | 80 (50−100) | 90 (50−100) | .452* |
| Extent of removal (GTR/ non-GTR) | 20(69.0%)/ 9 | 15(51.7%)/14 | .283** |
| OS (median months, [95% C.I.]) | 32.6 (20.1−45.2) | 31.1 (16.1−46.1) | Adjusted (.277***) |
| WBCs before surgery (median, [min–max]) | 6.70 × 10^3(3.90−23.4) | 6.50 × 10^3(2.70−13.8) | .750* |
| Neutrophils before surgery (median, [min–max]) | 5.00 × 10^3(2.2−20.8) | 4.55 × 10^3(1.51−12.36) | .616* |
| Lymphocytes before surgery (median, [min–max])# | 1.23 × 10^3(0.312−2.52) | 1.41 × 10^3(0.123−3.59) | .064* |
| Monocytes before surgery (median, [min–max]) # | 0.313 × 10^3(0.135−1.64) | 0.340 × 10^3(0.123−0.895) | .457 |
| NLR before surgery (median, [min–max]) # | 4.02 (1.75−47.5) | 2.61 (1.34−98.0) | .087 |
| MLR before surgery (median, [min–max]) # | 4.08 (0.57−7.00) | 4.19 (0.72−9.33) | .299 |
| WBCs before chemo-radiotherapy (median, [min–max]) | 5.70 × 10^3(2.70−16.2) | 5.30 × 10^3(2.90−10.2) | .674 |
| Neutrophils before chemo-radiotherapy (median, [min–max]) | 3.61 × 10^3(1.34−13.0) | 3.67 × 10^3(1.70−7.23) | .624 |
| Lymphocytes before chemo-radiotherapy (median, [min–max]) | 1.17 × 10^3(0.422−2.55) | 1.34 × 10^3(0.259−3.47) | .122 |
| Monocytes before chemo-radiotherapy (median, [min–max]) | 0.281 × 10^3(0.0424−1.34) | 0.353 × 10^3(0.00−0.588) | .339 |
| NLR before chemo-radiotherapy (median, [min–max]) | 3.43 (1.15−18.7) | 2.25 (1.12−18.4) | .174 |
| MLR before chemo-radiotherapy (median, [min–max]) | 4.24 (1.31−26.5) | 4.54 (0.50−999) | .437 |
| Ki -67index (<30%/ >=30%) | 20/ 9 | 5/ 24 | .000** |
| p53 (<10%/ >=10%/ not determined) | 13/ 15/ 1 | 13/16/ 0 | .597& |
| MGMT (met,/unmet/unknown) | 17/10/2 | 12/17/0 | .096& |
| IDH-1R132 (negative/ positive/ unknown) | 24/ 5/ 0 | 23/ 4/ 2 | Adjusted (.344&) |
| CD3 (median score) | 4 | 4 | .326* |
| CD8 (median score) | 4 | 4 | .578* |
| PD-1 (median score) | 4 | 3 | .005* |
| PD-L1 (median score) | 4 | 4 | .659* |
| CD20 (median score) | 3 | 2 | .299* |
| CD163 (median score) | 6 | 6 | .903* |
* Mann–Whitney U test, ** Fisher’s Exact Test, ***Log-Rank Test, and Pearson’s x2 Test. # Uncertain data regarding monocyte and lymphocyte counts before surgery in 4 cases are excluded from these analyses.
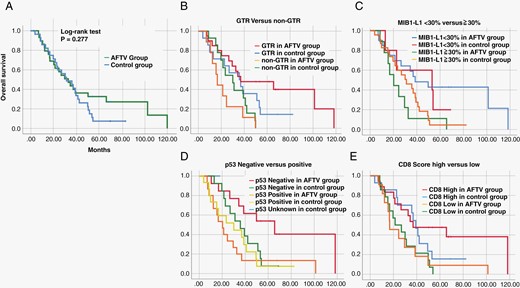
A Survival curves of 29 GBM patients who received standard treatment plus autologous formalin-fixed tumor vaccine (AFTV) (the AFTV group) and 29 GBM patients who underwent standard treatment at the same time, adjusted for age, IDH, and overall survival (OS) by propensity score matching (the control group). B-E Survival curves of gross total resection (GTR) and non-GTR cases (B), cases with higher and lower MIB-1 indices (C), positive and negative p53 statuses (D), and higher and lower CD8 scores (E) in AFTV and control groups.
The p53 IHC status (positive or negative) was also used for subsequent analyses as an alternative to TP53 alteration and TP53-associated gene alterations since TP53 alteration highly correlated with p53 positivity by IHC, as described in the present (P < .01) and the previous work (P < .001).6 As expected, the log-rank test for the OS showed a negative p53 status (<10%), with a statistically better prognosis in the AFTV group (Figure 1, Table 2), indicating that p53-staining of formalin-fixed tumor samples after surgery can predict the efficacy of AFTV treatment.
Univariate Analysis of Various Background Factors Influencing the OS in the Autologous Formalin-Fixed Tumor Vaccine (AFTV) and Control Groups Using the Log-Rank Test
| 29 AFTV Cases | 29 Control (non-AFTV) Cases | ||||
|---|---|---|---|---|---|
| Median OS (Months) | P-value, Log-Rank Test | Median OS (Months) | P-value, Log-Rank Test | ||
| Age (year) | ≧55 | 32.6 | 26.8 | ||
| <55 | 21.2 | .811 | 35.8 | .307 | |
| Sex | M | 26.5 | 35.8 | ||
| F | 32.6 | .581 | 13.0 | .835 | |
| Lesion side | L | 29.5 | 26.8 | ||
| R | 32.6 | .998 | 38.7 | .327 | |
| KPS | ≧80 | 26.5 | 38.7 | ||
| <80 | 65.6 | .308 | 16.7 | .042 | |
| Extent of removal | GTR | 36.9 | 35.8 | ||
| Non-GTR | 16.5 | .005 | 30.0 | .185 | |
| MIB-1 index | <30% | 38.7 | .014 | 53.1 | .107 |
| ≧30% | 20.2 | 31.1 | |||
| p53 | <10% | 65.6 | .007 | 35.8 | .336 |
| ≧10% | 20.2 | 30.0 | |||
| MGMT | M | 24.5 | .953 | 35.8 | .571 |
| UM | 32.6 | 23.5 | |||
| IDH | Negative | 34.4 | .302 | 30.0 | .188 |
| Positive | 29.5 | 38.7 | |||
| CD3 | <4 | 16.8 | .108 | 21.4 | .462 |
| ≧4 | 38.7 | 36.9 | |||
| CD8 | <4 | 16.8 | .027 | 21.4 | .122 |
| ≧4 | 36.9 | 39.2 | |||
| PD-1 | <4 | 36.9 | .604 | 39.2 | .020 |
| ≧4 | 29.5 | 22.7 | |||
| PD-L1 | <4 | 32.6 | .710 | 30.0 | .266 |
| ≧4 | 29.5 | 38.7 | |||
| CD20 | <3 | 21.2 | .143 | 26.8 | .121 |
| ≧3 | 38.7 | 39.2 | |||
| CD163 | <6 | 29.5 | .594 | 42.2 | .040 |
| ≧6 | 34.4 | 23.5 | |||
The Relationship of p53-Negative Status With Immunosuppressive Microenvironment and AFTV Treatment Enhancement
We additionally analyzed other factors affecting the survival of AFTV-treated patients. While GTR appeared to be a predictive factor as expected, interestingly, the log-rank test for OS within the AFTV group showed an inverted median OS value compared to expectations from well-known prognostic factors in GBM (age, KPS, and MGMT status) (Table 2). Pointing to the unique characteristic of the ATFV treatment, it is also noteworthy that a higher CD8 score (≥4) indicated a statistically better prognosis, which was undetected in our previous, retrospective study (Figure 1, Table 2). Supplementary Figure 2A shows the relation of immune cell scores in p53-negative and -positive groups. As shown in Supplementary Figures 2B and C, CD20 scores in the p53-negative group tended to be higher than those in the p53-positive group when GBM specimens were analyzed before chemo-radiotherapy with or without AFTV treatment (P = .078 in all 58 GBM patients and P = .050 in 47 IDH-wild-type GBM patients, Mann–Whitney U test). There were no differences between p53 status and other immune cell scores (P > .1 in all other pairs, Mann–Whitney U test). As shown in Supplementary Figure 2D, positive relationships between CD3, CD8, and CD20 were found but there was no relationship between PD-1/PD-L1 staining and those immune cell counts.
In addition, a multivariate analysis using Cox regression proportional hazards modeling with EOR (P = .028, HR = 0.244, 95% CI 0.070 to 0.856), p53 status (P = .042, HR = 0.336, 95% CI 0.118 to 0.959), MIB-1 index (P = .066, HR = 0.390, 95% CI 0.143 to 1.063), and CD8 score (P = .844, HR = 1.123, 95% CI 0.355 to 3.552) had results which were significantly different than the univariate analysis of AFTV case data. This result showed that p53 and GTR were significant prognostic factors in the AFTV group. (Figure 2), shown using Dr. Tsuchiya’s technique (https://researchmap.jp/blogs/blog_entries/view/77413/e6ebe1e7fa3fee14440e63d7efd60f56?frame_id=563988).
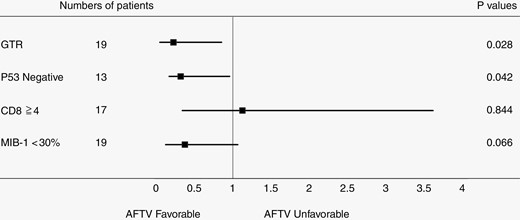
Multivariate analysis using Cox regression proportional hazards model with extent of removal, p53 status, MIB-1 index, and CD8 score in the autologous formalin-fixed tumor vaccine group, excluding cases with unknown p53 status.
Taken together, our data suggest that p53-negative status affects patient survival after adjuvant treatment with AFTV. Additional treatment targeting p53 status may be a key to overcoming the mechanism of tumor resistance.
Pretreatment Blood Cell Count and Its Effect on Response to AFTV Treatment
As for various blood cell-related data, their median values in the AFTV group were used as cutoff values. We found that 1500/µL or more lymphocytes plus monocytes before surgery (P = .048), 1100/µL or more lymphocytes before chemo-radiotherapy (P = .038), and 280/µL or more monocytes before chemo-radiotherapy (P = .013) were significant factors for good prognoses in univariate analysis (Supplementary Table 1, Figure 3), although these factors were not significant in multivariate analysis using the Cox regression proportional hazards model. pretreatment blood cell status may be another key to enhancing the effect of AFTV treatment.
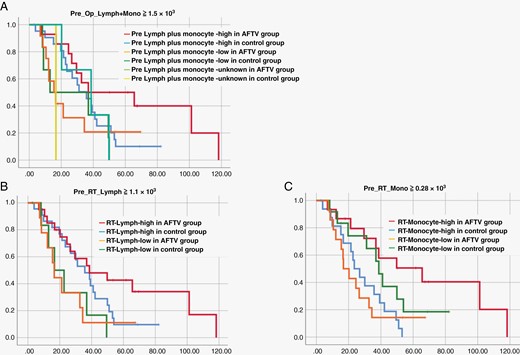
Survival curves adjusted for lymphocyte plus monocyte counts before surgery (A), the lymphocyte count before chemo-radiotherapy (B), and the monocyte count before chemo-radiotherapy (C) in autologous formalin-fixed tumor vaccine and control groups.
Discussion
GBM Immunotherapy
Immunotherapy has shown marked improvements in the treatment of solid tumors, such as melanoma, renal cell carcinoma, and non-small cell lung cancer,7–9 and there is interest in applying immunotherapy to GBM. However, early trials of checkpoint inhibitors and vaccine therapy for GBM were largely disappointing in both primary and recurrent GBM. This failure has been attributed to the highly immunosuppressive environment of GBM4,10,11 and multiple mechanisms of treatment resistance, including high tumor heterogeneity,12,13 low mutational burden,14,15 systemic immunosuppression,16,17 and local immune dysfunction due to T-cell exhaustion,17–19 suggesting a shift to personalized, patient-specific GBM therapy in the future.20 In this context, a multicenter, double-blind phase IIb trial of AFTV treatment reported that the 3-year OS rate was 80% in patients who underwent total resection and suggested that effective treatment is possible, especially after total tumor removal.3 In this study, we were able to identify treatment response factors as shown below.
p53-negative IHC Status as a Prognostic Factor for AFTV
For GBM after standard therapy, prognostic factors include age, preoperative PS, tumor location, preoperative imaging characteristics of the tumor, and the extent of resection.21,22 Molecular markers associated with prognosis have also been identified, which include MGMT gene promoter methylation status, IDH mutations, and tumor protein (TP53) mutations. MGMT promoter methylation has prognostic and predictive significance in GBM patients with good OS regardless of treatment choice.23–25 In addition, the MGMT promoter is associated with a better response to TMZ and RT, with the combination treatment approach (TMZ + RT) improving progression-free survival and OS more than either of these therapies alone.26,27 The prognosis in high-grade gliomas with IDH1 mutations is better than without such mutations.28 Although TP53 mutations as prognostic markers in GBM patients were reported as inconclusive in GBM treated with standard therapy,29–31 unlike TP53 mutations in LGG, they may increase the efficacy of chemotherapy and lead to a better prognosis.6
In this study, p53-negative IHC status, suggestive of wild-type TP53, was a good prognostic factor for AFTV. We have previously shown that p53-negative tumors treated with radiotherapy were more likely to be eliminated by immune cells than p53-positive tumors in a vitro study.32 Our other, previous clinical study also suggested this p53-negative IHC status2 in vaccine group as a good prognostic factor,2 since TP53 is a gene repair factor that functions as a tetramer, activates transcription under extracellular stress, and performs gene repair and metabolic regulation according to the degree of stress. When stress exceeds the limit, it also induces apoptosis.33 Donehower et al. showed that TP53-mutant tumors have a significantly higher number of mutations per tumor than wild-type TP53 tumors.34 This is thought to be due to the propensity of TP53 to be relatively mutation susceptible due to chromosomal instability, making it likely that such mutations also occur in function-related genes. Recent studies showed that wild-type TP53 GBMs had a statistically significant higher immune response.29 In this study, 332 immune-related genes were identified in GBM tissues, and the immune response in the wild-type TP53 group was significantly greater than in the mutant-type TP53 group.29 Deregulation of the p53 pathway, particularly from TP53 somatic mutations and MDM2 amplifications, was strongly associated with an increased fraction of sub-clonal mutations in GBM, an association independent of age.35 In addition, very low tumor mutation burden (TMB) in GBM is associated with higher immune response in tumor microenvironments and longer survival after recombinant polio virotherapy or immune checkpoint blockade in recurrent GBM patients.36 Conversely, the relationship between TMB and survival is not observed in cohorts of immunotherapy-naïve, newly diagnosed, or recurrent GBM patients.36 Another report also showed that TMB was correlated with expressed neoantigen but showed an inverse correlation with the immune score in IDH-wild-type tumors while the Antigen Processing and Presentation (APP) score correlated with the immune score and was higher in non-hypermutator phenotypes of IDH-wild-type gliomas.37
Thus, it has been shown that patients with wild-type TP53 GBM under immunotherapy have a higher immune response with the apparent abundance of immune-related genes and pathways of immune response than those with mutant TP53.29
Immune Cells in GBM Microenvironment as Prognostic Factors
Our results indicate that an immunoreactive tumor (“hot tumor”) microenvironment, as well as wild-type p53 status, are key factors of immunotherapy responsiveness in GBM patients. CD8-positive cells, which are representative immune cells in the hot tumor microenvironment, are T cells that have differentiated into cytotoxic T cells. Large infiltration of CD8-positive cells into a tumorigenesis-rich microenvironment is thus a favorable prognostic factor for GBM.38 Higher CD8 scores in the AFTV-treated group also showed statistically better prognoses compared to the control group, although multivariate analysis using AFTV-treated patient data did not indicate that CD8 was a significant prognostic factor. Regarding the evaluation of prognostic factors in long-term survivors (over 60 months), higher CD3 counts in patients who received AFTV were associated with long-term survival. These results indicate that vaccine therapy may be effective against GBM in hot tumor cases where immune cells are present in abundance. It is highly likely that such a CD8-infiltrating microenvironment indicates where cytotoxic T cells have eliminated tumor cells with the target antigen. Judging from the results of this study, which showed a high survival rate in cases with GTR, AFTV treatment may have allowed acquired immune cells to acquire the antigen information of the remaining tumor, synergistically enhancing postoperative tumor volume reduction.
Regarding immune cells in the GBM microenvironment, a previous study showed that mesenchymal GBMs displayed the highest percentage of microglia, macrophage (Mф) and lymphocyte infiltration, and a higher percentage of CD163 + cells that were associated with a worse GBM prognosis.39 Similarly, in the present study, a higher CD163 score was associated with a poorer prognosis in the control group as CD163-positive cells usually indicate M2 Mф with pro-tumor immunosuppression. M2 Mф have a wide range of tumor growth-promoting abilities such as immunosuppressive cytokine production, tumor stem cell maintenance, angiogenesis, tumor infiltration promotion, and epithelial-mesenchymal transition promotion.40 In cases of lower ratios of M2 Mф, relatively higher ratios of the cytotoxic cells in the GBM microenvironment can directly affect prolonged survival versus a standard treatment group. On the other hand, prognoses were not affected by M2 Mф infiltration in the tumor microenvironments of the AFTV group in this study. This indicates that if these immunosuppressive cells are reduced along with the tumor cells by surgical resection, then vaccine therapy may more likely overcome any immunosuppressive cells.
Blood Cell Count as a Prognostic Factor
Absolute counts of peripheral immune cells, such as neutrophils, monocytes and lymphocytes, and also NLRs and LMRs, are widely used as systemic inflammation and prognostic markers for various malignant tumors. In this study, low LMR was a poor prognostic factor in the control group. In various cancers, however, high NLR is considered to be a good prognostic factor,41,42 but it has not been associated with a good prognosis in glioma patients in previous studies,43,44 including our study. Similarly, a high LMR is considered a good prognostic factor in lung cancer45 whereas this parameter has not been associated with a good prognosis in glioma patients.46 Neutrophils secrete angiogenic growth factors, such as vascular endothelial growth factor (VEGF) and matrix metalloproteinase, and inhibit the cytotoxic activity of other immune cells such as natural killer cells and activated T cells. It may therefore contribute substantially to the tumorigenicity-promoting microenvironment.47 In contrast, as an integral part of anticancer immunity, lymphocytes suppress tumor progression and eliminate neoplastic cells.
Circulating monocytes have tumorigenic properties if they differentiate into tumor-related Mф (TAMs) and alter the tumor microenvironment, promoting immune avoidance, angiogenesis, and dissemination of metastatic cells.48 Monocytes have also been shown to promote angiogenesis through the secretion of factors such as VEGF and tumor necrosis factor-α (TNF-α) in a heterologous glioma transplant model.49 Therefore, lower LMRs due to increased monocyte counts and/or decreased lymphocyte counts theoretically lead to increased tumor-promoting effects of the immune system. On the contrary, in this study, among blood cell-related data, lymphocyte plus monocyte counts of 1500/µL or more before surgery, lymphocyte counts of 1100/µL or more before chemo-radiotherapy, and monocyte counts of 280/µL or more before chemo-radiotherapy were significantly good prognostic factors in the AFTV group (Supplementary Table 1). These results suggest that in the AFTV group, the presence of sufficient numbers of both blood circulating lymphocytes and monocytes at the start of GBM treatment enhances anti-tumor immunity by supplying killer lymphocytes from blood circulating lymphocytes and antigen-presenting cells from blood circulating monocytes in response to stimulation by AFTV administration, respectively. Alternatively, only one of them may be associated with prognosis since lymphocytes and monocytes before chemo-radiotherapy are correlated (Supplementary Figure 3). According to Zhang et al., monocytes within the tumor may improve the prognosis by dendric cell differentiation but also may worsen the prognosis by differentiating into tumor-associated macrophages.50 In this paper, “high-risk score group,” classified by monocyte-related genes, was associated with cold tumor microenvironment consisting of high infiltration of monocytes and monocyte-derived M2 macrophages and depletion of tumor-infiltrating lymphocytes,50 but the relationship between the number of mononuclear cells in the peripheral blood and mononuclear cell infiltration of tissues is unknown. Also, CD163 staining showed no significant difference between the 2 p53 IHC statuses (Supplementary Figure 2B-C). Further validations and studies are warranted to decipher the function of monocyte in GBM patients under AFTV.
Study Limitations
A limitation of this study is that the number of patients enrolled in both the AFTV and control groups was relatively small. A larger number of patients should be enrolled in future studies. Secondly, the number of patients with MIB-1 < 30% was higher in the AFTV group and there were more cases of left-side tumor localization in the control group. In addition, there were many cases in which MGMT was fully methylated. In order to adjust the control and AFTV groups, particularly poor prognosis cases were excluded from the control group, which may have affected prognostic factors for that specific group. In addition, KPS, MGMT, and IDH did not affect OS in the AFTV group compared to the control group (Table 2), suggesting that previously considered prognostic factors may not be applicable to AFTV treatment.
Furthermore, this study does not directly demonstrate whether p53 status affects the immunosuppressive GBM microenvironment after adjuvant treatment with AFTV treatment. Given the tendency of CD20-positive cells to be scored differently depending on p53 status prior to adjuvant treatment, changes in the microenvironment after adjuvant treatment with or without AFTV in p53-negative and -positive GBM cases need to be evaluated in future studies.
Future Research
Panel sequencing of all patients should be performed to analyze and examine whether there is a correlation between prognosis and AFTV treatment. Gene panel immunostaining and PCR should also be added based on the results of additional gene panel testing.
Conclusions
Through multivariate analysis, we found that p53-negative statuses in IHC and GTR were significantly good prognostic factors only in vaccine therapy group (but not in standard therapy group) of GBM patients. Immunoreactive tumor microenvironment (“hot tumor” cases) may also be a candidate factor of the responsiveness to vaccine therapy in GBM patients, although multivariate analysis has not yet confirmed its significance. In addition, counts of 1500/µL of peripheral lymphocytes plus monocytes or more before surgery, 1100/µL of lymphocytes or more before chemo-radiotherapy, and 280/µL of monocytes or more before chemo-radiotherapy were predictors of good prognoses.
Funding
Supported by Grant number 18K08962 from a Grant-in-Aid for Scientific Research in Japan.
Acknowledgment
We thank Ms Tsukada and Ms. Miyakawa (Department of Neurosurgery, University of Tsukuba) for their technical support, Dr. Bryan J. Mathis (International Medical Center, University of Tsukuba Hospital) and Dr. Alexander Zaboronok (Department of Neurosurgery, University of Tsukuba) for language revision.
Conflict of interest statement
Materials for the AFTV described in this article were provided by Cell-Medicine, Inc. (CMI), a venture company for research and development of immunotherapy established by the initiative of RIKEN (The Institute of Physical and Chemical Research) and the University of Tsukuba in Japan. The authors declare that T.M. is a member of CMI, and other authors have no conflicts of interest regarding this study.
Authorship statement
Study concept and design: E.Y., E.I. Data collection: E.Y., E.I., N.Su., N.Sa. Analysis and interpretation of data: E.Y., E.I. Drafting of the manuscript: E.Y., E.I. Revising of the manuscript: E.Y., E.I., T.M., S.M., N.Su., H.K., T.T., S.W., M.M. Supervising of the study: E.I.
Data Availability
Raw data were generated at Department of Neurosurgery, University of Tsukuba. Derived data supporting the findings of this study are available from the corresponding author (E.I.) on request.
References
Author notes
These authors contributed equally to this work.
