


Abstract
Radiation therapy plays a vital role in the management of primary spinal tumors in adults. However, due to the rarity of these tumor types, the literature on optimal treatment indications and radiation doses is limited. Many treatment recommendations are extrapolated from their cranial counterparts, where more data are available. Despite the absence of prospective data, numerous retrospective studies have provided valuable insights to guide treatment decisions until more comprehensive data become available. This review provides an overview of the most relevant literature, with a specific focus on spinal gliomas, ependymomas, and meningiomas, in the context of the role of radiation therapy.
Spinal tumors are a notably rare disease in adults, with an estimated frequency of only around 1 case per 1 000 000 persons per year.1 In addition to surgical intervention, radiotherapy (RT) plays a significant role in managing these tumors. Nevertheless, it is of utmost importance to recognize that the spinal cord is exceptionally sensitive to radiation exposure, which poses a substantial risk of causing myelopathy. Such complications can significantly diminish a patient’s quality of life and even prove to be life threatening.2 This inherent sensitivity must be carefully taken into consideration when prescribing treatment doses for spinal tumor therapy. According to the QUANTEC (Quantitative Analysis of Normal Tissue Effects in the Clinic) estimations, the likelihood of myelopathy is projected at 0.2%, 6%, and 50% for dose levels of 50Gy, 60Gy, and 69Gy, respectively, when considering equivalent doses of 2Gy.3 For diseases located outside the spine, a common conventional dose constraint for the spinal cord is often established at 45Gy. The aim is to minimize the potential risk for myelopathy, particularly as the spinal cord serves as an organ at risk. In the context of spinal RT, higher doses are necessary to achieve an effective local control. As a result, doses of up to 54Gy are commonly used, even though they harbor a risk of approximately 1%–2% for myelopathy.4 To justify this risk, a certain level of treatment success must be attainable.
There are mainly 2 types of radiation-induced myelopathy: early and late myelopathy. Early myelopathy appears typically 2–4 months after radiotherapy, and is associated with large volumes of irradiated spine than higher doses.5 It typically shows electrifying pain, the L´hermitte syndrome, and is mostly self-limiting after a few months. Late myelopathy is associated with higher irradiation doses, often leads to serious neurological deficits, and can be permanent.5 Treatment usually consists of corticosteroids. Similar to radionecrosis after cranial radiotherapy,6,7 bevacizumab is a potential treatment option for radiation myelopathy and has shown promising results in some case reports.8–11 Another recent case report suggests intravenous immune globulin as a treatment for delayed radiation myelopathy.12 To conclude, there are several treatment approaches to this serious adverse effect, but none of them is reliable and mostly only alleviates the symptoms. Avoiding this radiation-induced toxicity should, therefore, be of high priority while treating tumors of the spinal cord.
The following review article provides an overview of the existing literature pertaining to radiation schemes and techniques utilized in the management of some of the most prevalent primary spinal tumors, namely spinal glioma, spinal ependymoma, and spinal meningioma.
Methods
The literature research was conducted using the PubMed database. The following search terms were entered as primary search: “((spinal[title]) OR (spine[title])) AND ((radiation[Title/Abstract]) OR (irradiation[Title/Abstract]) OR (radiotherapy[Title/Abstract]) OR (proton[Title/Abstract]) OR (radiosurgery[title/abstract])) AND ((glioma[title]) OR (gliomas[title]) OR (Astrocytoma[title]) OR (astrocytomas[title]) OR (glioblastoma[title]) OR (glioblastomas[title]))” for spinal glioma, “((spinal[title]) OR (spine[title])) AND ((radiotherapy[title/abstract]) OR (radiation[title/abstract]) OR (proton[Title/Abstract]) OR (radiosurgery[title])) AND ((ependymoma[title]) OR (ependymomas[title]))” for spinal ependymoma, and “((spinal[title]) OR (spine[title])) AND ((radiotherapy[title/abstract]) OR (radiation[title/abstract]) OR (proton[Title/Abstract]) OR (radiosurgery[title/abstract])) AND ((meningioma[Title]) OR (meningiomas[title]))” for spinal meningiomas. The abstracts of the resulting articles were screened for suitable articles. The results of the PubMed search are shown in Figure 1. Additionally, the references of the retrieved articles were used to identify additional articles. Table 1 gives an overview of selected studies from the literature.
Overview of the Literature on Spinal Glioma and Ependymoma Including the Oxford Level of Evidence Estimated by the authors
| Article | Patients | Treatment | Irradiation dose | Survival |
|---|---|---|---|---|
| Corradini et al.13 | n = 16 7 primary glioma 9 secondary glioma 10 WHO IV 4 WHO III 2 WHO II | RT 16 (10 RT + TMZ) GTR 1 STR 9 PE 7 | Median dose 45Gy (range 30–54Gy) median dose per fraction 1.8Gy (range 1.8–3.0Gy) | Median OS 6 months Mean OS ≥ 45Gy 64.0 months vs. mean OS < 45Gy, 2.5 months (P < .001) Mean OS Surgery + RT 63.9 months vs. mean RT 2.7 months (P < .001) |
| Rodrigues et al.14 | n = 52 48 astrocytoma 2 oligodendroglioma 2 mixed glioma | RT 52 GTR 5 STR 20 PE 27 | median dose 50Gy in 25fx (20Gy in 10fx to 60Gy in 30fx) | 5-y OS 54% 5-y PFS 58% 10-y OS 45% 10-y PFS 43% |
| Zorlu et al.15 | n = 26 20 grades I–II 4 grade III | RT 26 GTR 2 STR 10 PE 14 | median dose 49.5Gy (range 35–60Gy) median fraction dose 1.5Gy (range 1–2Gy) | 5-y OS 45% 5-y PFS 40% 5-y OS > 45Gy 48% vs. 5-y OS ≤ 45Gy 29% P = .2 |
| Shirato et al.16 | n = 36 7 astrocytoma 4 anaplastic astrocytoma 2 glioblastoma 18 ependymoma 4 myxopapillary ependymoma | RT 21 GTR 14 (1 Astrocytoma, 13 Ependymoma) STR 8 PE 14 | Astrocytoma median dose 45Gy (35–50Gy) High-grade astrocytic tumors 50Gy (40–65Gy) Ependymal tumors 40Gy (30–50Gy) | 5-y OS 96% (ependymoma) 5-y OS 50% (astrocytoma) |
| Kahn et al.17 | n = 32 15 ependymoma 17 astrocytoma 1 oligodendroglioma | RT 32 (10 proton) STR 19 (8 astrocytoma, 11 ependymoma) PE 11 (8 astrocytoma, 3 ependymoma) | mean 51Gy (n = 22) (range 45–54.45Gy) | 5-y OS 65% 5-y PFS 61% 5-y OS (ependymoma) 86% 5-y OS (astrocytoma) 52% |
| Garcia et al.18 | n = 37 (14 children) 26 intramedullary (14 Astrocytoma, 8 ependymoma, 3 unknown, 1 diffuse histiocytic lymphoma) 11 conus/cauda (1 astrocytoma, 10 ependymoma) | RT 37 GTR 1 STR 8 PE 14 | Range 30–50Gy Range fraction dose 1.7–2.0Gy | 5-y OS 70% 10-y OS 58% <40Gy 90% died of recurrence ≥40Gy 75% control of tumor |
| Linstadt et al.19 | n = 42 21 ependymoma 12 low-grade astrocytoma 3 high-grade glioma 39 local RT 3 craniospinal RT | RT 42 (39 local, 3 craniospinal) GTR 15 (15 ependymoma) STR 19 (14 ependymoma, 5 astrocytoma) PE (5 ependymoma, 10 astrocytoma) | Mean 50Gy (range 45.0–54.7Gy) (n = 39) 3 received craniospinal RT | 10-y OS 91% (low-grade astrocytoma) 10-y OS 93% (ependymoma) High-grade astrocytoma lived not longer than 8 months |
| Sandler et al.20 | n = 21 18 LGSG 2 HGSG 15 RT 3 GTR, STR 7, PE 11 | RT 15 GTR 3 STR 7 PE 11 | Range 35.25–60.00 Gy | 5-y OS 57% 5-y PFS 44% 10-y OS 57% 10-y PFS 30% |
| Minehan et al.21 | n = 136 69 pilocytic astrocytoma 40 astrocytoma 19 anaplastic astrocytoma 8 glioblastoma | RT 102 GTR 22 STR 34 PE 80 | Median 48.95Gy ± 8.04Gy | Median OS (pilocytic) 39.9 years Median OS (astrocytic) 1.85 years Median OS (astrocytic) > 35Gy 26 months vs. median OS (astrocytic) ≤ 35Gy: 9 months (P = .04) |
| Nunna et al.22 | n = 396 (grade III and IV) | RT 277 (78 IMRT, 5 proton) GTR 23 STR 198 Extent unknown 105 | 30.9Gy ± 22.9Gy fraction dose of 1.9Gy ± 6.1Gy | Mean OS 24.5 months |
| Shaw et al.23 | n = 22 12 ependymoma 10 myxopapillary ependymoma | RT 8 GTR 8 STR 11 PE 3 | Median 50Gy Range 36–57Gy | 5-y and 10-y OS 95% 5-y PFS 81% 10-PFS 71% ≤50Gy 35% failure >50Gy 20% failure |
| Choi et al.24 | n = 45 (all astrocytoma) WHO I 6 WHO II 14 WHO III 12 WHO IV 13 | RT 45 (37 postOp, 6 definitiv, 6 salvage, 4 craniospinal) GTR 6 STR 18 PTR 6 PE 3 | Median 50.4Gy (range 42.5–54.0Gy) Median fraction 1.8Gy (range 1.5–2.5Gy) | Median OS 52 months Median PFS 24 months |
| Byun et al.25 | n = 25 Grade 1 12 Grade 2 12 Grade 3 1 6 myxopapillary | RT 25 (21 local, 4 craniospinal) | Range 44.0–59, 4Gy Range lumbosacral 57–59, 4Gy Range cervicothoracic 45–50.4Gy | 5-y OS 83.7% 5-y PFS 70.8% |
| Tsai et al.26 | n = 51 All myxopapillary | RT 31 GTR 28 STR 22 PE 1 | Median 50.4Gy (range 44.2–60Gy) Median fraction 1.8Gy (range 1.5–2Gy) | median OS 11 y 10-y OS 93% 10-y PFS 63% |
| Lee SH et al.27 | n = 88 24 myxopaillary 61 ependymoma 3 anaplastic | RT 20 GTR 72 STR 15 PTR 1 | Range 45–50Gy Range fraction 1.5–2Gy | 5-y PFS 87% 10-y PFS 89% |
| Pica et al.28 | n = 85 All myxopapillary | RT 47 GTR 40 STR 43 PE 2 | Median 50.4Gy (range 22.2–59.4Gy) Fraction 1.8 (range 1.5–2.0Gy) | 5-y PFS 67.5% 5-y PFS OP 50,4% 5-y PFS OP + RT 74, 8% |
| Wahab et al.29 | n = 22 Grade 2 13 grade 1 9 (myxopapillary) | RT 22 (20 postOp, 2 salvage) GTR 2 STR 20 | Median 45.0Gy (range 30.0–54.0Gy) Median fraction 1.8Gy (range 1.5– 2.5Gy) | 5-y OS 78% 10-y OS 64% 5-y and 10-y PFS 80% |
| Akyurek et al.30 | n = 35 All myxopapillary | RT 22 GTR 21 STR 13 PE 1 | Median 50.4Gy (range 44.3–56Gy) Median fraction 1.8Gy (range 1.5Gy–2Gy) | 5-y and 10-y OS 97% 5-y PFS 70% 10-y PFS 62% |
| Volpp et al.31 | n = 23 15 ependymoma 6 myxopapillary 2 not given | RT 5 GTR 9 STR 14 | Mean 45Gy (range 39–50.4Gy) Fraction 1.8Gy | 5-y OS 77% 9-y OS 63% |
Abbreviations: 10-y OS = 10-y overall survival; 5-y OS = 5-y overall survival; PE = only biopsy taken; PTR = partial tumor resection; TMZ = temozolomide.
Spinal Glioma
Spinal gliomas or astrocytomas are not categorized as a distinct entity by the 2021 World Health Organization (WHO) classification of central nervous system (CNS) tumors.32 Instead, they are considered a subset of the more commonly recognized cerebral gliomas, encompassing grades 1–4.32 Due to their rare occurrence compared to cranial gliomas, treatment approaches are often copied from strategies applied to their cranial counterparts, such as gross total resection (GTR), RT, or the use of temozolomide.13,33–35 Nevertheless, in contrast to cranial gliomas, the available literature lacks clear and well-defined treatment recommendations. The National Comprehensive Cancer Network (NCCN) guideline (Version 1.2023) does not give any specific treatment recommendations and refers to the treatment of spinal glioma directly to their cranial counterparts. Basically, resection should be considered as a primary treatment for spinal, for local control, and preserving of neurological functions.34 The combination of surgery and radiotherapy provided significantly better results than RT alone (mean overall survival [OS] 63.0 months vs. 2.7 months, P = .001).13 Also, patients receiving RT additively to resection seem to benefit, compared to resection alone (P = .001 for 36 non-pilocytic, P = .14 for 43 pilocytic).21 A meta-analysis by Hamilton et al. was only partly able to reproduce these results, with RT decreasing mortality in high-grade spinal glioma (HGSG) and increasing mortality for low-grade spinal glioma (LGSG): for RT versus no RT, the 5-year OS rate was 30.3% versus 22.2% in HGSG and 51.5% versus 79.5% in LGSG, the 10-year OS rate was 21.3% versus 14.2% for HGSG and 42.3% versus 74.3% versus for LGSG, respectively.36 However, it is important to acknowledge the potential bias in these results, as the cohorts receiving RT and those without might exhibit differences that could impact the outcomes.
Due to the risk of myelopathy, the dose applied to spinal gliomas needs to be lower than in cranial gliomas. However, the dose still has to be sufficient for tumor control. Several studies compared the outcomes compared to the prescribed dose. Zorlu et al. found in a study of 26 patients an OS trend for patients receiving more than 45Gy or 45Gy or less with 5-year OS of 48% versus 29% (log rank, P = .2), respectively.15 Corradini et al. found a similar but significant relationship for patients receiving dose levels of 45Gy or more versus less than 45Gy with a mean OS of 64.0 months versus 2.5 months for less than 45Gy (P < .001) in a cohort of 16 patients.13 Similar dose relations were found for 40Gy or more versus less than 40Gy18 and 35Gy,37 preferring the higher dose in each of those models. The NCCN guidelines of CNS cancers (Version 1.2023) recommend to apply doses ranging from 45 to 54Gy in 1.8Gy dose per fraction for spinal tumors, not specifying the exact entity. Below the conus medullaris doses up to 60Gy (59.4Gy in 1.8Gy fractions) are to be considered according to histology.
Concerning treatment technique, photon therapy with intensity-modulated radiotherapy (IMRT) remains the standard.17,22 An example of an IMRT plan can be seen in Figure 2, which represents an ependymoma patient, but does not significantly differ from plans for glioma patients. A comparison of modern photon versus proton therapy in a cohort study by Kahn et al. shows a worse impact on survival concerning protons versus photons (hazard ratio = 40, P = .02), despite of the proton cohort having more favorable demographics.17 The authors, however, note that the limited sample size of patients treated with proton therapy (N = 10) is insufficient to draw definitive conclusions regarding the superiority of photons (N = 22).17 But more data concerning a comparison of different RT techniques are warranted.
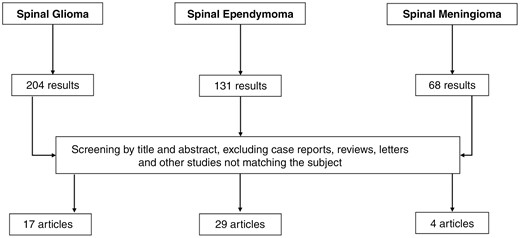
Flowchart showing the PubMed literature search with the entered terms described in the Methods section.
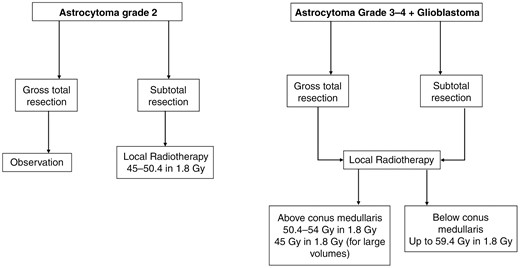
Flowchart with key treatment decisions for radiotherapy of spinal glioma (Oxford Level of evidence 3b).
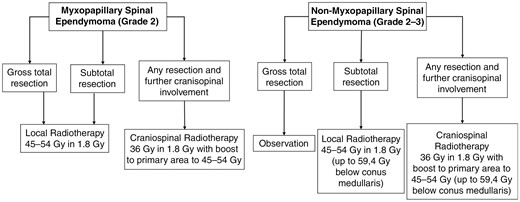
Flowchart with key treatment decisions for radiotherapy of spinal ependymoma (Oxford Level of evidence 3b).
Upon literature review, it becomes evident that definitive treatment regimens in both HGSG and LGSG remain elusive, highlighting the necessity for prospective trials that incorporate more refined treatment regimens. Notably, some authors have reported encouraging outcomes through the incorporation of temozolomide in cohort studies with a limited sample size.13,33,38 A summary of the most important treatment decisions is presented in Figure 2.
Spinal Ependymoma
Adult ependymomas are relatively rare tumors that are most commonly found in the brain but make up about 18% of all spinal cord tumors.39 The latest WHO classification of CNS tumors, updated in 2021, classifies ependymomas based on their location and molecular characteristics.32 Spinal ependymomas are recognized as a distinct entity, characterized by molecular definition through MYCN amplification.32 Depending on their histopathological features, these tumors can be assigned a grade of 2 or 3. Notably, the term “anaplastic” is no longer employed to describe grade 3 ependymomas in the updated classification.32,40 In the CNS WHO 2021 classification, myxopapillary ependymoma remains an independent entity. However, its grading has been reclassified from grade 1 to grade 2. This change is attributed to its high recurrence rate, which is comparable to other grade 2 spinal ependymomas.32 Regarding treatment, the primary goal should be achieving optimal GTR, which results in the most favorable outcomes.27,28,31,41 As the most frequent site of recurrence is typically at the primary site, adjuvant RT is typically administered locally to increase local control.31,42,43
As ependymomas represent the third most frequent CNS tumor for children, most treatment recommendations originate from pediatric protocols.44–47 An early report from 1984 by Read et al. with 79 ependymomas (including 26 spinal cases) with no specified subtype suggested that adjuvant radiotherapy might be beneficial for all ependymoma patients, regardless of their resection status.48 However, this perspective was subsequently challenged by later investigations. For instance, Lee et al. stated in 1998 that RT should be only considered for cases where GTR could not be achieved.27,49 Most of the existing literature concurs that radiotherapy is advisable in cases of residual tumor after surgery, as local control is only about 30%–50% after subtotal resection (STR), and is increased up to 60%–100% after RT.25,27,29,41,50,51
While non-myxopapillary spinal ependymoma does not seem to require adjuvant radiotherapy following GTR,41,50 myxopapillary ependymomas (MPE) are different in this regard. Despite exhibiting a more favorable OS compared to other ependymoma subtypes, MPE present a relatively high recurrence rate (as reported by Boström et al. at 19%) even after GTR.52,53 Several trials dedicated to the treatment of MPE show that adjuvant treatment might also be required after complete resection. For instance, Akyurek et al. in 2006, Pica et al. in 2009, and Tsai et al. in 2014 conducted analyses involving only patients with myxopapillary ependymoma, concluding that adjuvant radiotherapy should be administered for MPR regardless of the extent of resection.26,28,30 In contrast to the results of the mentioned study, Lee SH et al. demonstrated different findings in their study involving 61 patients, 24 of whom had MPE. Their analysis did not show a significant difference in 10-year progression-free survival (PFS) between patients who underwent GTR with and without adjuvant radiotherapy (P = .771).27 However, it is important to note that this study did not specifically examine MPE separately. More details of the data presented are listed in Table 1 and presented in Figure 3.
Radiation doses range from 44Gy to 54Gy in dose per fraction of 1.8/2.0Gy in the majority of the literature, matching to the aforementioned recommendations of the NCCN guidelines.25,26,27,50 The highest reported dose was 59.4Gy in 1.8Gy fraction dose, which was typically employed for ependymomas located in the lumbosacral region.25 This choice is attributed to the cauda equina being less susceptible to radiation damage compared to the spinal cord itself.25,26 Pica et al. compared doses of 50.4Gy and higher with lower doses for myxopapillary ependymoma and found a benefit for doses of 50.4Gy or above (5-year PFS 74.8% vs. 50.4%).28 In line with this data, the EANO guidelines recommend applying postoperative doses of 45–54Gy in conventionally fractionated regimens as 45Gy seems to be the threshold to worse control, and at least 50Gy for MPE after STR.47 As mentioned in the beginning, critical doses begin above 55Gy (in children even above 40Gy) as the risk for myelopathy increases further than 2%.2,3 Concerning the size of the irradiation field, the NCCN recommends a craniocaudal expansion of the gross tumor volume by 1–2 cm, the EANO guideline, however, only 5–10 mm.47 An example of a treatment plan can be seen in Figure 5. But, traditionally, also 2 vertebral bodies above and below the volume were included.
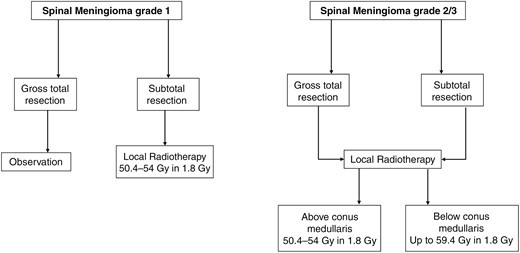
Flowchart with key treatment decisions for radiotherapy of spinal meningioma (Oxford Level of evidence 4).
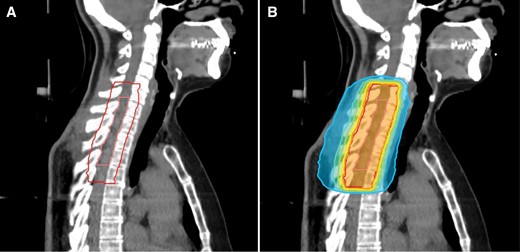
A treatment plan of a patient with spinal ependymoma CNS WHO grade 2 receiving postoperative radiotherapy after subtotal resection. Image A shows the area of resection (inner contour) and the planning target volume (PTV, outer contour) covering the resection area with an axial margin of 1.2 cm and a craniocaudal margin of 2.0 cm. Image B shows the dose distribution of the respective plan prescribed to 50.4Gy in 28 fractions. The inner orange isodose represents 95% of the prescription dose, yellow 90%, green 80%, turquoise 70%, and blue 50%.
While some studies have explored the use of stereotactic body radiotherapy, this approach has not yet been widely integrated into standard treatment recommendations, and is only recommended as an alternative for local relapses.47 Unlike pediatric patients, larger studies focusing on proton therapy for spinal ependymoma are lacking.54,55 Still, the EANO guidelines mention proton therapy as an option next to conventional 3-dimensional techniques and intensity-modulated arc therapy.47 Currently, fractionated photon RT with doses typically around 50.4Gy delivered in 1.8Gy dose per fraction remains the primary approach for radiation therapy in cases of spinal ependymoma.
Spinal Meningioma
Primary spinal meningiomas are rare, and surgical resection generally serves as the primary treatment approach, effectively addressing the majority of issues associated with these tumors.56 However, there is a paucity of available literature that specifically addresses the use of postoperative RT. The largest cohort analysis of radiotherapy for spinal meningiomas involved the examination of 268 patients who received radiotherapy from a total of 10 458 patients in the database.57 Among these cases, 137 patients underwent RT alone, while 131 received a combination of RT and surgery.57 Although this analysis did not demonstrate a significant survival advantage for patients who underwent radiotherapy, it appears that patients with specific risk factors, such as tumor size or grade 2 and 3 meningiomas, were more inclined to receive radiotherapy. This observation suggests a potential bias in patient selection within the study.
Most patients who underwent adjuvant RT for meningiomas were treated with conventionally fractionated regimens delivering doses of 50.4 to 54 Gy in 1.8 Gy fractions.57–59 Although stereotactic radiotherapy has been suggested as a viable alternative to primary resection, limited data exist in this regard.60 Due to the scarcity of information regarding RT for spinal meningiomas, it is advisable to adhere to recommendations for cranial meningiomas as outlined in the EANO guidelines.56 The most important decisions are presented in Figure 4. However, given the lack of real data, studies, preferably prospective, are warranted.
Conclusions
Despite of limited evidence, RT is the main treatment, next to surgery, for the most frequently observed spinal tumors.35,47,56 Typically, surgery is the preferred choice, while RT serves as a postoperative treatment in case of subtotal resection or high recurrence rate of the tumor.22,27,28,37,57 As demonstrated in the previous sections, most evidence is generated in cohort studies with rather small case series. Large registry studies could be helpful to gather more information about treatment schedules. Furthermore, it is expected that the histology of the tumor will have a more significant impact on the appropriate prescription doses, as seen in the example of the recommendation to deliver a higher dose for MPE.47 Advanced techniques and novel technologies need to be further explored to optimize treatment outcomes and minimize damage to surrounding tissues. Additionally, more evidence is required to evaluate the risk of myelopathy associated with delivering high doses to large/lengthy volumes of the spinal cord. But so far, conventionally fractionated RT remains the first choice when treating spinal tumors. To define the optimal indications and prescription schemes for RT of spinal tumors further data, especially prospective data, are warranted.
Funding
None declared.
Conflict of interest statement
M.N. received speaker honoraria from Brainlab that did not affect the current work. R.B., E.H., and C.B. state that they have no conflicts of interest.
